37033 Mistletoe Rd · Squaw Valley, CA
Flood risk 1/10 · Minimal
- FEMA flood zone
- X (unshaded)
- Chance of flooding over 30 yrs
- 0.0%
- Est. flood insurance / yr
- $507 – $1,088
Fire risk 10/10 · Severe
- Est. fire insurance / yr
- $659 – $1,223
Heat risk 7/10 · Major
- Hot days now (above 103°F)
- 8 days/yr
- Hot days in 30 yrs
- 22 days/yr
Wind risk 1/10 · Minimal
- Chance of severe wind over 30 yrs
- —
Air-quality risk 10/10 · Severe
- Unhealthy air days now
- 56 days/yr
- Unhealthy air days in 30 yrs
- 60 days/yr
Risk factors via First Street. Map © Google.
Why this score? — see what drove the B grade
The composite is a weighted blend of 9 inputs, each scored 0–100. Each bar is that input's sub-score; the figure is the points it added to the 100-point composite (weight × sub-score).
- Cash flow +30.0/30.0
- ARV discount +12.7/15.0
- DSCR +10.0/10.0
- 1% rule +8.6/10.0
- Livability +3.0/5.0
- Rent growth +2.5/5.0
- Condition / age +2.5/5.0
- Schools +2.0/10.0
- Appreciation +1.2/10.0
$159,900
🖨 Deal sheet (PDF) 📄 Offer letter ✓ Due diligence
Listing remarks MLS
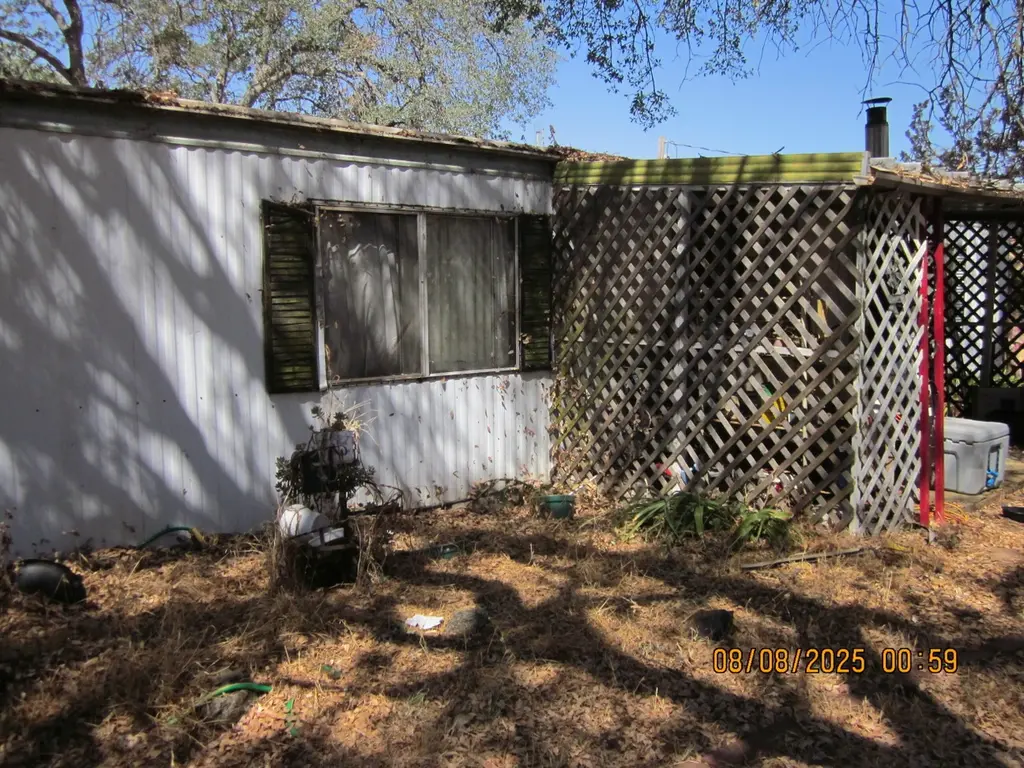
Manufactured Home on 2.54 Acres, 3 Bedroom, 2 Bath with an outbuilding, Beautiful Views Enjoy Rural Living! Enough room for a garden, Large Animals, Chickens, Don't miss out this property, Call today!!
Key facts
- Garden
- Outbuilding
- 2.54 acres
Tags
Property features AI
Exterior
- Parking: Potential RV parking; Work/shop area
- Utilities: Electricity connected; Electric service on; Septic tank
- Home design: Mobile home; Other-type roof
- Construction: Metal siding; Wood subfloor foundation
- Exterior features: One-level property; Foothill and pasture setting; Horses allowed; Shed(s); Potential RV parking; Work/shop area
Interior
- Flooring: Carpet
- Bathrooms: 2 bathrooms
- Heating & cooling: Floor or wall heating units; Evaporative cooling
- Interior features: Carpet flooring; No basement
- Laundry & utility: Laundry room inside
Neighborhood map
What this means for you Summary
Snapshot
- This is a 3-bed/2.0-bath manufactured listed at $160k.
Deal economics
- At list price, monthly cash flow is $726 ($9k/yr) — positive.
- The deal already cash-flows at list — no discount required.
- Meets the 1% rule at list price ($2k rent vs $160k).
- Recommended offer: $158k (1.5% below list) — sets the bar for market timing.
- Cap rate 11.7% vs local median 3.7% in Squaw Valley — top-decile yield for the area; either an underpriced asset or a hidden risk that comps aren't pricing in. Stress-test before assuming the spread holds.
Location & tenants
- Location reads 60/100 on livability (#583 in CA) — a middle-class / working-renter tenant base. Strengths: housing A+, employment A-; Watch: amenities F, commute F, cost of living F.
- Cutler-Orosi Joint Unified (town): math 15% / reading 33% proficiency, ranked #443 of 517 in CA (top 86%) — low school quality limits family demand, transient renter base, plan for 1-2y turnover; 91% free/reduced lunch — lower-income household profile, screen leases tightly.
- Zoned schools: Palm Elementary (math 17% / reading 33%, grade F, #959 of 1,571 statewide, top 62%, 567 students, 94% FRL); El Monte Middle (math 12% / reading 30%, grade F, #408 of 498 statewide, top 82%, 923 students, 97% FRL); Orosi High (math 23% / reading 53%, grade F, #571 of 1,170 statewide, top 49%, 1,049 students, 95% FRL) — zoned schools at 96% FRL track the district average.
- Market conditions: 77 active listings in the ZIP; 2,426 units permitted in Fresno County in 2024 (296 in 5+ unit buildings).
Forward outlook
- Local home prices are declining (-3.0%/yr); year-one equity from $1k of loan paydown is wiped out by about $5k of value loss. Plan a longer hold.
- Fresno County population projected at +11% by 2050 — modest demand growth; plan on rents tracking national, not racing it.
- At projected returns (-3.0% appreciation + 3.0% rent growth), your $45k cash investment doubles in ~7 years — after that, you're playing with house money.
Negotiation context
- It's been on market 24 days — a 2% lower offer ($158k) is reasonable based on typical stale-listing flexibility.
- 2 sale attempts with the ask held roughly flat each time — persistent listings suggest the price (not the market) is what's stuck; bring a comps-based counter.
Risks & watch-outs
- Climate carrying-cost: severe wildfire risk; extreme-heat days projected 8→22/yr by 2055 (HVAC capex compounding) — expect insurance premiums to compound above CPI over the hold.
Questions for the listing agent
- Built in 1964 — when were the roof, HVAC, electrical panel, plumbing, and water heater last replaced?
- Is there a deadline driving the sale (1031 exchange, divorce, estate, relocation)? That informs how much negotiation room exists.
- Schools are F-rated, which usually means shorter tenancies and higher turnover. Who's the typical renter profile here, and what's been the actual vacancy rate?
- What's the average days-on-market for RENTAL listings here right now (not sales)? A rising rental-DOM trend means longer vacancies and softer asking-rent achievability than the comps imply.
- What's the recent tenant-quality profile in this submarket — average credit score on applications, eviction rate, late-payment / NSF rate, and stable-employment percentage? A property-management company in the area should have these aggregated.
- How much new for-sale + rental construction is in the pipeline within 1–3 miles? Heavy new supply typically softens prices + rents 12–24 months out; constrained supply supports both.
Investment metrics
- 1% rule
- 1.36% ✓
- Cap rate
- 11.74%
- Cash-on-cash
- 19.45%
- DSCR
- 1.87
- GRM
- 6.1
CMA / ARV
- ARV (median comp)
- $180,575
- List price
- $159,900
- Delta
- -11.45%
- Verdict
- UNDERPRICED
- Comps
- 7 within 1.0 mi
Projected returns pro-forma
-3.0% appreciation · 3.0% rent growth · sell at horizon
- IRR
- 11.4%
- Equity multiple
- 1.45×
- Total profit
- $20,281
- Equity at exit
- $23,842
- IRR
- 20.4%
- Equity multiple
- 2.72×
- Total profit
- $77,039
- Equity at exit
- $13,825
Cash invested: $44,772 (down + closing). Projections, not guarantees.
Landlord ↔ Tenant lean methodology
- Overall (STATE)
- 18 Strongly Tenant-Friendly
- State California
- 18 Strongly Tenant-Friendly · D+13
- County
- — inherits STATE
- City
- — inherits STATE
ZIP-level market 93675
- Home prices YoY
- -2.1%
- Active inventory
- 77
- Price-to-rent
- 6.1×
Monthly cashflow live
- Estimated rent
- $2,175 medium interval (Pro) →
- Mortgage (P&I)
- −$839
- Tax from tax record
- −$87 /mo · $1,045/yr
- Insurance
- −$67
- HOA
- −$0
- Vacancy / Maint / Mgmt
- −$457
- Net cashflow
- $726
Break-even live
Sensitivity live
| Price | -10% $816 | -5% $771 | +0% $726 | +5% $681 | +10% $635 |
|---|---|---|---|---|---|
| Rent | -10% $554 | -5% $640 | +0% $726 | +5% $812 | +10% $898 |
| Rate | -1.0pp $806 | -0.5pp $766 | base $726 | +0.5pp $684 | +1.0pp $642 |
UW: 25.0% down · 7.5% · 30yr · 1.5% tax · 5.0% vac · 8.0% maint · 8.0% mgmt
Financing live
Cash to close
- Down payment
- $39,975
- Closing costs
- $4,797
- Reserves months
- —
- Total cash needed
- —
Loan-product check · same deal, 3 products live
Conventional
25% down · 7.5% · 30yr
- Down + closing
- —
- Monthly P&I
- —
- Monthly cashflow
- —
- DSCR
- —
- Eligible?
- —
Personal DTI + credit; lowest rate.
DSCR
20% down · 8.5% · 30yr
- Down + closing
- —
- Monthly P&I
- —
- Monthly cashflow
- —
- DSCR
- —
- Eligible?
- —
No personal income docs; deal must DSCR.
Hard money
10% down · 12.0% · 12mo
- Down + closing
- —
- Monthly P&I
- —
- Monthly cashflow
- —
- DSCR
- —
- Eligible?
- —
Short-term bridge; refi at stabilization.
Listing history 20 events
-
2026-06-21days on market $159,900 Active 24 DOM
-
2026-06-18days on market $159,900 Active 21 DOM
-
2026-06-17days on market $159,900 Active 20 DOM
-
2026-06-16days on market $159,900 Active 19 DOM
-
2026-06-15days on market $159,900 Active 18 DOM
-
2026-06-14days on market $159,900 Active 16 DOM
-
2026-06-13days on market $159,900 Active 15 DOM
-
2026-06-10days on market $159,900 Active 13 DOM
-
2026-06-09days on market $159,900 Active 12 DOM
-
2026-06-08days on market $159,900 Active 11 DOM
-
2026-06-07days on market $159,900 Active 10 DOM
-
2026-06-05days on market $159,900 Active 7 DOM
-
2026-06-03days on market $159,900 Active 6 DOM
-
2026-06-02days on market $159,900 Active 5 DOM
-
2026-06-01days on market $159,900 Active 4 DOM
-
2026-05-31days on market $159,900 Active 3 DOM
-
2026-05-30days on market $159,900 Active 2 DOM
-
2026-03-12price $159,900 202-char remark
Show marketing remark (202 chars)
Manufactured Home on 2.54 Acres, 3 Bedroom, 2 Bath with an outbuilding, Beautiful Views Enjoy Rural Living! Enough room for a garden, Large Animals, Chickens, Don't miss out this property, Call today!!
-
2025-11-18price $169,900 202-char remark
Show marketing remark (202 chars)
Manufactured Home on 2.54 Acres, 3 Bedroom, 2 Bath with an outbuilding, Beautiful Views Enjoy Rural Living! Enough room for a garden, Large Animals, Chickens, Don't miss out this property, Call today!!
-
2025-08-11$174,900 Active 202-char remark
Show marketing remark (202 chars)
Manufactured Home on 2.54 Acres, 3 Bedroom, 2 Bath with an outbuilding, Beautiful Views Enjoy Rural Living! Enough room for a garden, Large Animals, Chickens, Don't miss out this property, Call today!!
ⓘ Source: listings_history table (triggers on properties + properties_extension) + one-shot
backfill from property_details.listing_events for pre-trigger history.
Tax reassessment forecast CA · Resets to sale price
- Current annual tax
- $1,045 · $87/mo
- Projected year-2 tax
- $1,215 · $101/mo
- Expected delta
- +$170/yr (+$14/mo · 16.3%)
ⓘ Screening estimate from a state-policy table — verify with the county assessor before closing.
Climate risk First Street
- Flood 1/10 Low FEMA zone X (unshaded) · 0% chance over 30 yrs
- Wildfire 10/10 Extreme
- Heat 7/10 Severe 8 d/yr ≥103°F today · 22 d/yr by 30 yrs out
- Wind 1/10 Low
- Air quality 10/10 Extreme 56 unhealthy d/yr today · 60 by 30 yrs out
Nearby sold comps map
Loading sold comps map…
Walkable amenities ~0.75 mi
Loading nearby amenities…
Taxation est. · year 1
- Rental income
- $26,097
- − Mortgage interest
- −$8,957
- − Property taxes
- −$1,045
- − Insurance
- −$800
- − Repairs & maintenance
- −$2,088
- − Management
- −$2,088
- − Depreciation
- −$4,652
- Taxable income
- $6,469
- Est. tax owed @ 24.0%
- −$1,552
- After-tax cash flow
- $7,157/yr
For passive investors: Depreciation is non-cash, so a rental often shows a tax loss while cash-flowing — sheltering income. Rental losses are passive: they offset passive income freely, and up to $25,000/yr can offset ordinary (W-2) income if you actively participate and your MAGI is under $100k (phasing out to $0 by $150k); unused losses carry forward. On sale, claimed depreciation is recaptured at up to 25%, and gains may owe capital-gains tax (a 1031 exchange can defer both). Figures are a year-1 estimate at your 24.0% rate — not tax advice; consult a CPA.
Schools (NCES district)
- District
- Cutler-Orosi Joint Unified
- NCES district ID
- 0610350
- Math proficiency
- 15% ▼ -21.00%
- Reading proficiency
- 33% ▼ -9.00%
- Median HH income
- $33,611
- Composite
- 19.59/100
- National rank
- #8756
- State rank
- #443 of 517 in CA
Livability — Squaw Valley
- Score
- 60/100
- State rank
- #583
- US rank
- #18982
Category grades
Schools grade is shown separately in the Schools card above.
Census & demographics
- Census place
- Squaw Valley, CA
- City population
- 3,739
- Population (ZIP)
- 3,739
Population outlook (Fresno County) Hauer SSP2
- Today (2025)
- 1,042,971 people
- By 2030
- 1,072,198 · +2.8%
- By 2040
- 1,122,408 · +7.6%
- By 2050
- 1,157,251 · +11.0%
- By 2075
- 1,182,575 · +13.4%
- By 2100
- 1,105,899 · +6.0%
Race, ethnicity, and origin ACS 2023
- Neighborhood character
- Diverse neighborhood (Simpson 0.63)
- Race & ethnicity
- White 45% Hispanic / Latino 39% Asian 11% Two or more races 10%
- Hispanic origin (detail)
- Mexican 38%
- Common ancestry
- Serbian 1% Slovak 1%
- Foreign-born
- 22% · Canada, China
- Languages at home
- 61% English-only · Spanish 30% Other Asian/Pacific 5% Chinese 2%
Political lean MEDSL · Fresno
- 2024 margin
- Toss-up / Even · D 46.5% · R 50.9% · Other 2.6%
- 2008→2024 swing
- -6.5pp toward R · 2008: 2.1pp · 2024: -4.4pp
- All cycles
- 2024: R+4.4 2020: D+7.8 2016: D+3.9 2012: R+2.9 2008: D+2.1
Not yet ingested
- Civics
- —
Market trends
- HPI YoY
- ▼ -7.56%
- Current HPI
- 343.5472
- Rent YoY
- —
- Metro
- —
- State GDP YoY
- ▲ 3.21%
- F500 in state
- 116
Industry mix (Fortune 500 HQ in CA)
| Industry | F500 HQs | Revenue |
|---|---|---|
| Technology | 27 | $1,492B |
|
||
| Financial Services | 3 | $174B |
|
||
| Retail | 3 | $44B |
|
||
| Insurance | 3 | $26B |
|
||
| Media / Entertainment | 2 | $115B |
|
||
| Pharmaceuticals / Biotech | 2 | $62B |
|
||
Price history
-8.6% since first listed4 events — show timeline
- 2026-03-12 Price Changed $159,900 TCMLS
- 2025-11-18 Price Changed $169,900 TCMLS
- 2025-08-11 Listed $159,900 FRESNOMLS
- 2025-08-11 Listed $174,900 TCMLS
Property tax history
+13.8%/yrLatest (2025): $1,045 · +234.0% YoY. Source: county tax records.
Cash-flow waterfall
monthlySold comps — $/sqft
last 12 mo · ≤1 miLoading sold comps…