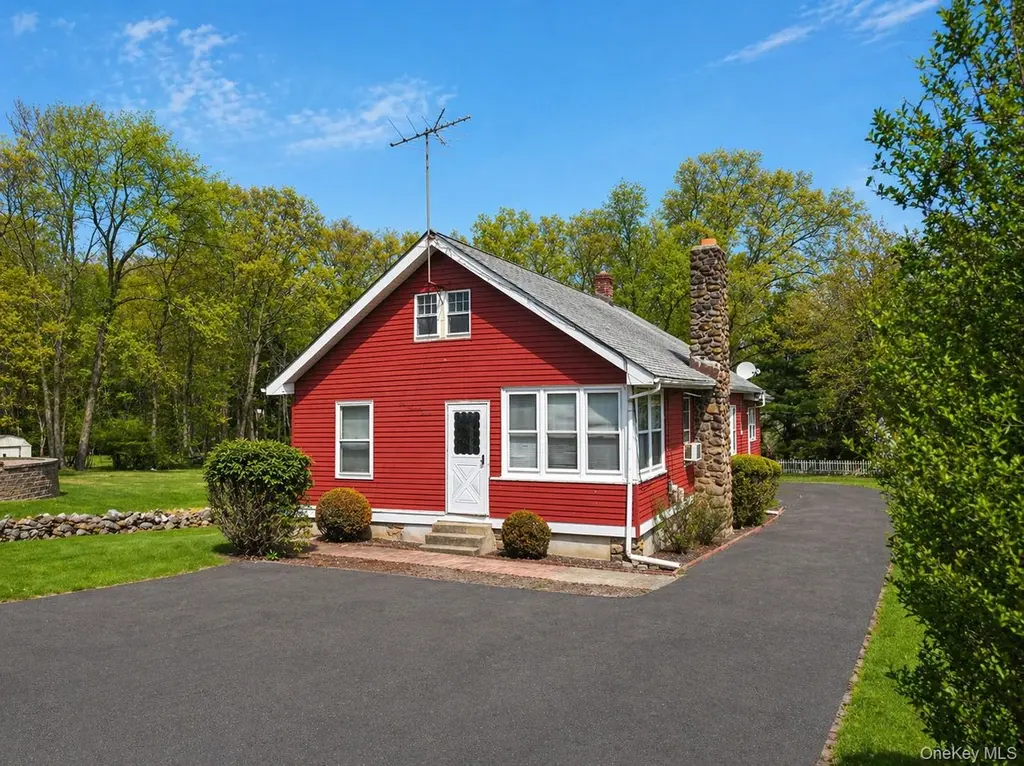
107 Western Hwy · West Nyack, NY
Flood risk 1/10 · Minimal
- FEMA flood zone
- X (unshaded)
- Chance of flooding over 30 yrs
- 0.0%
- Est. flood insurance / yr
- $473 – $860
Fire risk 3/10 · Minor
- Est. fire insurance / yr
- $691 – $1,283
Heat risk 6/10 · Moderate
- Hot days now (above 99°F)
- 7 days/yr
- Hot days in 30 yrs
- 15 days/yr
Wind risk 5/10 · Moderate
- Chance of severe wind over 30 yrs
- 26.0%
Air-quality risk 4/10 · Minor
- Unhealthy air days now
- 3 days/yr
- Unhealthy air days in 30 yrs
- 6 days/yr
Risk factors via First Street. Map © Google.
Why this score? — see what drove the D grade
The composite is a weighted blend of 9 inputs, each scored 0–100. Each bar is that input's sub-score; the figure is the points it added to the 100-point composite (weight × sub-score).
- ARV discount +15.0/15.0
- Cash flow +8.2/30.0
- Schools +6.9/10.0
- Livability +3.6/5.0
- 1% rule +3.2/10.0
- Rent growth +2.5/5.0
- Condition / age +2.5/5.0
- DSCR +2.2/10.0
- Appreciation +0.0/10.0
$499,000
🖨 Deal sheet 📄 Offer letter ✓ Due diligence
Listing remarks
This classic 3 bedroom, 2 bath ranch-style home in the highly sought-after Clarkstown Central School District offers a prime opportunity for those looking to renovate or build a custom residence. Situated on . 28 acres, this 1,898 sq. ft. property provides a spacious single-floor layout with excellent bones, just waiting for a modern touch. There is a walk up attic and full unfinished basement. Shopping, park and easy access to Route 59.
Key facts
- Walk up attic
- 0.28 acre lot
- Built 1930
Tags
Property features AI
Exterior
- Parking: Driveway
- Utilities: Public sewer; Electric service by Orange & Rockland; Natural gas connected; Electricity connected; Cable available; Phone available; Public trash collection
- Home design: Single family residence
- Construction: Frame construction; Stone foundation
- Exterior features: Frame construction; Stone foundation; Not waterfront; No additional parcels
Interior
- Kitchen: Gas range; Refrigerator
- Bedrooms: At least one bedroom on the first floor
- Bathrooms: Two full bathrooms
- Heating & cooling: Heating: Other; Cooling: Wall/window unit(s)
- Interior features: First-floor bedroom; First-floor full bathroom; Storage space; Washer/dryer hookup; Unfinished basement with storage space; Attic access via scuttle; Six total rooms
- Laundry & utility: Washer; Dryer; Gas dryer hookup in basement; Gas water heater
Neighborhood map
What this means for you Summary
Snapshot
- This is a 3-bed/2.0-bath single-family listed at $499k.
Deal economics
- At list price, monthly cash flow is $-472 ($-6k/yr) — negative.
- To cash-flow at today's rent, offer at most $416k (16.7% below list).
- To meet the 1% rule (rent ≥ 1% of price), the offer needs to be $409k (18.0% below list).
- Recommended offer: $409k (18.0% below list) — sets the bar for 1% rule.
Location & tenants
- Location reads 72/100 on livability (#340 in NY) — a middle-class / working-renter tenant base. Strengths: crime A+, employment A+, housing A+; Watch: amenities F, cost of living F.
- Clarkstown Central School District (suburban): math 72% / reading 75% proficiency, ranked #66 of 590 in NY (top 11%) — strong family-tenant draw, lease renewals of 3-5y typical; only 8% free/reduced lunch — higher-income household profile.
- Zoned schools: West Nyack Elementary School (math 72% / reading 77%, grade A, #314 of 2,108 statewide, top 17%, 314 students, 18% FRL); Felix Festa Achievement Middle School (math 57% / reading 77%, grade A-, #101 of 729 statewide, top 15%, 640 students, 19% FRL); Clarkstown South Senior High School (math 100% / reading 90%, grade A+, #93 of 1,100 statewide, top 10%, 1,345 students, 16% FRL).
- Market conditions: 46 active listings in the ZIP; 3 comparable units currently listed for rent nearby; rentals leasing fast (median 2d on market — plan ~1-2 weeks tenant-placement turnaround); 429 units permitted in Rockland County in 2024 (231 in 5+ unit buildings).
Forward outlook
- Local home prices are declining (-3.0%/yr); year-one equity from $3k of loan paydown is wiped out by about $15k of value loss. Plan a longer hold.
- Rockland County population projected at +7% by 2050 — modest demand growth; plan on rents tracking national, not racing it.
Negotiation context
- Only 10 days on market — expect competitive offers; lowballing is unlikely to land.
- Current owner paid $38k; list at $499k implies a 1213% gain — meaningful room to come down on a strong offer.
Risks & watch-outs
- Watch-outs: built in 1930 — expect roof / HVAC / electrical / plumbing capex.
- Climate carrying-cost: moderate wind risk, 26% chance of damaging wind over 30y; extreme-heat days projected 7→15/yr by 2055 (HVAC capex compounding) — expect insurance premiums to compound above CPI over the hold.
Questions for the listing agent
- What do current leases actually rent for vs. the listed asking? Can we see a recent rent roll and the last 12 months of T-12 income?
- Built in 1930 — when were the roof, HVAC, electrical panel, plumbing, and water heater last replaced?
- Is there a deadline driving the sale (1031 exchange, divorce, estate, relocation)? That informs how much negotiation room exists.
- Schools are A-rated — typically a magnet for longer-tenancy family renters. What's the average tenant stay here, and is there a school-zone premium baked into asking?
- The area grade is low — what's the realistic commute time and amenity access for the typical tenant pool here? Any planned neighborhood developments (good or bad) we should know about?
- What's the average days-on-market for RENTAL listings here right now (not sales)? A rising rental-DOM trend means longer vacancies and softer asking-rent achievability than the comps imply.
- What's the recent tenant-quality profile in this submarket — average credit score on applications, eviction rate, late-payment / NSF rate, and stable-employment percentage? A property-management company in the area should have these aggregated.
- How much new for-sale + rental construction is in the pipeline within 1–3 miles? Heavy new supply typically softens prices + rents 12–24 months out; constrained supply supports both.
Investment metrics
- 1% rule
- 0.82% ✗
- Cap rate
- 5.16%
- Cash-on-cash
- -4.06%
- DSCR
- 0.82
- GRM
- 10.2
CMA / ARV
- ARV (median comp)
- $809,054
- List price
- $499,000
- Delta
- -38.32%
- Verdict
- UNDERPRICED
- Comps
- 20 within 1.0 mi
Show comp detail 5 sales within ~0.75 mi
| Address | Dist | Beds/Ba | Sqft | Sold | Price | $/sf | Match |
|---|---|---|---|---|---|---|---|
| 107 Green Rd | 0.32mi | 3/2.0 | 1,800 (-5%) | 10mo | $784,123 | $436 | 68 |
| 12 Hobe St | 0.17mi | 4/2.0 (+1) | 2,088 (+10%) | 11mo | $760,000 | $364 | 62 |
| 77 Foxwood Rd | 0.60mi | 3/2.5 | 1,906 (+0%) | 16mo | $625,000 | $328 | 56 |
| 16 Pineview Rd | 0.26mi | 3/1.5 | 1,632 (-14%) | 15mo | $600,000 | $368 | 50 |
| 741 W Nyack Rd | 0.37mi | 2/1.5 (-1) | 1,633 (-14%) | 21mo | $720,000 | $441 | 35 |
Match score weights: distance 35% · size 25% · config 20% · recency 20%. Top-matched comps best support the ARV.
Projected returns pro-forma
-3.0% appreciation · 3.0% rent growth · sell at horizon
- IRR
- -23.1%
- Equity multiple
- 0.21×
- Total profit
- $-110,714
- Equity at exit
- $74,403
- IRR
- -17.5%
- Equity multiple
- 0.04×
- Total profit
- $-134,245
- Equity at exit
- $43,144
Cash invested: $139,720 (down + closing). Projections, not guarantees.
Landlord ↔ Tenant lean methodology
- Overall (STATE)
- 15 Strongly Tenant-Friendly
- State New York
- 15 Strongly Tenant-Friendly · D+10
- County
- — inherits STATE
- City
- — inherits STATE
ZIP-level market 10994
- Active inventory
- 46
- Price-to-rent
- 10.2×
Monthly cashflow live
- Estimated rent
- $4,089 medium interval (Pro) →
- Mortgage (P&I)
- −$2,617
- Tax from tax record
- −$878 /mo · $10,537/yr
- Insurance
- −$208
- HOA
- −$0
- Vacancy / Maint / Mgmt
- −$859
- Net cashflow
- $-472
Break-even live
UW: 25.0% down · 7.5% · 30yr · 1.5% tax · 5.0% vac · 8.0% maint · 8.0% mgmt
Financing live
Cash to close
- Down payment
- $124,750
- Closing costs
- $14,970
- Reserves months
- —
- Total cash needed
- —
Loan-product check · same deal, 3 products live
Conventional
25% down · 7.5% · 30yr
- Down + closing
- —
- Monthly P&I
- —
- Monthly cashflow
- —
- DSCR
- —
- Eligible?
- —
Personal DTI + credit; lowest rate.
DSCR
20% down · 8.5% · 30yr
- Down + closing
- —
- Monthly P&I
- —
- Monthly cashflow
- —
- DSCR
- —
- Eligible?
- —
No personal income docs; deal must DSCR.
Hard money
10% down · 12.0% · 12mo
- Down + closing
- —
- Monthly P&I
- —
- Monthly cashflow
- —
- DSCR
- —
- Eligible?
- —
Short-term bridge; refi at stabilization.
Rent comps 3 comps
| Address | Beds | Baths | Sqft | Rent | $/sqft | DOM | Units | Dist |
|---|---|---|---|---|---|---|---|---|
| 781 Western Hwy Blauvelt, NY | 4.0 | 3.0 | 1522 | $5,000 | $3.29 | 1d | 1 | 0.72mi |
| 60 S Greenbush Rd West Nyack, NY | 3.0 | 2.0 | 1518 | $2,995 | $1.97 | 12d | 1 | 0.77mi |
| 2 Gillis Ave Unit 1 Nyack, NY | 4.0 | 2.0 | 1700 | $4,250 | $2.50 | 1d | 1 | 1.22mi |
Listing history 3 events
-
2026-05-18status Pending 440-char remark
-
2026-04-27$499,000 Active 440-char remark
-
1980-03-14soldstatus $38,000
ⓘ Source: listings_history table (triggers on properties + properties_extension) + one-shot
backfill from property_details.listing_events for pre-trigger history.
Tax reassessment forecast NY · Partial reset (capped growth)
- Current annual tax
- $10,537 · $878/mo
- Projected year-2 tax
- $10,537 · $878/mo
- Expected delta
- $0/yr ($0/mo · 0.0%)
ⓘ Screening estimate from a state-policy table — verify with the county assessor before closing.
Climate risk First Street
- Flood 1/10 Low FEMA zone X (unshaded) · 0% chance over 30 yrs
- Wildfire 3/10 Moderate
- Heat 6/10 Major 7 d/yr ≥99°F today · 15 d/yr by 30 yrs out
- Wind 5/10 Major 26% chance of damaging wind over 30 yrs
- Air quality 4/10 Moderate 3 unhealthy d/yr today · 6 by 30 yrs out
Nearby sold comps map
Loading sold comps map…
Walkable amenities ~0.75 mi
Loading nearby amenities…
Taxation est. · year 1
- Rental income
- $49,073
- − Mortgage interest
- −$27,952
- − Property taxes
- −$10,537
- − Insurance
- −$2,495
- − Repairs & maintenance
- −$3,926
- − Management
- −$3,926
- − Depreciation
- −$14,516
- Taxable loss
- −$14,279
- Est. tax savings @ 24.0%
- +$3,427
- After-tax cash flow
- $-2,239/yr
For passive investors: Depreciation is non-cash, so a rental often shows a tax loss while cash-flowing — sheltering income. Rental losses are passive: they offset passive income freely, and up to $25,000/yr can offset ordinary (W-2) income if you actively participate and your MAGI is under $100k (phasing out to $0 by $150k); unused losses carry forward. On sale, claimed depreciation is recaptured at up to 25%, and gains may owe capital-gains tax (a 1031 exchange can defer both). Figures are a year-1 estimate at your 24.0% rate — not tax advice; consult a CPA.
Schools (NCES district)
- District
- Clarkstown Central School District
- NCES district ID
- 3620340
- Math proficiency
- 72% ▼ -1.00%
- Reading proficiency
- 75% ▲ 6.00%
- Median HH income
- $115,765
- Composite
- 68.55/100
- National rank
- #342
- State rank
- #66 of 590 in NY
Livability — West Nyack
- Score
- 72/100
- State rank
- #340
- US rank
- #5764
Category grades
Schools grade is shown separately in the Schools card above.
Census & demographics
- Census place
- West Nyack, NY
- City population
- 5,925
- Population (ZIP)
- 5,925
Population outlook (Rockland County) Hauer SSP2
- Today (2025)
- 339,642 people
- By 2030
- 345,987 · +1.9%
- By 2040
- 357,178 · +5.2%
- By 2050
- 362,456 · +6.7%
- By 2075
- 367,281 · +8.1%
- By 2100
- 328,211 · -3.4%
Race, ethnicity, and origin ACS 2023
- Neighborhood character
- Predominantly White (68%)
- Race & ethnicity
- White 68% Hispanic / Latino 14% Asian 11% Two or more races 6% Black 5%
- Hispanic origin (detail)
- Puerto Rican 2% Dominican 2%
- Common ancestry
- Italian 6% Scotch-Irish 3% Iranian 3%
- Foreign-born
- 22% · Canada, Jamaica, South Korea
- Languages at home
- 73% English-only · Spanish 11% Other Indo-European 7% Chinese 2%
Political lean MEDSL · Rockland
- 2024 margin
- R (+11.8) · D 44.1% · R 55.9%
- 2008→2024 swing
- -17.7pp toward R · 2008: 5.9pp · 2024: -11.8pp
- All cycles
- 2024: R+11.8 2020: D+1.7 2016: D+5.1 2012: D+6.6 2008: D+5.9
Not yet ingested
- Civics
- —
Market trends
- HPI YoY
- ▼ -402.04%
- Current HPI
- 247.615
- Rent YoY
- —
- Metro
- —
- State GDP YoY
- ▲ 2.60%
- F500 in state
- 92
Industry mix (Fortune 500 HQ in NY)
| Industry | F500 HQs | Revenue |
|---|---|---|
| Financial Services | 10 | $950B |
|
||
| Consumer Goods | 9 | $162B |
|
||
| Insurance | 4 | $225B |
|
||
| Telecommunications | 2 | $144B |
|
||
| Pharmaceuticals | 2 | $112B |
|
||
| Media / Entertainment | 2 | $69B |
|
||
Price history
+1213.2% since first listed3 events — show timeline
- 2026-05-18 Pending — OneKey® MLS as Distributed by MLS Grid
- 2026-04-27 Listed $499,000 OneKey® MLS as Distributed by MLS Grid
- 1980-03-14 Sold (Public Records) $38,000 Public Records
Property tax history
+2.3%/yrLatest (2025): $10,537 · -13.6% YoY. Source: county tax records.
Cash-flow waterfall
monthlySold comps — $/sqft
last 12 mo · ≤1 miLoading sold comps…