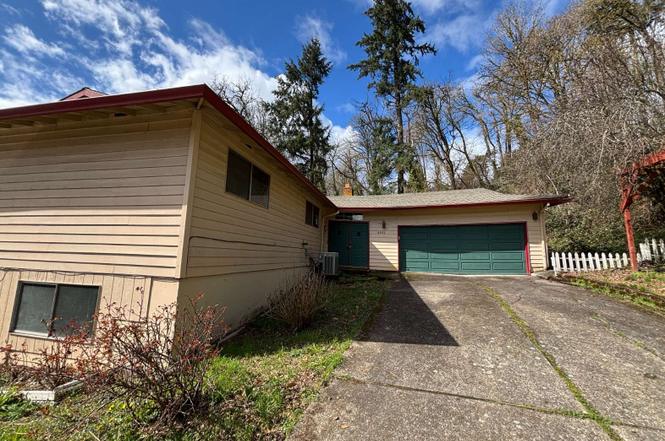
6571 Oakridge Dr · Gladstone, OR
Flood risk 1/10 · Minimal
- FEMA flood zone
- X (unshaded)
- Chance of flooding over 30 yrs
- 0.0%
- Est. flood insurance / yr
- $473 – $860
Fire risk 1/10 · Minimal
- Est. fire insurance / yr
- $498 – $926
Heat risk 3/10 · Minor
- Hot days now (above 93°F)
- 7 days/yr
- Hot days in 30 yrs
- 15 days/yr
Wind risk 1/10 · Minimal
- Chance of severe wind over 30 yrs
- —
Air-quality risk 10/10 · Severe
- Unhealthy air days now
- 18 days/yr
- Unhealthy air days in 30 yrs
- 20 days/yr
Risk factors via First Street. Map © Google.
Why this score? — see what drove the C grade
The composite is a weighted blend of 9 inputs, each scored 0–100. Each bar is that input's sub-score; the figure is the points it added to the 100-point composite (weight × sub-score).
- Cash flow +21.7/30.0
- ARV discount +7.5/15.0
- 1% rule +6.9/10.0
- DSCR +6.9/10.0
- Schools +6.4/10.0
- Livability +4.5/5.0
- Rent growth +2.7/5.0
- Condition / age +2.5/5.0
- Appreciation +0.0/10.0
$265,000
🖨 Deal sheet 📄 Offer letter ✓ Due diligence
Listing remarks
LARGE PRICE CORRECTION! Spacious daylight ranch with endless potential! Situated on a generous 8,276 sq ft lot, this 5-bedroom, 3-bathroom home offers ample space and a versatile layout. The main level features beautiful hardwood floors, a bright living room, and a functional kitchen. Step out onto the covered deck and enjoy views of the green backdrop. The lower level boasts a huge 2nd living room with a cozy fireplace, two additional bedrooms, a full bathroom, and a separate exterior entrance — ideal for a potential mother-in-law suite or rental opportunity. Tons of storage space in the oversized garage. While this home needs some TLC, including foundation work, it presents an excel
Key facts
- Covered deck
- Huge family room
- Cozy fireplace
Tags
Neighborhood map
What this means for you Summary
Snapshot
- This is a 5-bed/3.0-bath single-family listed at $265k.
Deal economics
- At list price, monthly cash flow is $407 ($5k/yr) — positive.
- The deal already cash-flows at list — no discount required.
- Meets the 1% rule at list price ($3k rent vs $265k).
- Recommended offer: $241k (9.0% below list) — sets the bar for market timing.
- Cap rate 8.1% vs local median 2.9% in Gladstone — top-decile yield for the area; either an underpriced asset or a hidden risk that comps aren't pricing in. Stress-test before assuming the spread holds.
Location & tenants
- Location reads 89/100 on livability (#7 in OR, #168 nationally) — a professional / high-income tenant draw. Strengths: amenities A+, commute A+, housing A+; Watch: cost of living D-.
- Gladstone SD 115 (suburban): math 75% / reading 75% proficiency, ranked #2 of 58 in OR (top 3%) — strong family-tenant draw, lease renewals of 3-5y typical.
- Zoned schools: John Wetten Elementary School (574 students, 42% FRL); Walter L Kraxberger Middle School (373 students, 39% FRL); Gladstone High School (594 students, 35% FRL) — zoned schools at 38% FRL track the district average.
- Market conditions: Rents flat; 43 active listings in the ZIP; solid renter incomes; 946 units permitted in Clackamas County in 2024 (188 in 5+ unit buildings).
- This rent runs 40% of the median local income ($94k/yr) — at the standard rent-burdened threshold; future hikes will face affordability resistance.
Forward outlook
- Local home prices are declining (-3.0%/yr); year-one equity from $2k of loan paydown is wiped out by about $8k of value loss. Plan a longer hold.
- Clackamas County population projected at +25% by 2050 — long-run rental-demand tailwind backs the buy-and-hold thesis.
Negotiation context
- It's been on market 115 days — a 9% lower offer ($241k) is reasonable based on typical stale-listing flexibility.
- 3 sale attempts; this cycle's ask has dropped $70k (21%) from the opening price — seller is motivated, your offer sets the floor, not the list.
Questions for the listing agent
- It's been on market 115 days. Have you received any prior offers? Is the seller open to a 9% concession, seller financing, or rate buy-down credit?
- Built in 1976 — when were the roof, HVAC, electrical panel, plumbing, and water heater last replaced?
- What does the HOA fee cover, when was the last increase, and are there any pending special assessments or reserve-fund shortfalls?
- Why hasn't it sold? Are there any deal-killer items the seller is aware of (foundation, flood, title, zoning, code violations)?
- Is there a deadline driving the sale (1031 exchange, divorce, estate, relocation)? That informs how much negotiation room exists.
- What's the average days-on-market for RENTAL listings here right now (not sales)? A rising rental-DOM trend means longer vacancies and softer asking-rent achievability than the comps imply.
- What's the recent tenant-quality profile in this submarket — average credit score on applications, eviction rate, late-payment / NSF rate, and stable-employment percentage? A property-management company in the area should have these aggregated.
- How much new for-sale + rental construction is in the pipeline within 1–3 miles? Heavy new supply typically softens prices + rents 12–24 months out; constrained supply supports both.
Investment metrics
- 1% rule
- 1.19% ✓
- Cap rate
- 8.14%
- Cash-on-cash
- 6.59%
- DSCR
- 1.29
- GRM
- 7.0
CMA / ARV
- ARV (on-the-fly)
- $646,342
- Comps found
- 12
Show comp detail 12 sales within ~0.75 mi
| Address | Dist | Beds/Ba | Sqft | Sold | Price | $/sf | Match |
|---|---|---|---|---|---|---|---|
| 5625 SE Jennings Ave | 0.41mi | 5/3.0 | 2,780 (+0%) | 3mo | $610,000 | $219 | 78 |
| 5814 SE Clayson Ave | 0.38mi | 5/3.0 | 2,641 (-5%) | 3mo | $615,000 | $233 | 72 |
| 17900 Monticello Dr | 0.32mi | 4/3.0 (-1) | 2,877 (+4%) | 3mo | $617,000 | $214 | 71 |
| 17915 Monticello Dr | 0.29mi | 4/3.0 (-1) | 2,590 (-7%) | 3mo | $580,000 | $224 | 68 |
| 6033 SE Brewster Pl | 0.58mi | 4/3.0 (-1) | 2,744 (-1%) | 1mo | $819,000 | $298 | 65 |
| 330 Patricia Dr | 0.61mi | 5/3.0 | 2,856 (+3%) | 4mo | $565,000 | $198 | 64 |
| 17485 Monticello Dr | 0.31mi | 4/3.0 (-1) | 2,570 (-7%) | 6mo | $550,000 | $214 | 64 |
| 5503 SE Colony Cir | 0.53mi | 4/3.0 (-1) | 2,611 (-6%) | 3mo | $620,000 | $237 | 58 |
| 7005 Debbie Ct | 0.43mi | 5/3.0 | 2,431 (-12%) | 4mo | $637,875 | $262 | 56 |
| 16455 Devonshire Dr | 0.45mi | 4/3.0 (-1) | 2,450 (-12%) | 5mo | $635,000 | $259 | 50 |
| 16635 SE Sunridge Ln | 0.60mi | 4/3.0 (-1) | 2,427 (-12%) | 1mo | $665,000 | $274 | 46 |
| 7693 SE Strawberry Ln | 0.73mi | 4/3.0 (-1) | 2,456 (-12%) | 4mo | $544,000 | $221 | 38 |
Match score weights: distance 35% · size 25% · config 20% · recency 20%. Top-matched comps best support the ARV.
Projected returns pro-forma
-3.0% appreciation · 0.62% rent growth · sell at horizon
- IRR
- -9.1%
- Equity multiple
- 0.67×
- Total profit
- $-24,172
- Equity at exit
- $39,512
- IRR
- -3.6%
- Equity multiple
- 0.79×
- Total profit
- $-15,652
- Equity at exit
- $22,912
Cash invested: $74,200 (down + closing). Projections, not guarantees.
Landlord ↔ Tenant lean methodology
- Overall (STATE)
- 28 Tenant-Leaning
- State Oregon
- 28 Tenant-Leaning · D+6
- County
- — inherits STATE
- City
- — inherits STATE
ZIP-level market 97027
- Rents YoY
- 0.6%
- Active inventory
- 43
- Price-to-rent
- 7.0×
Monthly cashflow live
- Estimated rent
- $3,148 medium interval (Pro) →
- Mortgage (P&I)
- −$1,390
- Tax from tax record
- −$530 /mo · $6,356/yr
- Insurance
- −$110
- HOA
- −$50
- Vacancy / Maint / Mgmt
- −$661
- Net cashflow
- $407
Break-even live
UW: 25.0% down · 7.5% · 30yr · 1.5% tax · 5.0% vac · 8.0% maint · 8.0% mgmt
Financing live
Cash to close
- Down payment
- $66,250
- Closing costs
- $7,950
- Reserves months
- —
- Total cash needed
- —
Loan-product check · same deal, 3 products live
Conventional
25% down · 7.5% · 30yr
- Down + closing
- —
- Monthly P&I
- —
- Monthly cashflow
- —
- DSCR
- —
- Eligible?
- —
Personal DTI + credit; lowest rate.
DSCR
20% down · 8.5% · 30yr
- Down + closing
- —
- Monthly P&I
- —
- Monthly cashflow
- —
- DSCR
- —
- Eligible?
- —
No personal income docs; deal must DSCR.
Hard money
10% down · 12.0% · 12mo
- Down + closing
- —
- Monthly P&I
- —
- Monthly cashflow
- —
- DSCR
- —
- Eligible?
- —
Short-term bridge; refi at stabilization.
HOA detail
- Monthly dues
- $50 · $600/yr
Listing history 7 events
-
2026-04-20status Pending
-
2026-04-07status Active
-
2025-11-06price $314,900
-
2025-10-02status Active
-
2025-09-25status Pending
-
2025-09-22price $327,000
-
2025-08-22$334,900 Active
ⓘ Source: listings_history table (triggers on properties + properties_extension) + one-shot
backfill from property_details.listing_events for pre-trigger history.
Tax reassessment forecast OR · Resets to sale price
- Current annual tax
- $6,356 · $530/mo
- Projected year-2 tax
- $6,356 · $530/mo
- Expected delta
- $0/yr ($0/mo · 0.0%)
ⓘ Screening estimate from a state-policy table — verify with the county assessor before closing.
Climate risk First Street
- Flood 1/10 Low FEMA zone X (unshaded) · 0% chance over 30 yrs
- Wildfire 1/10 Low
- Heat 3/10 Moderate 7 d/yr ≥93°F today · 15 d/yr by 30 yrs out
- Wind 1/10 Low
- Air quality 10/10 Extreme 18 unhealthy d/yr today · 20 by 30 yrs out
Nearby sold comps map
Loading sold comps map…
Walkable amenities ~0.75 mi
Loading nearby amenities…
Taxation est. · year 1
- Rental income
- $37,776
- − Mortgage interest
- −$14,844
- − Property taxes
- −$6,356
- − Insurance
- −$1,325
- − Repairs & maintenance
- −$3,022
- − Management
- −$3,022
- − HOA
- −$600
- − Depreciation
- −$7,709
- Taxable income
- $898
- Est. tax owed @ 24.0%
- −$216
- After-tax cash flow
- $4,671/yr
For passive investors: Depreciation is non-cash, so a rental often shows a tax loss while cash-flowing — sheltering income. Rental losses are passive: they offset passive income freely, and up to $25,000/yr can offset ordinary (W-2) income if you actively participate and your MAGI is under $100k (phasing out to $0 by $150k); unused losses carry forward. On sale, claimed depreciation is recaptured at up to 25%, and gains may owe capital-gains tax (a 1031 exchange can defer both). Figures are a year-1 estimate at your 24.0% rate — not tax advice; consult a CPA.
Schools (NCES district)
- District
- Gladstone SD 115
- NCES district ID
- 4105610
- Math proficiency
- 75% ▲ 40.00%
- Reading proficiency
- 75% ▲ 21.00%
- Median HH income
- $53,736
- Composite
- 63.88/100
- National rank
- #589
- State rank
- #2 of 58 in OR
Livability — Gladstone
- Score
- 89/100
- State rank
- #7
- US rank
- #168
Category grades
Schools grade is shown separately in the Schools card above.
Census & demographics
- Census place
- Gladstone, OR
- County
- Clackamas County · 361,406 people
- City population
- 12,347
- Metro
- Portland-Vancouver-Hillsboro, OR-WA
- Population (ZIP)
- 12,347
- Household income
- $94,375
- Rent vs Own
- Severe rent burden
- 494.0
Population outlook (Clackamas County) Hauer SSP2
- Today (2025)
- 458,456 people
- By 2030
- 485,185 · +5.8%
- By 2040
- 532,932 · +16.2%
- By 2050
- 574,445 · +25.3%
- By 2075
- 665,497 · +45.2%
- By 2100
- 697,488 · +52.1%
Race, ethnicity, and origin ACS 2023
- Neighborhood character
- Predominantly White (78%)
- Race & ethnicity
- White 78% Two or more races 13% Hispanic / Latino 9% Black 2% Asian 2% Native American 1%
- Hispanic origin (detail)
- Mexican 7%
- Common ancestry
- Italian 4% Lithuanian 3% Portuguese 2%
- Foreign-born
- 6% · Canada, South Korea
- Languages at home
- 94% English-only · Spanish 5% Tagalog/Filipino 1%
Political lean MEDSL · Clackamas
- 2024 margin
- Lean D (+9.7) · D 53.4% · R 43.6% · Other 3.0%
- 2008→2024 swing
- -0.6pp no change · 2008: 10.4pp · 2024: 9.7pp
- All cycles
- 2024: D+9.7 2020: D+11.1 2016: D+6.1 2012: D+3.5 2008: D+10.4
Not yet ingested
- Civics
- —
Market trends
- HPI YoY
- ▼ -332.75%
- Current HPI
- 313.7905
- Rent YoY
- ▲ 0.62%
- Metro
- Portland-Vancouver-Hillsboro, OR-WA
- State GDP YoY
- ▲ 2.05%
- F500 in state
- 2
Industry mix (Fortune 500 HQ in OR)
| Industry | F500 HQs | Revenue |
|---|---|---|
| Consumer Goods | 1 | $51B |
|
||
Price history
-6.0% since first listed7 events — show timeline
- 2026-04-20 Pending — RMLS
- 2026-04-07 Relisted — RMLS
- 2025-11-06 Price Changed $314,900 RMLS
- 2025-10-02 Relisted — RMLS
- 2025-09-25 Pending — RMLS
- 2025-09-22 Price Changed $327,000 RMLS
- 2025-08-22 Listed $334,900 RMLS
Property tax history
+2.6%/yrLatest (2025): $6,356 · +2.9% YoY. Source: county tax records.
Cash-flow waterfall
monthlySold comps — $/sqft
last 12 mo · ≤1 miLoading sold comps…