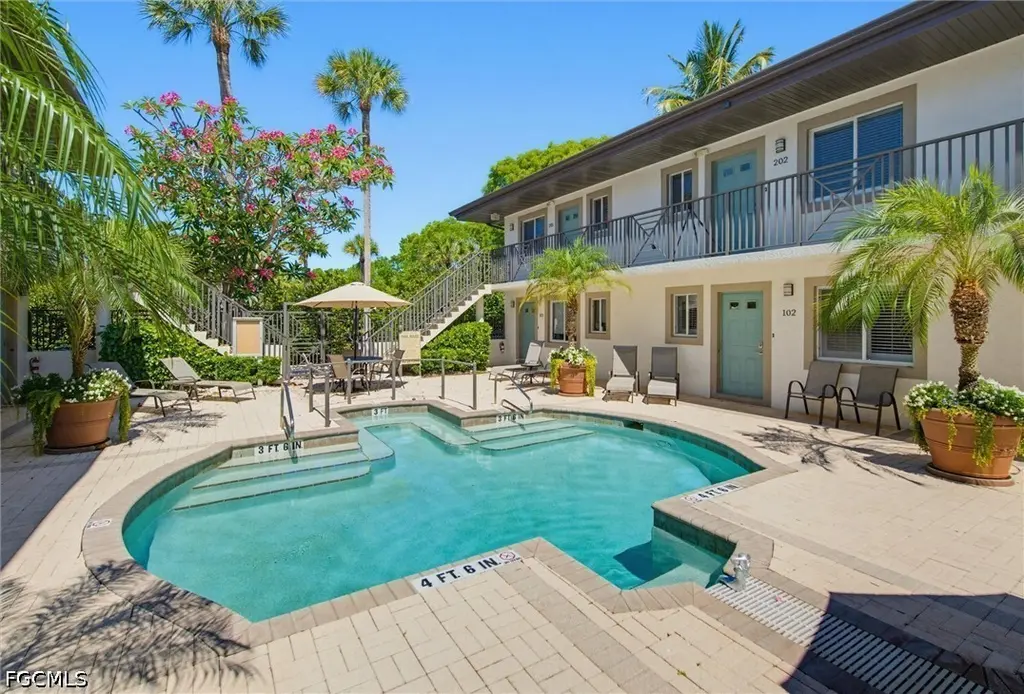
480 5th St S #202 · Naples, FL
Flood risk 8/10 · Major
- FEMA flood zone
- X (shaded)
- Chance of flooding over 30 yrs
- 0.97%
- Est. flood insurance / yr
- $507 – $1,088
Fire risk 2/10 · Minimal
- Est. fire insurance / yr
- $947 – $1,759
Heat risk 10/10 · Severe
- Hot days now (above 107°F)
- 7 days/yr
- Hot days in 30 yrs
- 27 days/yr
Wind risk 10/10 · Severe
- Chance of severe wind over 30 yrs
- 99.0%
Air-quality risk 3/10 · Minor
- Unhealthy air days now
- 3 days/yr
- Unhealthy air days in 30 yrs
- 3 days/yr
Risk factors via First Street. Map © Google.
Why this score? — see what drove the D grade
The composite is a weighted blend of 9 inputs, each scored 0–100. Each bar is that input's sub-score; the figure is the points it added to the 100-point composite (weight × sub-score).
- ARV discount +7.5/15.0
- Cash flow +7.1/30.0
- Appreciation +7.0/10.0
- Schools +5.0/10.0
- Rent growth +4.7/5.0
- Livability +4.0/5.0
- 1% rule +2.7/10.0
- Condition / age +2.5/5.0
- DSCR +1.3/10.0
$625,000
🖨 Deal sheet 📄 Offer letter ✓ Due diligence
Listing remarks
Location, location, location in the heart of Olde Naples! Welcome to Kensington Gardens, a charming vacation rental community just one block from world-famous Fifth Avenue South and only a short stroll to the white sandy beaches of the Gulf of Mexico. This beautifully updated 1-bedroom, 1-bath condominium offers the perfect Naples retreat with a bright coastal feel, tasteful furnishings, ceramic tile throughout, and in-residence laundry for added convenience. Situated in one of Naples’ most walkable and desirable downtown locations, guests can enjoy easy access to upscale dining, boutique shopping, art galleries, live entertainment, cafés, and local favorites throughout Fifth A
Key facts
- In-residence laundry
- White sandy beaches
- Boutique shopping
Tags
Property features AI
Finance
- Financial info: Pets allowed conditionally (call), maximum 1 pet up to 25 lbs; max height ~17 inches
- HOA & community: HOA fee payable quarterly; HOA covers association management, irrigation water, legal/accounting, pest control, recreation facilities, reserve fund, sewer, trash and water; Community pool; Association management onsite; Condo-hotel community near hotel/motel; 12 units in the community
Exterior
- Parking: Assigned parking (one space)
- Utilities: Public water; Public sewer; Cable available; High-speed internet available; Underground utilities
- Home design: Condo unit; Entry level: 2; Faces south; Resale property
- Construction: Block, concrete and stucco construction; Built-up, flat and metal roofing
- Exterior features: Courtyard; Fenced yard; Patio; Corner lot; Paved road access; North exposures
Interior
- Kitchen: Dishwasher; Microwave; Range; Refrigerator
- Flooring: Tile
- Bathrooms: 1 full bathroom
- Heating & cooling: Central heating (electric); Central air conditioning (electric)
- Interior features: Sliding windows; Breakfast bar; Tub with shower; Split bedrooms; Furnished
- Laundry & utility: Washer hookup; Dryer hookup; Washer; Dryer
Neighborhood map
What this means for you Summary
Snapshot
- This is a 1-bed/1.0-bath condo listed at $625k.
Deal economics
- At list price, monthly cash flow is $-966 ($-12k/yr) — negative.
- To cash-flow at today's rent, offer at most $454k (27.3% below list).
- To meet the 1% rule (rent ≥ 1% of price), the offer needs to be $482k (22.8% below list).
- Recommended offer: $454k (27.3% below list) — sets the bar for cash-flow.
Location & tenants
- Location reads 80/100 on livability (#126 in FL, #1,903 nationally) — a professional / high-income tenant draw. Strengths: crime A+, amenities A+, employment A+; Watch: commute D+, cost of living F.
- Collier (suburban): math 60% / reading 56% proficiency, ranked #16 of 73 in FL (top 22%) — acceptable for families but not a draw, mixed tenant base, ~2y average lease.
- Market conditions: Rents rising fast (+8.8%/yr); 614 active listings in the ZIP; 22 comparable units currently listed for rent nearby; rentals at typical pace (median 23d on market — plan ~3-4 weeks tenant-placement turnaround); high-income renter base; 3,520 units permitted in Collier County in 2024 (959 in 5+ unit buildings).
- This rent runs 44% of the median local income ($131k/yr) — at the standard rent-burdened threshold; future hikes will face affordability resistance.
Forward outlook
- In year one you build about $30k of equity ($4k loan paydown + $26k appreciation (4.1% local appreciation)).
- Collier County population projected at +30% by 2050 — long-run rental-demand tailwind backs the buy-and-hold thesis.
- By year 2, paydown + projected appreciation supports a ~$48k cash-out refi (75% LTV) — recoverable capital for the next deal without selling this one.
Negotiation context
- It's been on market 33 days — a 3% lower offer ($606k) is reasonable based on typical stale-listing flexibility.
- 6 sale attempts since 2y ago; this cycle's ask is 10317% above the opening price — seller raised mid-cycle; expect resistance to lowballs.
- Current owner paid $300k; list at $625k implies a 108% gain — meaningful room to come down on a strong offer.
Risks & watch-outs
- Watch-outs: flood insurance adds $66/mo.
- Climate carrying-cost: severe flood risk; severe wind risk, 99% chance of damaging wind over 30y; extreme-heat days projected 7→27/yr by 2055 (HVAC capex compounding) — expect insurance premiums to compound above CPI over the hold.
Questions for the listing agent
- What do current leases actually rent for vs. the listed asking? Can we see a recent rent roll and the last 12 months of T-12 income?
- It's been on market 33 days. Have you received any prior offers? Is the seller open to a 27% concession, seller financing, or rate buy-down credit?
- Built in 1965 — when were the roof, HVAC, electrical panel, plumbing, and water heater last replaced?
- What's the actual annual flood-insurance premium (NFIP or private), and is the property in a SFHA with mandatory coverage?
- What does the HOA fee cover, when was the last increase, and are there any pending special assessments or reserve-fund shortfalls?
- Any open or pending special assessments — roof, HVAC, plumbing, elevator, façade? What's the per-unit balance and payoff schedule, and is the seller paying it off at close or rolling it to the buyer?
- Is there a deadline driving the sale (1031 exchange, divorce, estate, relocation)? That informs how much negotiation room exists.
- Schools are B-rated — typically a magnet for longer-tenancy family renters. What's the average tenant stay here, and is there a school-zone premium baked into asking?
- The area grade is low — what's the realistic commute time and amenity access for the typical tenant pool here? Any planned neighborhood developments (good or bad) we should know about?
- What's the average days-on-market for RENTAL listings here right now (not sales)? A rising rental-DOM trend means longer vacancies and softer asking-rent achievability than the comps imply.
- What's the recent tenant-quality profile in this submarket — average credit score on applications, eviction rate, late-payment / NSF rate, and stable-employment percentage? A property-management company in the area should have these aggregated.
- How much new apartment / multifamily construction is in the pipeline within 1–3 miles? Heavy new supply (>2% of stock underway) typically softens rents 12–24 months out; light construction supports rent growth.
Investment metrics
- 1% rule
- 0.77% ✗
- Cap rate
- 4.57%
- Cash-on-cash
- -6.17%
- DSCR
- 0.73
- GRM
- 10.8
CMA / ARV
No comps found within radius.
Projected returns pro-forma
4.08% appreciation · 8.0% rent growth · sell at horizon
- IRR
- 7.0%
- Equity multiple
- 1.44×
- Total profit
- $76,192
- Equity at exit
- $319,939
- IRR
- 11.5%
- Equity multiple
- 3.07×
- Total profit
- $362,351
- Equity at exit
- $525,738
Cash invested: $175,000 (down + closing). Projections, not guarantees.
Landlord ↔ Tenant lean methodology
- Overall (STATE)
- 87 Strongly Landlord-Friendly
- State Florida
- 87 Strongly Landlord-Friendly · R+3
- County
- — inherits STATE
- City
- — inherits STATE
ZIP-level market 34102
- Home prices YoY
- 1.3%
- Rents YoY
- 8.8%
- Active inventory
- 614
- Price-to-rent
- 10.8×
Monthly cashflow live
- Estimated rent
- $4,822 high interval (Pro) →
- Mortgage (P&I)
- −$3,278
- Tax from tax record
- −$338 /mo · $4,051/yr
- Insurance
- −$260
- Flood insurance flood zone
- −$66 /mo · $798/yr
- HOA
- −$833
- Vacancy / Maint / Mgmt
- −$1,013
- Net cashflow
- $-966
Break-even live
UW: 25.0% down · 7.5% · 30yr · 1.5% tax · 5.0% vac · 8.0% maint · 8.0% mgmt
Financing live
Cash to close
- Down payment
- $156,250
- Closing costs
- $18,750
- Reserves months
- —
- Total cash needed
- —
Loan-product check · same deal, 3 products live
Conventional
25% down · 7.5% · 30yr
- Down + closing
- —
- Monthly P&I
- —
- Monthly cashflow
- —
- DSCR
- —
- Eligible?
- —
Personal DTI + credit; lowest rate.
DSCR
20% down · 8.5% · 30yr
- Down + closing
- —
- Monthly P&I
- —
- Monthly cashflow
- —
- DSCR
- —
- Eligible?
- —
No personal income docs; deal must DSCR.
Hard money
10% down · 12.0% · 12mo
- Down + closing
- —
- Monthly P&I
- —
- Monthly cashflow
- —
- DSCR
- —
- Eligible?
- —
Short-term bridge; refi at stabilization.
Rent comps 22 comps
| Address | Beds | Baths | Sqft | Rent | $/sqft | DOM | Units | Dist |
|---|---|---|---|---|---|---|---|---|
| 480 5th St S #102 Naples, FL | 1.0 | 1.0 | 600 | $6,500 | $10.83 | 23d | 1 | 0.02mi |
| 540 4th Ave S #13 Naples, FL | 1.0 | 1.0 | 580 | $5,000 | $8.62 | 23d | 1 | 0.07mi |
| 175 5th Ave S Naples, FL | 2.0 | 2.0 | 732 | $14,000 | $19.13 | 23d | 2 | 0.24mi |
| 666 3rd St S Naples, FL | 1.0–2.0 | 1.0–2.0 | 932 | $2,500 | $2.68 | 13d | 2 | 0.25mi |
| 655 8th Ave S Unit 1504166P Naples, FL | 1.0 | 1.0 | 505 | $5,346 | $10.59 | 13d | 1 | 0.31mi |
| 291 8th Ave S Unit 291A Naples, FL | 1.0 | 1.0 | 550 | $3,900 | $7.09 | 23d | 1 | 0.32mi |
| 101 8th St S Naples, FL | 1.0 | 1.0–2.0 | 940 | $12,600 | $13.40 | 13d | 4 | 0.39mi |
| 101 8th St S Naples, FL | 1.0 | 1.0–2.0 | 940 | $12,600 | $13.40 | 23d | 4 | 0.39mi |
| 940 3rd St S Naples, FL | 1.0–2.0 | 1.0–2.0 | 870 | $2,800 | $3.22 | 23d | 2 | 0.41mi |
| 960 7th St S #103 Naples, FL | 1.0 | 1.0 | 534 | $5,000 | $9.36 | 23d | 1 | 0.46mi |
| 950 7th Ave S #23 Naples, FL | 1.0 | 1.0 | 631 | $3,250 | $5.15 | 13d | 1 | 0.49mi |
| 980 7th Ave S Naples, FL | 1.0 | 1.0 | 540 | $7,500 | $13.89 | 23d | 2 | 0.51mi |
| 473 12th Ave S Naples, FL | 1.0–2.0 | 1.0–2.0 | 700 | $3,000 | $4.29 | 23d | 2 | 0.65mi |
| 1295 Gulf Shore Blvd S #218 Naples, FL | 2.0 | 2.0 | 662 | $10,479 | $15.83 | 23d | 1 | 0.78mi |
| 803 River Point Dr Unit 201B Naples, FL | 1.0 | 1.0 | 715 | $2,300 | $3.22 | 23d | 1 | 0.81mi |
| 1360 Chesapeake Ave Unit 1372 Naples, FL | 1.0 | 1.0 | 600 | $1,850 | $3.08 | 23d | 1 | 1.13mi |
| 1950 Mayfair ST Unit 716 Naples, FL | 1.0 | 1.0 | 710 | $3,330 | $4.69 | 13d | 1 | 1.31mi |
| 1950 Mayfair ST Unit 921 Naples, FL | 1.0 | 1.0 | 710 | $3,420 | $4.82 | 13d | 1 | 1.31mi |
| 1950 Mayfair ST Unit 1021 Naples, FL | 1.0 | 1.0 | 710 | $3,520 | $4.96 | 13d | 1 | 1.31mi |
| 1950 Mayfair ST Unit 802 Naples, FL | 1.0 | 1.0 | 710 | $3,355 | $4.73 | 13d | 1 | 1.31mi |
| 1950 Mayfair ST Unit 817 Naples, FL | 1.0 | 1.0 | 710 | $3,295 | $4.64 | 13d | 1 | 1.31mi |
| 1950 Mayfair St Naples, FL | 3.0 | 1.0–3.5 | 1514 | $5,505 | $3.63 | 13d | 109 | 1.34mi |
HOA detail condo
- Monthly dues
- $833 · $9,996/yr
- Assessments
- None detected in remarks — confirm with the listing agent.
Listing history 29 events
-
2026-06-18days on market $625,000 Active 33 DOM
-
2026-06-17days on market $625,000 Active 32 DOM
-
2026-06-16days on market $625,000 Active 31 DOM
-
2026-06-15days on market $625,000 Active 30 DOM
-
2026-06-14days on market $625,000 Active 28 DOM
-
2026-06-10days on market $625,000 Active 25 DOM
-
2026-06-09days on market $625,000 Active 24 DOM
-
2026-06-08days on market $625,000 Active 23 DOM
-
2026-06-07days on market $625,000 Active 22 DOM
-
2026-06-03days on market $625,000 Active 18 DOM
-
2026-06-02days on market $625,000 Active 17 DOM
-
2026-06-01days on market $625,000 Active 16 DOM
-
2026-05-31days on market $625,000 Active 15 DOM
-
2026-05-30days on market $625,000 Active 14 DOM
-
2026-05-23$6,000
-
2026-05-22historical $6,000
-
2026-05-16$625,000 Active
-
2026-03-03$6,000
-
2026-03-03historical $5,500
-
2025-10-28$5,500
-
2025-10-24historical $4,900
-
2025-10-09price $4,900
-
2025-05-03price $5,500
-
2024-11-22$6,000
-
2024-07-09historical $6,000
-
2024-06-12price $6,000
-
2024-05-23$5,900
-
2008-03-10soldstatus $300,000
-
2004-07-01soldstatus $275,000
ⓘ Source: listings_history table (triggers on properties + properties_extension) + one-shot
backfill from property_details.listing_events for pre-trigger history.
Tax reassessment forecast FL · Resets to sale price
- Current annual tax
- $4,051 · $338/mo
- Projected year-2 tax
- $5,188 · $432/mo
- Expected delta
- +$1,136/yr (+$95/mo · 28.0%)
ⓘ Screening estimate from a state-policy table — verify with the county assessor before closing.
Climate risk First Street
- Flood 8/10 Severe FEMA zone X (shaded) · 97% chance over 30 yrs
- Wildfire 2/10 Low
- Heat 10/10 Extreme 7 d/yr ≥107°F today · 27 d/yr by 30 yrs out
- Wind 10/10 Extreme 99% chance of damaging wind over 30 yrs
- Air quality 3/10 Moderate 3 unhealthy d/yr today · 3 by 30 yrs out
Nearby sold comps map
Loading sold comps map…
Walkable amenities ~0.75 mi
Loading nearby amenities…
Taxation est. · year 1
- Rental income
- $57,863
- − Mortgage interest
- −$35,010
- − Property taxes
- −$4,051
- − Insurance
- −$3,922
- − Repairs & maintenance
- −$4,629
- − Management
- −$4,629
- − HOA
- −$9,996
- − Depreciation
- −$18,182
- Taxable loss
- −$22,557
- Est. tax savings @ 24.0%
- +$5,414
- After-tax cash flow
- $-6,176/yr
For passive investors: Depreciation is non-cash, so a rental often shows a tax loss while cash-flowing — sheltering income. Rental losses are passive: they offset passive income freely, and up to $25,000/yr can offset ordinary (W-2) income if you actively participate and your MAGI is under $100k (phasing out to $0 by $150k); unused losses carry forward. On sale, claimed depreciation is recaptured at up to 25%, and gains may owe capital-gains tax (a 1031 exchange can defer both). Figures are a year-1 estimate at your 24.0% rate — not tax advice; consult a CPA.
Schools (NCES district)
- District
- Collier
- NCES district ID
- 1200330
- Math proficiency
- 60% ▼ -4.00%
- Reading proficiency
- 56% ▼ -2.00%
- Median HH income
- $58,275
- Composite
- 50.23/100
- National rank
- #1892
- State rank
- #16 of 73 in FL
Livability — Naples
- Score
- 80/100
- State rank
- #126
- US rank
- #1903
Category grades
Schools grade is shown separately in the Schools card above.
Census & demographics
- Census place
- Naples, FL
- County
- Collier County · 396,295 people
- City population
- 344,941
- Metro
- Naples-Marco Island, FL
- Population (ZIP)
- 11,179
- Household income
- $130,929
- Rent vs Own
- Severe rent burden
- 333.0
Population outlook (Collier County) Hauer SSP2
- Today (2025)
- 420,858 people
- By 2030
- 450,054 · +6.9%
- By 2040
- 502,232 · +19.3%
- By 2050
- 544,932 · +29.5%
- By 2075
- 627,203 · +49.0%
- By 2100
- 659,015 · +56.6%
Race, ethnicity, and origin ACS 2023
- Neighborhood character
- Predominantly White (79%)
- Race & ethnicity
- White 79% Hispanic / Latino 9% Two or more races 8% Black 8% Asian 1%
- Hispanic origin (detail)
- Cuban 6%
- Common ancestry
- Hispanic 4% Lithuanian 4% Romanian 4%
- Foreign-born
- 17% · Canada, China
- Languages at home
- 87% English-only · Spanish 7% French/Haitian/Cajun 4% German/W. Germanic 1%
Political lean MEDSL · Collier
- 2024 margin
- Solid R (+33.1) · D 33.1% · R 66.2%
- 2008→2024 swing
- -10.6pp toward R · 2008: -22.5pp · 2024: -33.1pp
- All cycles
- 2024: R+33.1 2020: R+24.7 2016: R+26.0 2012: R+30.1 2008: R+22.5
Not yet ingested
- Civics
- —
Market trends
- HPI YoY
- ▲ 4.08%
- Current HPI
- 328.2755
- Rent YoY
- ▲ 8.75%
- Metro
- Naples-Marco Island, FL
- State GDP YoY
- ▲ 3.28%
- F500 in state
- 36
Industry mix (Fortune 500 HQ in FL)
| Industry | F500 HQs | Revenue |
|---|---|---|
| Industrial Technology | 2 | $29B |
|
||
| Insurance | 2 | $17B |
|
||
| Retail | 1 | $60B |
|
||
| Technology Distribution | 1 | $58B |
|
||
| Homebuilding | 1 | $35B |
|
||
| Technology Manufacturing | 1 | $35B |
|
||
Price history
-97.8% since first listed15 events — show timeline
- 2026-05-23 Listed for Rent $6,000 FGCMLS
- 2026-05-22 Rental Removed $6,000 FGCMLS
- 2026-05-16 Listed $625,000 FORTMLS
- 2026-03-03 Listed for Rent $6,000 FGCMLS
- 2026-03-03 Rental Removed $5,500 NAPLESMLS
- 2025-10-28 Listed for Rent $5,500 NAPLESMLS
- 2025-10-24 Rental Removed $4,900 NAPLESMLS
- 2025-10-09 Price Changed $4,900 NAPLESMLS
- 2025-05-03 Price Changed $5,500 NAPLESMLS
- 2024-11-22 Listed for Rent $6,000 NAPLESMLS
- 2024-07-09 Rental Removed $6,000 NAPLESMLS
- 2024-06-12 Price Changed $6,000 NAPLESMLS
- 2024-05-23 Listed for Rent $5,900 NAPLESMLS
- 2008-03-10 Sold (Public Records) $300,000 Public Records
- 2004-07-01 Sold (Public Records) $275,000 Public Records
Property tax history
+7.1%/yrLatest (2025): $4,051 · +5.6% YoY. Source: county tax records.
Cash-flow waterfall
monthlySold comps — $/sqft
last 12 mo · ≤1 miLoading sold comps…