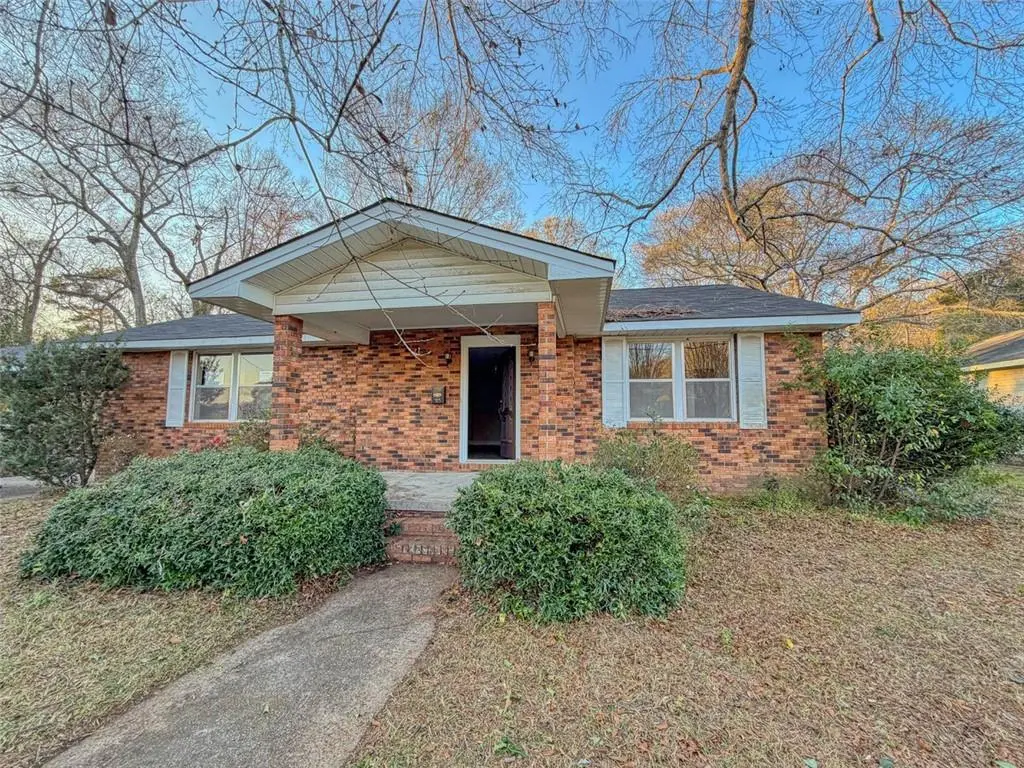
703 Varnado St · Franklinton, LA
Flood risk 5/10 · Moderate
- FEMA flood zone
- AE
- Chance of flooding over 30 yrs
- 0.24%
- Est. flood insurance / yr
- $1,737 – $8,500
Fire risk 4/10 · Minor
- Est. fire insurance / yr
- $1,269 – $2,357
Heat risk 8/10 · Major
- Hot days now (above 109°F)
- 7 days/yr
- Hot days in 30 yrs
- 21 days/yr
Wind risk 8/10 · Major
- Chance of severe wind over 30 yrs
- 99.0%
Air-quality risk 1/10 · Minimal
- Unhealthy air days now
- 0 days/yr
- Unhealthy air days in 30 yrs
- 0 days/yr
Risk factors via First Street. Map © Google.
Why this score? — see what drove the B- grade
The composite is a weighted blend of 9 inputs, each scored 0–100. Each bar is that input's sub-score; the figure is the points it added to the 100-point composite (weight × sub-score).
- Cash flow +26.1/30.0
- ARV discount +15.0/15.0
- DSCR +8.8/10.0
- 1% rule +6.0/10.0
- Livability +3.5/5.0
- Schools +2.8/10.0
- Rent growth +2.5/5.0
- Condition / age +2.5/5.0
- Appreciation +0.0/10.0
$122,900
🖨 Deal sheet (PDF) 📄 Offer letter ✓ Due diligence
Listing remarks MLS
Charming brick home on a large wooded lot with a covered carport and driveway. Features 3 bedrooms / 2 baths, large living area, walk in kitchen pantry, and a bonus room with sliding glass doors that open into the concrete patio. Great layout with ample space. Location is off of Main St in the heart of Franklinton. Great investments property or customize to make your own. Vacant and easy to show. Room sizes and square footage are estimated.
Key facts
- Wooded lot
- Driveway
- Covered carport
Tags
Neighborhood map
What this means for you Summary
Snapshot
- This is a 3-bed/2.0-bath single-family listed at $123k.
Deal economics
- At list price, monthly cash flow is $-116 ($-1k/yr) — negative.
- To cash-flow at today's rent, offer at most $102k (16.6% below list).
- Meets the 1% rule at list price ($1k rent vs $123k).
- Recommended offer: $102k (16.6% below list) — sets the bar for cash-flow.
- Cap rate 9.3% vs local median 5.5% in Franklinton — top-decile yield for the area; either an underpriced asset or a hidden risk that comps aren't pricing in. Stress-test before assuming the spread holds.
Location & tenants
- Location reads 69/100 on livability (#67 in LA) — a middle-class / working-renter tenant base. Strengths: cost of living A+, health & safety A+, crime B; Watch: amenities F, commute F, employment F.
- Washington Parish (rural): math 27% / reading 41% proficiency, ranked #38 of 98 in LA (top 39%) — families likely to look elsewhere, expect single-tenant / working-renter base with shorter leases; 77% free/reduced lunch — lower-income household profile, screen leases tightly.
- Zoned schools: Franklinton Primary School (math 22% / reading 32%, grade F, #359 of 646 statewide, top 57%, 664 students, 56% FRL); Franklinton Junior High School (math 27% / reading 46%, grade F, #82 of 218 statewide, top 38%, 362 students, 59% FRL); Franklinton High School (math 27% / reading 42%, grade F, #106 of 265 statewide, top 43%, 732 students, 56% FRL) — zoned schools average 57% FRL vs 77% district-wide (20 pts lower); this property's tenant base skews higher-income than the district average.
- Market conditions: 245 active listings in the ZIP; 2 comparable units currently listed for rent nearby; 10 units permitted in Washington Parish in 2024 (0 in 5+ unit buildings).
Forward outlook
- Local home prices are declining (-3.0%/yr); year-one equity from $850 of loan paydown is wiped out by about $4k of value loss. Plan a longer hold.
- Washington County population projected at -16% by 2050 — secular population decline; favor cash flow + early exit over multi-decade hold.
Negotiation context
- It's been on market 98 days — a 9% lower offer ($112k) is reasonable based on typical stale-listing flexibility.
- 2 sale attempts; this cycle's ask has dropped $7k (5%) from the opening price — seller is motivated, your offer sets the floor, not the list.
Risks & watch-outs
- Watch-outs: flood insurance adds $427/mo.
- Climate carrying-cost: in FEMA flood zone AE (mandatory federal flood insurance); severe wind risk, 99% chance of damaging wind over 30y; extreme-heat days projected 7→21/yr by 2055 (HVAC capex compounding) — expect insurance premiums to compound above CPI over the hold.
Questions for the listing agent
- What do current leases actually rent for vs. the listed asking? Can we see a recent rent roll and the last 12 months of T-12 income?
- It's been on market 98 days. Have you received any prior offers? Is the seller open to a 17% concession, seller financing, or rate buy-down credit?
- Built in 1966 — when were the roof, HVAC, electrical panel, plumbing, and water heater last replaced?
- What's the actual annual flood-insurance premium (NFIP or private), and is the property in a SFHA with mandatory coverage?
- Why hasn't it sold? Are there any deal-killer items the seller is aware of (foundation, flood, title, zoning, code violations)?
- Is there a deadline driving the sale (1031 exchange, divorce, estate, relocation)? That informs how much negotiation room exists.
- What's the average days-on-market for RENTAL listings here right now (not sales)? A rising rental-DOM trend means longer vacancies and softer asking-rent achievability than the comps imply.
- What's the recent tenant-quality profile in this submarket — average credit score on applications, eviction rate, late-payment / NSF rate, and stable-employment percentage? A property-management company in the area should have these aggregated.
- How much new for-sale + rental construction is in the pipeline within 1–3 miles? Heavy new supply typically softens prices + rents 12–24 months out; constrained supply supports both.
Investment metrics
- 1% rule
- 1.10% ✓
- Cap rate
- 9.33%
- Cash-on-cash
- 10.85%
- DSCR
- 1.48
- GRM
- 7.6
CMA / ARV
- ARV (median comp)
- $229,287
- List price
- $122,900
- Delta
- -46.40%
- Verdict
- UNDERPRICED
- Comps
- 20 within 1.0 mi
Show comp detail 5 sales within ~0.75 mi
| Address | Dist | Beds/Ba | Sqft | Sold | Price | $/sf | Match |
|---|---|---|---|---|---|---|---|
| 920 Varnado St | 0.29mi | 3/2.0 | 1,802 (+0%) | 7mo | $230,000 | $128 | 81 |
| 1405 Clay St | 0.64mi | 3/2.0 | 1,850 (+3%) | 9mo | $276,000 | $149 | 58 |
| 1325 14th Ave | 0.62mi | 2/1.5 (-1) | 1,797 (-0%) | 13mo | $100,000 | $56 | 53 |
| 803 10th Ave | 0.58mi | 4/2.0 (+1) | 1,835 (+2%) | 22mo | $64,900 | $35 | 47 |
| 1129 15th Ave | 0.73mi | 4/2.0 (+1) | 2,008 (+12%) | 19mo | $109,000 | $54 | 26 |
Match score weights: distance 35% · size 25% · config 20% · recency 20%. Top-matched comps best support the ARV.
Projected returns pro-forma
-3.0% appreciation · 3.0% rent growth · sell at horizon
- IRR
- -22.8%
- Equity multiple
- 0.21×
- Total profit
- $-27,050
- Equity at exit
- $18,325
- IRR
- -16.6%
- Equity multiple
- 0.07×
- Total profit
- $-32,120
- Equity at exit
- $10,626
Cash invested: $34,412 (down + closing). Projections, not guarantees.
Landlord ↔ Tenant lean methodology
- Overall (STATE)
- 90 Strongly Landlord-Friendly
- State Louisiana
- 90 Strongly Landlord-Friendly · R+12
- County
- — inherits STATE
- City
- — inherits STATE
ZIP-level market 70438
- Home prices YoY
- -14.2%
- Active inventory
- 245
- Price-to-rent
- 7.6×
Monthly cashflow live
- Estimated rent
- $1,348 medium interval (Pro) →
- Mortgage (P&I)
- −$645
- Tax from tax record
- −$58 /mo · $699/yr
- Insurance
- −$51
- Flood insurance flood zone
- −$427 /mo · $5,118/yr
- HOA
- −$0
- Vacancy / Maint / Mgmt
- −$283
- Net cashflow
- $-116
Break-even live
Sensitivity live
| Price | -10% $-46 | -5% $-81 | +0% $-116 | +5% $-150 | +10% $-185 |
|---|---|---|---|---|---|
| Rent | -10% $-222 | -5% $-169 | +0% $-116 | +5% $-62 | +10% $-9 |
| Rate | -1.0pp $-54 | -0.5pp $-84 | base $-116 | +0.5pp $-147 | +1.0pp $-180 |
UW: 25.0% down · 7.5% · 30yr · 1.5% tax · 5.0% vac · 8.0% maint · 8.0% mgmt
Financing live
Cash to close
- Down payment
- $30,725
- Closing costs
- $3,687
- Reserves months
- —
- Total cash needed
- —
Loan-product check · same deal, 3 products live
Conventional
25% down · 7.5% · 30yr
- Down + closing
- —
- Monthly P&I
- —
- Monthly cashflow
- —
- DSCR
- —
- Eligible?
- —
Personal DTI + credit; lowest rate.
DSCR
20% down · 8.5% · 30yr
- Down + closing
- —
- Monthly P&I
- —
- Monthly cashflow
- —
- DSCR
- —
- Eligible?
- —
No personal income docs; deal must DSCR.
Hard money
10% down · 12.0% · 12mo
- Down + closing
- —
- Monthly P&I
- —
- Monthly cashflow
- —
- DSCR
- —
- Eligible?
- —
Short-term bridge; refi at stabilization.
Rent comps 2 comps
| Address | Beds | Baths | Sqft | Rent | $/sqft | DOM | Units | Dist |
|---|---|---|---|---|---|---|---|---|
| 331 Main St Franklinton, LA | 3.0 | 2.0 | 1399 | $1,500 | $1.07 | 25d | 1 | 0.89mi |
| 23543 Ellis Lee Rd Franklinton, LA | 3.0 | 1.0 | 1703 | $1,150 | $0.68 | 25d | 1 | 1.41mi |
Listing history 18 events
-
2026-06-21days on market $122,900 Active 98 DOM
-
2026-06-18days on market $122,900 Active 95 DOM
-
2026-06-17days on market $122,900 Active 94 DOM
-
2026-06-16days on market $122,900 Active 93 DOM
-
2026-06-15days on market $122,900 Active 92 DOM
-
2026-06-13days on market $122,900 Active 90 DOM
-
2026-06-10days on market $122,900 Active 87 DOM
-
2026-06-09days on market $122,900 Active 86 DOM
-
2026-06-08days on market $122,900 Active 85 DOM
-
2026-06-07days on market $122,900 Active 84 DOM
-
2026-06-03days on market $122,900 Active 80 DOM
-
2026-06-02days on market $122,900 Active 79 DOM
-
2026-06-01days on market $122,900 Active 78 DOM
-
2026-05-31days on market $122,900 Active 77 DOM
-
2026-04-13price $124,900 444-char remark
Show marketing remark (444 chars)
Charming brick home on a large wooded lot with a covered carport and driveway. Features 3 bedrooms / 2 baths, large living area, walk in kitchen pantry, and a bonus room with sliding glass doors that open into the concrete patio. Great layout with ample space. Location is off of Main St in the heart of Franklinton. Great investments property or customize to make your own. Vacant and easy to show. Room sizes and square footage are estimated.
-
2026-03-12$129,900 Active 444-char remark
Show marketing remark (444 chars)
Charming brick home on a large wooded lot with a covered carport and driveway. Features 3 bedrooms / 2 baths, large living area, walk in kitchen pantry, and a bonus room with sliding glass doors that open into the concrete patio. Great layout with ample space. Location is off of Main St in the heart of Franklinton. Great investments property or customize to make your own. Vacant and easy to show. Room sizes and square footage are estimated.
ⓘ Source: listings_history table (triggers on properties + properties_extension) + one-shot
backfill from property_details.listing_events for pre-trigger history.
Tax reassessment forecast LA · Resets to sale price
- Current annual tax
- $699 · $58/mo
- Projected year-2 tax
- $699 · $58/mo
- Expected delta
- $0/yr ($0/mo · 0.0%)
ⓘ Screening estimate from a state-policy table — verify with the county assessor before closing.
Climate risk First Street
- Flood 5/10 Major FEMA zone AE · 24% chance over 30 yrs
- Wildfire 4/10 Moderate
- Heat 8/10 Severe 7 d/yr ≥109°F today · 21 d/yr by 30 yrs out
- Wind 8/10 Severe 99% chance of damaging wind over 30 yrs
- Air quality 1/10 Low 0 unhealthy d/yr today · 0 by 30 yrs out
Nearby sold comps map
Loading sold comps map…
Walkable amenities ~0.75 mi
Loading nearby amenities…
Taxation est. · year 1
- Rental income
- $16,176
- − Mortgage interest
- −$6,884
- − Property taxes
- −$699
- − Insurance
- −$5,733
- − Repairs & maintenance
- −$1,294
- − Management
- −$1,294
- − Depreciation
- −$3,575
- Taxable loss
- −$3,303
- Est. tax savings @ 24.0%
- +$793
- After-tax cash flow
- $-594/yr
For passive investors: Depreciation is non-cash, so a rental often shows a tax loss while cash-flowing — sheltering income. Rental losses are passive: they offset passive income freely, and up to $25,000/yr can offset ordinary (W-2) income if you actively participate and your MAGI is under $100k (phasing out to $0 by $150k); unused losses carry forward. On sale, claimed depreciation is recaptured at up to 25%, and gains may owe capital-gains tax (a 1031 exchange can defer both). Figures are a year-1 estimate at your 24.0% rate — not tax advice; consult a CPA.
Schools (NCES district)
- District
- Washington Parish
- NCES district ID
- 2201860
- Math proficiency
- 27% ▼ -34.00%
- Reading proficiency
- 41% ▼ -29.00%
- Median HH income
- $34,972
- Composite
- 28.03/100
- National rank
- #6844
- State rank
- #38 of 98 in LA
Livability — Franklinton
- Score
- 69/100
- State rank
- #67
- US rank
- #8352
Category grades
Schools grade is shown separately in the Schools card above.
Census & demographics
- Census place
- Franklinton, LA
- Population (ZIP)
- 19,935
Population outlook (Washington County) Hauer SSP2
- Today (2025)
- 44,642 people
- By 2030
- 43,302 · -3.0%
- By 2040
- 40,345 · -9.6%
- By 2050
- 37,434 · -16.1%
- By 2075
- 29,954 · -32.9%
- By 2100
- 21,579 · -51.7%
Race, ethnicity, and origin ACS 2023
- Neighborhood character
- Predominantly White (73%)
- Race & ethnicity
- White 73% Black 22% Two or more races 4% Hispanic / Latino 2%
- Common ancestry
- Lithuanian 9% Slovak 2% German 1%
- Foreign-born
- 0% · Canada
- Languages at home
- 98% English-only · French/Haitian/Cajun 1%
Political lean MEDSL · Washington
- 2024 margin
- Solid R (+40.3) · D 29.3% · R 69.6% · Other 1.1%
- 2008→2024 swing
- -7.6pp toward R · 2008: -32.7pp · 2024: -40.3pp
- All cycles
- 2024: R+40.3 2020: R+37.6 2016: R+36.8 2012: R+28.3 2008: R+32.7
Not yet ingested
- Civics
- —
Market trends
- HPI YoY
- ▼ -31.73%
- Current HPI
- 191.4762
- Rent YoY
- —
- Metro
- —
- State GDP YoY
- ▲ 3.29%
- F500 in state
- 10
Industry mix (Fortune 500 HQ in LA)
| Industry | F500 HQs | Revenue |
|---|---|---|
| Telecommunications | 2 | $23B |
|
||
| Utilities | 1 | $12B |
|
||
| Wholesale / Distribution | 1 | $5B |
|
||
| Advertising | 1 | $2B |
|
||
Price history
-3.8% since first listed4 events — show timeline
- 2026-04-13 Price Changed $124,900 AcadianaMLS
- 2026-04-13 Price Changed $124,900 GSREIN
- 2026-03-12 Listed $129,900 GSREIN
- 2026-03-12 Listed $129,900 AcadianaMLS
Property tax history
-1.5%/yrLatest (2025): $699 · +0.4% YoY. Source: county tax records.
Cash-flow waterfall
monthlySold comps — $/sqft
last 12 mo · ≤1 miLoading sold comps…