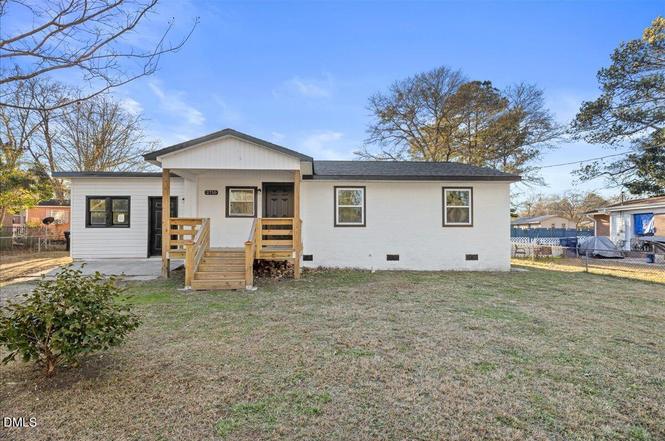
2710 Academy St · Sanford, NC
Flood risk 1/10 · Minimal
- FEMA flood zone
- X (unshaded)
- Chance of flooding over 30 yrs
- 0.0%
- Est. flood insurance / yr
- $507 – $1,088
Fire risk 4/10 · Minor
- Est. fire insurance / yr
- $906 – $1,684
Heat risk 6/10 · Moderate
- Hot days now (above 105°F)
- 7 days/yr
- Hot days in 30 yrs
- 17 days/yr
Wind risk 6/10 · Moderate
- Chance of severe wind over 30 yrs
- 59.0%
Air-quality risk 2/10 · Minimal
- Unhealthy air days now
- 1 days/yr
- Unhealthy air days in 30 yrs
- 1 days/yr
Risk factors via First Street. Map © Google.
Why this score? — see what drove the D+ grade
The composite is a weighted blend of 9 inputs, each scored 0–100. Each bar is that input's sub-score; the figure is the points it added to the 100-point composite (weight × sub-score).
- ARV discount +15.0/15.0
- Cash flow +14.4/30.0
- DSCR +4.4/10.0
- Rent growth +3.7/5.0
- Livability +3.6/5.0
- 1% rule +3.2/10.0
- Schools +3.0/10.0
- Condition / age +2.5/5.0
- Appreciation +0.0/10.0
$235,000
🖨 Deal sheet (PDF) 📄 Offer letter ✓ Due diligence
Listing remarks
Motivated Seller. Fully renovated Sanford home with new HVAC & water heater (2025). Move-in ready with charm and peace of mind. This 3-bedroom, 1-bath home is a great option for a first-time homebuyer or as a rental opportunity. Fresh finishes and a functional layout make it truly move-in ready. The fenced yard adds privacy and outdoor flexibility, while the converted garage offers additional storage or hobby space (unheated). Conveniently located near shopping centers, dining, and everyday essentials, this home combines modern updates, practicality, and location in one solid opportunity.
Key facts
- Near dining
- Fenced yard
- Converted garage
Tags
Property features AI
Finance
- Other: Zoned UN-6; Lot approximately 0.25 acre
- HOA & community: No association; Not a senior community
Exterior
- Utilities: Public water; Public sewer
- Home design: One-story house; Brick construction
- Construction: Brick exterior; Shingle roof; Raised foundation; Built as a house (single structure)
- Exterior features: Raised foundation; Public-maintained road access
Interior
- Bedrooms: 3 bedrooms, all on the main level
- Flooring: Vinyl
- Bathrooms: 1 full bathroom
- Heating & cooling: Central heating; Central air; Wall unit(s) for cooling
- Interior features: Vinyl flooring
Neighborhood map
What this means for you Summary
Snapshot
- This is a 3-bed/1.0-bath single-family listed at $235k.
Deal economics
- At list price, monthly cash flow is $45 ($545/yr) — positive.
- The deal already cash-flows at list — no discount required.
- To meet the 1% rule (rent ≥ 1% of price), the offer needs to be $194k (17.6% below list).
- Recommended offer: $194k (17.6% below list) — sets the bar for 1% rule.
- Cap rate 6.5% vs local median 3.6% in Sanford — top-decile yield for the area; either an underpriced asset or a hidden risk that comps aren't pricing in. Stress-test before assuming the spread holds.
Location & tenants
- Location reads 72/100 on livability (#92 in NC) — a middle-class / working-renter tenant base. Strengths: cost of living A+, housing A+, health & safety A+; Watch: employment D, crime D-, commute F.
- Lee County Schools (rural): math 31% / reading 39% proficiency, ranked #131 of 178 in NC (top 74%) — families likely to look elsewhere, expect single-tenant / working-renter base with shorter leases.
- Zoned schools: J Glenn Edwards Elementary (math 35% / reading 35%, grade F, #825 of 1,410 statewide, top 59%, 532 students, 76% FRL); Sanlee Middle School (math 32% / reading 43%, grade F, #256 of 475 statewide, top 55%, 809 students, 70% FRL); Southern Lee High School (math 43% / reading 46%, grade F, #352 of 535 statewide, top 68%, 1,234 students, 61% FRL).
- Market conditions: Rents rising fast (+4.9%/yr); 462 active listings in the ZIP; 1 comparable units currently listed for rent nearby; solid renter incomes; 602 units permitted in Lee County in 2024 (0 in 5+ unit buildings).
Forward outlook
- Local home prices are declining (-3.0%/yr); year-one equity from $2k of loan paydown is wiped out by about $7k of value loss. Plan a longer hold.
- Lee County population projected at +8% by 2050 — modest demand growth; plan on rents tracking national, not racing it.
Negotiation context
- It's been on market 159 days — a 12% lower offer ($207k) is reasonable based on typical stale-listing flexibility.
- 2 sale attempts; this cycle's ask has dropped $24k (9%) from the opening price — seller is motivated, your offer sets the floor, not the list.
- Current owner paid $110k; list at $235k implies a 114% gain — meaningful room to come down on a strong offer.
Risks & watch-outs
- Watch-outs: built in 1958 — expect roof / HVAC / electrical / plumbing capex.
- Climate carrying-cost: major wind risk, 59% chance of damaging wind over 30y; extreme-heat days projected 7→17/yr by 2055 (HVAC capex compounding) — expect insurance premiums to compound above CPI over the hold.
Questions for the listing agent
- It's been on market 159 days. Have you received any prior offers? Is the seller open to a 18% concession, seller financing, or rate buy-down credit?
- Built in 1958 — when were the roof, HVAC, electrical panel, plumbing, and water heater last replaced?
- Why hasn't it sold? Are there any deal-killer items the seller is aware of (foundation, flood, title, zoning, code violations)?
- Is there a deadline driving the sale (1031 exchange, divorce, estate, relocation)? That informs how much negotiation room exists.
- Schools are F-rated, which usually means shorter tenancies and higher turnover. Who's the typical renter profile here, and what's been the actual vacancy rate?
- Crime grade is D in this area — have there been break-ins, vandalism, or insurance claims at this property in the last 3 years? What carrier currently insures it and at what premium?
- The area grade is low — what's the realistic commute time and amenity access for the typical tenant pool here? Any planned neighborhood developments (good or bad) we should know about?
- What's the average days-on-market for RENTAL listings here right now (not sales)? A rising rental-DOM trend means longer vacancies and softer asking-rent achievability than the comps imply.
- What's the recent tenant-quality profile in this submarket — average credit score on applications, eviction rate, late-payment / NSF rate, and stable-employment percentage? A property-management company in the area should have these aggregated.
- How much new for-sale + rental construction is in the pipeline within 1–3 miles? Heavy new supply typically softens prices + rents 12–24 months out; constrained supply supports both.
Investment metrics
- 1% rule
- 0.82% ✗
- Cap rate
- 6.52%
- Cash-on-cash
- 0.83%
- DSCR
- 1.04
- GRM
- 10.1
CMA / ARV
- ARV (on-the-fly)
- $287,616
- Comps found
- 12
Show comp detail 12 sales within ~0.75 mi
| Address | Dist | Beds/Ba | Sqft | Sold | Price | $/sf | Match |
|---|---|---|---|---|---|---|---|
| 2712 Cameron Dr | 0.07mi | 3/2.0 | 1,498 (0%) | 10mo | $299,000 | $200 | 84 |
| 2612 Academy St | 0.09mi | 2/1.0 (-1) | 1,613 (+8%) | 11mo | $180,000 | $112 | 69 |
| 2613 Watson Ave | 0.38mi | 3/1.5 | 1,321 (-12%) | 14mo | $225,000 | $170 | 49 |
| 3154 Pasile Ct | 0.69mi | 3/2.0 | 1,498 (0%) | 19mo | $300,000 | $200 | 48 |
| 3154 Pasile Ct | 0.66mi | 4/2.0 (+1) | 1,497 (-0%) | 19mo | $300,000 | $200 | 44 |
| 129 St. James Way | 0.59mi | 3/2.0 | 1,702 (+14%) | 2mo | $325,000 | $191 | 44 |
| 3146 Pasile Ct | 0.70mi | 4/2.0 (+1) | 1,498 (0%) | 19mo | $300,000 | $200 | 42 |
| 3134 Pasile Ct | 0.71mi | 4/2.0 (+1) | 1,498 (0%) | 20mo | $309,000 | $206 | 41 |
| 214 Willow Ridge Dr | 0.52mi | 3/2.0 | 1,693 (+13%) | 16mo | $325,000 | $192 | 36 |
| 1017 Bailes Dr | 0.61mi | 3/2.0 | 1,282 (-14%) | 11mo | $225,000 | $176 | 34 |
| 3117 Pasile Ct | 0.61mi | 4/2.5 (+1) | 1,613 (+8%) | 22mo | $307,000 | $190 | 30 |
| 3117 Pasile Ct | 0.66mi | 4/2.5 (+1) | 1,613 (+8%) | 22mo | $307,000 | $190 | 27 |
Match score weights: distance 35% · size 25% · config 20% · recency 20%. Top-matched comps best support the ARV.
Projected returns pro-forma
-3.0% appreciation · 4.87% rent growth · sell at horizon
- IRR
- -13.1%
- Equity multiple
- 0.52×
- Total profit
- $-31,534
- Equity at exit
- $35,039
- IRR
- -1.7%
- Equity multiple
- 0.88×
- Total profit
- $-8,143
- Equity at exit
- $20,319
Cash invested: $65,800 (down + closing). Projections, not guarantees.
Landlord ↔ Tenant lean methodology
- Overall (STATE)
- 85 Strongly Landlord-Friendly
- State North Carolina
- 85 Strongly Landlord-Friendly · R+3
- County
- — inherits STATE
- City
- — inherits STATE
ZIP-level market 27332
- Home prices YoY
- -17.8%
- Rents YoY
- 4.9%
- Active inventory
- 462
- Price-to-rent
- 10.1×
Monthly cashflow live
- Estimated rent
- $1,936 medium interval (Pro) →
- Mortgage (P&I)
- −$1,232
- Tax from tax record
- −$154 /mo · $1,848/yr
- Insurance
- −$98
- HOA
- −$0
- Vacancy / Maint / Mgmt
- −$407
- Net cashflow
- $45
Break-even live
Sensitivity live
| Price | -10% $178 | -5% $112 | +0% $45 | +5% $-21 | +10% $-88 |
|---|---|---|---|---|---|
| Rent | -10% $-108 | -5% $-31 | +0% $45 | +5% $122 | +10% $198 |
| Rate | -1.0pp $164 | -0.5pp $105 | base $45 | +0.5pp $-15 | +1.0pp $-77 |
UW: 25.0% down · 7.5% · 30yr · 1.5% tax · 5.0% vac · 8.0% maint · 8.0% mgmt
Financing live
Cash to close
- Down payment
- $58,750
- Closing costs
- $7,050
- Reserves months
- —
- Total cash needed
- —
Loan-product check · same deal, 3 products live
Conventional
25% down · 7.5% · 30yr
- Down + closing
- —
- Monthly P&I
- —
- Monthly cashflow
- —
- DSCR
- —
- Eligible?
- —
Personal DTI + credit; lowest rate.
DSCR
20% down · 8.5% · 30yr
- Down + closing
- —
- Monthly P&I
- —
- Monthly cashflow
- —
- DSCR
- —
- Eligible?
- —
No personal income docs; deal must DSCR.
Hard money
10% down · 12.0% · 12mo
- Down + closing
- —
- Monthly P&I
- —
- Monthly cashflow
- —
- DSCR
- —
- Eligible?
- —
Short-term bridge; refi at stabilization.
Rent comps 1 comps
| Address | Beds | Baths | Sqft | Rent | $/sqft | DOM | Units | Dist |
|---|---|---|---|---|---|---|---|---|
| 358 Groveway Loop Sanford, NC | 1.0–3.0 | 1.0–2.0 | 994 | $2,099 | $2.11 | 15d | 25 | 1.45mi |
Listing history 30 events
-
2026-06-21days on market $235,000 Active 159 DOM
-
2026-06-19days on market $235,000 Active 157 DOM
-
2026-06-18days on market $235,000 Active 156 DOM
-
2026-06-17days on market $235,000 Active 155 DOM
-
2026-06-16days on market $235,000 Active 154 DOM
-
2026-06-15days on market $235,000 Active 153 DOM
-
2026-06-14days on market $235,000 Active 151 DOM
-
2026-06-13days on market $235,000 Active 150 DOM
-
2026-06-10days on market $235,000 Active 148 DOM
-
2026-06-09days on market $235,000 Active 147 DOM
-
2026-06-08days on market $235,000 Active 146 DOM
-
2026-06-07days on market $235,000 Active 145 DOM
-
2026-06-05days on market $235,000 Active 142 DOM
-
2026-06-03days on market $235,000 Active 141 DOM
-
2026-06-02days on market $235,000 Active 140 DOM
-
2026-06-01days on market $235,000 Active 139 DOM
-
2026-05-31days on market $235,000 Active 138 DOM
-
2026-05-30days on market $235,000 Active 137 DOM
-
2026-05-04status Active
-
2026-04-15historical
-
2026-04-07status Pending
-
2026-03-19price $235,000
-
2026-03-03price $237,000
-
2026-02-25price $240,000
-
2026-01-28price $249,900
-
2026-01-12price $253,500
-
2025-12-18$258,500 Active
-
2024-09-04soldstatus $110,000
-
2023-10-20soldstatus $50,000
-
1998-02-13soldstatus $40,000
ⓘ Source: listings_history table (triggers on properties + properties_extension) + one-shot
backfill from property_details.listing_events for pre-trigger history.
Tax reassessment forecast NC · Resets to sale price
- Current annual tax
- $1,848 · $154/mo
- Projected year-2 tax
- $1,927 · $161/mo
- Expected delta
- +$79/yr (+$7/mo · 4.3%)
ⓘ Screening estimate from a state-policy table — verify with the county assessor before closing.
Climate risk First Street
- Flood 1/10 Low FEMA zone X (unshaded) · 0% chance over 30 yrs
- Wildfire 4/10 Moderate
- Heat 6/10 Major 7 d/yr ≥105°F today · 17 d/yr by 30 yrs out
- Wind 6/10 Major 59% chance of damaging wind over 30 yrs
- Air quality 2/10 Low 1 unhealthy d/yr today · 1 by 30 yrs out
Nearby sold comps map
Loading sold comps map…
Walkable amenities ~0.75 mi
Loading nearby amenities…
Taxation est. · year 1
- Rental income
- $23,235
- − Mortgage interest
- −$13,164
- − Property taxes
- −$1,848
- − Insurance
- −$1,175
- − Repairs & maintenance
- −$1,859
- − Management
- −$1,859
- − Depreciation
- −$6,836
- Taxable loss
- −$3,505
- Est. tax savings @ 24.0%
- +$841
- After-tax cash flow
- $1,386/yr
For passive investors: Depreciation is non-cash, so a rental often shows a tax loss while cash-flowing — sheltering income. Rental losses are passive: they offset passive income freely, and up to $25,000/yr can offset ordinary (W-2) income if you actively participate and your MAGI is under $100k (phasing out to $0 by $150k); unused losses carry forward. On sale, claimed depreciation is recaptured at up to 25%, and gains may owe capital-gains tax (a 1031 exchange can defer both). Figures are a year-1 estimate at your 24.0% rate — not tax advice; consult a CPA.
Schools (NCES district)
- District
- Lee County Schools
- NCES district ID
- 3702560
- Math proficiency
- 31% ▼ -6.00%
- Reading proficiency
- 39% ▬ 0.00%
- Median HH income
- $45,300
- Composite
- 29.87/100
- National rank
- #6403
- State rank
- #131 of 178 in NC
Livability — Sanford
- Score
- 72/100
- State rank
- #92
- US rank
- #6134
Category grades
Schools grade is shown separately in the Schools card above.
Census & demographics
- Census place
- Sanford, NC
- County
- Lee County · 76,725 people
- City population
- 76,725
- Metro
- Sanford, NC
- Population (ZIP)
- 36,947
- Household income
- $78,447
- Rent vs Own
- Severe rent burden
- 632.0
Population outlook (Lee County) Hauer SSP2
- Today (2025)
- 63,008 people
- By 2030
- 64,443 · +2.3%
- By 2040
- 66,898 · +6.2%
- By 2050
- 68,310 · +8.4%
- By 2075
- 70,920 · +12.6%
- By 2100
- 70,402 · +11.7%
Race, ethnicity, and origin ACS 2023
- Neighborhood character
- Diverse neighborhood (Simpson 0.59)
- Race & ethnicity
- White 59% Hispanic / Latino 19% Black 16% Two or more races 11% Asian 1%
- Hispanic origin (detail)
- Mexican 9% Puerto Rican 4% Cuban 2%
- Common ancestry
- Serbian 2% Italian 2% Slovak 2%
- Foreign-born
- 8% · Canada, South Korea
- Languages at home
- 82% English-only · Spanish 15%
Political lean MEDSL · Lee
- 2024 margin
- R (+17.5) · D 40.8% · R 58.3%
- 2008→2024 swing
- -9.1pp toward R · 2008: -8.4pp · 2024: -17.5pp
- All cycles
- 2024: R+17.5 2020: R+14.9 2016: R+13.2 2012: R+10.2 2008: R+8.4
Not yet ingested
- Civics
- —
Market trends
- HPI YoY
- ▼ -54.61%
- Current HPI
- 252.2719
- Rent YoY
- ▲ 4.87%
- Metro
- Sanford, NC
- State GDP YoY
- ▲ 3.28%
- F500 in state
- 26
Industry mix (Fortune 500 HQ in NC)
| Industry | F500 HQs | Revenue |
|---|---|---|
| Financial Services | 2 | $213B |
|
||
| Retail | 2 | $95B |
|
||
| Industrial Conglomerate | 1 | $38B |
|
||
| Metals / Steel | 1 | $35B |
|
||
| Utilities | 1 | $30B |
|
||
| Industrial Machinery | 1 | $19B |
|
||
Price history
+487.5% since first listed12 events — show timeline
- 2026-05-04 Relisted — TMLS
- 2026-04-15 Listing Removed — TMLS
- 2026-04-07 Pending — TMLS
- 2026-03-19 Price Changed $235,000 TMLS
- 2026-03-03 Price Changed $237,000 TMLS
- 2026-02-25 Price Changed $240,000 TMLS
- 2026-01-28 Price Changed $249,900 TMLS
- 2026-01-12 Price Changed $253,500 TMLS
- 2025-12-18 Listed $258,500 TMLS
- 2024-09-04 Sold (Public Records) $110,000 Public Records
- 2023-10-20 Sold (Public Records) $50,000 Public Records
- 1998-02-13 Sold (Public Records) $40,000 Public Records
Property tax history
+2.6%/yrLatest (2025): $1,848 · +16.2% YoY. Source: county tax records.
Cash-flow waterfall
monthlySold comps — $/sqft
last 12 mo · ≤1 miLoading sold comps…