 Triplex
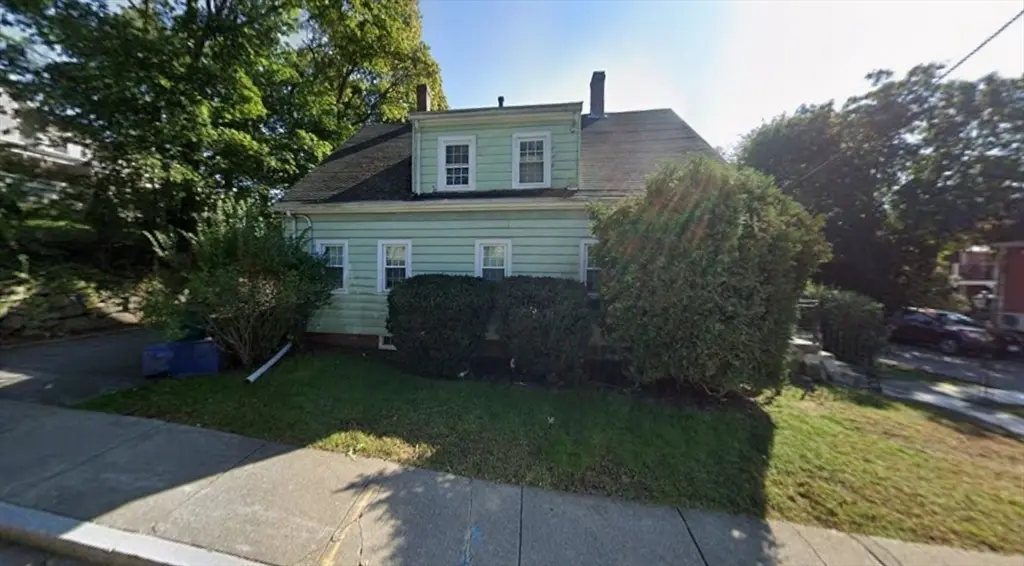
16-20 Winter St · Newton, MA
Flood risk 1/10 · Minimal
- FEMA flood zone
- X (unshaded)
- Chance of flooding over 30 yrs
- 0.0%
- Est. flood insurance / yr
- $473 – $860
Fire risk 1/10 · Minimal
- Est. fire insurance / yr
- $915 – $1,699
Heat risk 5/10 · Moderate
- Hot days now (above 97°F)
- 7 days/yr
- Hot days in 30 yrs
- 15 days/yr
Wind risk 6/10 · Moderate
- Chance of severe wind over 30 yrs
- 58.0%
Air-quality risk 2/10 · Minimal
- Unhealthy air days now
- 1 days/yr
- Unhealthy air days in 30 yrs
- 3 days/yr
Risk factors via First Street. Map © Google.
Why this score? — see what drove the B- grade
The composite is a weighted blend of 9 inputs, each scored 0–100. Each bar is that input's sub-score; the figure is the points it added to the 100-point composite (weight × sub-score).
- Cash flow +30.0/30.0
- DSCR +10.0/10.0
- 1% rule +7.8/10.0
- Schools +6.5/10.0
- Appreciation +5.2/10.0
- Livability +4.2/5.0
- Rent growth +2.5/5.0
- Condition / age +2.5/5.0
- ARV discount +0.0/15.0
$1,425,000
🖨 Deal sheet (PDF) 📄 Offer letter ✓ Due diligence
Multi-family units
County records classify this as Multi-Family (2-4 Unit). Listing-text estimate: 3 units. confirmed
Listing remarks
Rare value-add opportunity in Newton with full architectural plans and permit set in place for redevelopment. Existing two-family situated on a 11,500+ SF lot in MR1 zoning, with plans designed to expand total living area from approx. 4,600 SF to over 7,300 SF . Proposed layout includes three units with optimized floor plans and increased density potential. Ideal for investors, builders, or developers seeking a head start on design and planning. Property is being Sold "AS IS" with plans and permits. Supporting documents included. Buyer to perform due diligence regarding permitting status and approvals.
Key facts
- 11
- Three units
- 500 sf lot
Tags
Property features AI
Finance
- HOA & community: Not a senior community
Exterior
- Parking: 6 off-street parking spaces
- Utilities: Public water; Public sewer; Electric: other (see remarks)
- Home design: 2-family side-by-side configuration; 4 total stories; 4 levels listed
- Construction: Built (public records); Above-grade finished area approximately 2,208; Below-grade finished area approximately 684
- Exterior features: Public road frontage; Lot of about 0.26 acres
Interior
- Bathrooms: 2 full bathrooms; 1 half bathroom
- Interior features: 12 total rooms; Full basement
Neighborhood map
What this means for you Summary
Snapshot
- This is a 3 × 3-bed/1.2-bath units multifamily listed at $1.43M.
Deal economics
- At list price, monthly cash flow is $6k ($67k/yr) — positive. Per door: $2k/mo.
- The deal already cash-flows at list — no discount required.
- Meets the 1% rule at list price ($18k rent vs $1.43M).
- Recommended offer: $1.38M (3.0% below list) — sets the bar for market timing.
- Cap rate 11.0% vs local median 1.4% in Newton — top-decile yield for the area; either an underpriced asset or a hidden risk that comps aren't pricing in. Stress-test before assuming the spread holds.
Location & tenants
- Location reads 84/100 on livability (#17 in MA, #746 nationally) — a professional / high-income tenant draw. Strengths: schools A+, crime A+, commute A+; Watch: amenities D-, cost of living F.
- Newton (urban): math 64% / reading 73% proficiency, ranked #27 of 302 in MA (top 9%) — acceptable for families but not a draw, mixed tenant base, ~2y average lease; only 9% free/reduced lunch — higher-income household profile.
- Market conditions: 18 active listings in the ZIP; 2 comparable units currently listed for rent nearby; solid renter incomes; 3,670 units permitted in Middlesex County in 2024 (2,611 in 5+ unit buildings).
- At $18,260/mo this rent would consume 207% of the median local household income ($106k/yr) (locally 131% of renters already pay >50% of income on rent) — very limited rent-growth headroom before tenants either downsize or default.
Forward outlook
- In year one you build about $17k of equity ($10k loan paydown + $7k appreciation (0.5% local appreciation)).
- Middlesex County population projected at +20% by 2050 — long-run rental-demand tailwind backs the buy-and-hold thesis.
- At projected returns (0.5% appreciation + 3.0% rent growth), your $399k cash investment doubles in ~5 years — after that, you're playing with house money.
- By year 5, paydown + projected appreciation supports a ~$84k cash-out refi (75% LTV) — recoverable capital for the next deal without selling this one.
Negotiation context
- It's been on market 43 days — a 3% lower offer ($1.38M) is reasonable based on typical stale-listing flexibility.
Risks & watch-outs
- Watch-outs: built in 1845 — expect roof / HVAC / electrical / plumbing capex.
- Climate carrying-cost: major wind risk, 58% chance of damaging wind over 30y; extreme-heat days projected 7→15/yr by 2055 (HVAC capex compounding) — expect insurance premiums to compound above CPI over the hold.
Questions for the listing agent
- It's been on market 43 days. Have you received any prior offers? Is the seller open to a 3% concession, seller financing, or rate buy-down credit?
- Can we see the unit-by-unit rent roll, current vacancy, and any below-market leases? What's the average tenancy length?
- What capital expenditures (roof, boiler, parking lot, exteriors) have been made in the last 5 years, and what's planned in the next 2?
- Built in 1845 — when were the roof, HVAC, electrical panel, plumbing, and water heater last replaced?
- Is there a deadline driving the sale (1031 exchange, divorce, estate, relocation)? That informs how much negotiation room exists.
- Schools are A-rated — typically a magnet for longer-tenancy family renters. What's the average tenant stay here, and is there a school-zone premium baked into asking?
- What's the average days-on-market for RENTAL listings here right now (not sales)? A rising rental-DOM trend means longer vacancies and softer asking-rent achievability than the comps imply.
- What's the recent tenant-quality profile in this submarket — average credit score on applications, eviction rate, late-payment / NSF rate, and stable-employment percentage? A property-management company in the area should have these aggregated.
- How much new apartment / multifamily construction is in the pipeline within 1–3 miles? Heavy new supply (>2% of stock underway) typically softens rents 12–24 months out; light construction supports rent growth.
Investment metrics
- 1% rule
- 1.28% ✓
- Cap rate
- 10.98%
- Cash-on-cash
- 16.73%
- DSCR
- 1.74
- GRM
- 6.5
CMA / ARV
- ARV (median comp)
- $1,144,081
- List price
- $1,425,000
- Delta
- 24.55%
- Verdict
- OVERPRICED
- Comps
- 18 within 1.0 mi
Show comp detail 1 sale within ~0.75 mi
| Address | Dist | Beds/Ba | Sqft | Sold | Price | $/sf | Match |
|---|---|---|---|---|---|---|---|
| 886-888 Chestnut St | 0.32mi | 5/3.0 (-1) | 2,422 (+10%) | 12mo | $1,650,000 | $681 | 50 |
Match score weights: distance 35% · size 25% · config 20% · recency 20%. Top-matched comps best support the ARV.
Projected returns pro-forma
0.49% appreciation · 3.0% rent growth · sell at horizon
- IRR
- 17.5%
- Equity multiple
- 1.86×
- Total profit
- $345,091
- Equity at exit
- $448,691
- IRR
- 21.3%
- Equity multiple
- 3.46×
- Total profit
- $980,171
- Equity at exit
- $568,064
Cash invested: $399,000 (down + closing). Projections, not guarantees.
Landlord ↔ Tenant lean methodology
- Overall (STATE)
- 20 Strongly Tenant-Friendly
- State Massachusetts
- 20 Strongly Tenant-Friendly · D+15
- County
- — inherits STATE
- City
- — inherits STATE
ZIP-level market 02464
- Home prices YoY
- 0.2%
- Active inventory
- 18
- Price-to-rent
- 19.5×
Monthly cashflow live
- Estimated rent
- $18,260 medium interval (Pro) →
- Mortgage (P&I)
- −$7,473
- Tax from tax record
- −$796 /mo · $9,554/yr
- Insurance
- −$594
- HOA
- −$0
- Vacancy / Maint / Mgmt
- −$3,835
- Net cashflow
- $5,563
Break-even live
Sensitivity live
| Price | -10% $6,369 | -5% $5,966 | +0% $5,563 | +5% $5,159 | +10% $4,756 |
|---|---|---|---|---|---|
| Rent | -10% $4,120 | -5% $4,841 | +0% $5,563 | +5% $6,284 | +10% $7,005 |
| Rate | -1.0pp $6,280 | -0.5pp $5,925 | base $5,563 | +0.5pp $5,193 | +1.0pp $4,818 |
3-unit breakdown (identical units grouped — click to expand)
| Units | Beds | Baths | Est. rent |
|---|---|---|---|
| 3× units | 3 | 1.2 | $18,261 |
| #1 | 3 | 1.2 | $6,087 |
| #2 | 3 | 1.2 | $6,087 |
| #3 | 3 | 1.2 | $6,087 |
| Total (3 units) | $18,260 | ||
UW: 25.0% down · 7.5% · 30yr · 1.5% tax · 5.0% vac · 8.0% maint · 8.0% mgmt
Financing live
Cash to close
- Down payment
- $356,250
- Closing costs
- $42,750
- Reserves months
- —
- Total cash needed
- —
Loan-product check · same deal, 3 products live
Conventional
25% down · 7.5% · 30yr
- Down + closing
- —
- Monthly P&I
- —
- Monthly cashflow
- —
- DSCR
- —
- Eligible?
- —
Personal DTI + credit; lowest rate.
DSCR
20% down · 8.5% · 30yr
- Down + closing
- —
- Monthly P&I
- —
- Monthly cashflow
- —
- DSCR
- —
- Eligible?
- —
No personal income docs; deal must DSCR.
Hard money
10% down · 12.0% · 12mo
- Down + closing
- —
- Monthly P&I
- —
- Monthly cashflow
- —
- DSCR
- —
- Eligible?
- —
Short-term bridge; refi at stabilization.
Rent comps 2 comps
| Address | Beds | Baths | Sqft | Rent | $/sqft | DOM | Units | Dist |
|---|---|---|---|---|---|---|---|---|
| 8 Kenneth St Newton Highlands, MA | 5.0 | 3.0 | 2850 | $7,000 | $2.46 | 44d | 1 | 0.69mi |
| 3 Forest St #3 Newton, MA | 5.0 | 4.0 | 2556 | $6,800 | $2.66 | 5d | 1 | 1.07mi |
Listing history 15 events
-
2026-06-18days on market $1,425,000 Active 43 DOM
-
2026-06-17days on market $1,425,000 Active 42 DOM
-
2026-06-16days on market $1,425,000 Active 41 DOM
-
2026-06-15days on market $1,425,000 Active 40 DOM
-
2026-06-13days on market $1,425,000 Active 38 DOM
-
2026-06-13days on market $1,425,000 Active 37 DOM
-
2026-06-09days on market $1,425,000 Active 34 DOM
-
2026-06-08days on market $1,425,000 Active 33 DOM
-
2026-06-07days on market $1,425,000 Active 32 DOM
-
2026-06-04days on market $1,425,000 Active 29 DOM
-
2026-06-03days on market $1,425,000 Active 28 DOM
-
2026-06-02days on market $1,425,000 Active 27 DOM
-
2026-06-01days on market $1,425,000 Active 26 DOM
-
2026-05-31days on market $1,425,000 Active 25 DOM
-
2026-05-06$1,425,000 New 619-char remark
ⓘ Source: listings_history table (triggers on properties + properties_extension) + one-shot
backfill from property_details.listing_events for pre-trigger history.
Tax reassessment forecast MA · Partial reset (capped growth)
- Current annual tax
- $9,554 · $796/mo
- Projected year-2 tax
- $13,541 · $1,128/mo
- Expected delta
- +$3,987/yr (+$332/mo · 41.7%)
ⓘ Screening estimate from a state-policy table — verify with the county assessor before closing.
Climate risk First Street
- Flood 1/10 Low FEMA zone X (unshaded) · 0% chance over 30 yrs
- Wildfire 1/10 Low
- Heat 5/10 Major 7 d/yr ≥97°F today · 15 d/yr by 30 yrs out
- Wind 6/10 Major 58% chance of damaging wind over 30 yrs
- Air quality 2/10 Low 1 unhealthy d/yr today · 3 by 30 yrs out
Nearby sold comps map
Loading sold comps map…
Walkable amenities ~0.75 mi
Loading nearby amenities…
Taxation est. · year 1
- Rental income
- $219,120
- − Mortgage interest
- −$79,822
- − Property taxes
- −$9,554
- − Insurance
- −$7,125
- − Repairs & maintenance
- −$17,530
- − Management
- −$17,530
- − Depreciation
- −$41,455
- Taxable income
- $46,105
- Est. tax owed @ 24.0%
- −$11,065
- After-tax cash flow
- $55,686/yr
For passive investors: Depreciation is non-cash, so a rental often shows a tax loss while cash-flowing — sheltering income. Rental losses are passive: they offset passive income freely, and up to $25,000/yr can offset ordinary (W-2) income if you actively participate and your MAGI is under $100k (phasing out to $0 by $150k); unused losses carry forward. On sale, claimed depreciation is recaptured at up to 25%, and gains may owe capital-gains tax (a 1031 exchange can defer both). Figures are a year-1 estimate at your 24.0% rate — not tax advice; consult a CPA.
Schools (NCES district)
- District
- Newton
- NCES district ID
- 2508610
- Math proficiency
- 64% ▼ -10.00%
- Reading proficiency
- 73% ▼ -1.00%
- Median HH income
- $118,822
- Composite
- 64.67/100
- National rank
- #525
- State rank
- #27 of 302 in MA
Livability — Newton
- Score
- 84/100
- State rank
- #17
- US rank
- #746
Category grades
Schools grade is shown separately in the Schools card above.
Census & demographics
- Census place
- Newton, MA
- County
- Middlesex County · 1,437,704 people
- City population
- 54,110
- Metro
- Boston-Cambridge-Newton, MA-NH
- Population (ZIP)
- 3,833
- Household income
- $105,729
- Rent vs Own
- Severe rent burden
- 131.0
Population outlook (Middlesex County) Hauer SSP2
- Today (2025)
- 1,740,269 people
- By 2030
- 1,817,187 · +4.4%
- By 2040
- 1,963,195 · +12.8%
- By 2050
- 2,087,461 · +20.0%
- By 2075
- 2,344,036 · +34.7%
- By 2100
- 2,383,776 · +37.0%
Race, ethnicity, and origin ACS 2023
- Neighborhood character
- Majority White (58%)
- Race & ethnicity
- White 58% Asian 34% Two or more races 6% Hispanic / Latino 2% Black 1%
- Common ancestry
- Scotch-Irish 4% Romanian 4% Estonian 1%
- Foreign-born
- 40% · China, South Korea, Canada
- Languages at home
- 59% English-only · Chinese 14% Russian/Polish/Slavic 8% Other Indo-European 7%
Political lean MEDSL · Middlesex
- 2024 margin
- Solid D (+39.5) · D 68.5% · R 29.0% · Other 2.5%
- 2008→2024 swing
- +9.3pp toward D · 2008: 30.1pp · 2024: 39.5pp
- All cycles
- 2024: D+39.5 2020: D+45.2 2016: D+38.1 2012: D+26.9 2008: D+30.1
Not yet ingested
- Civics
- —
Market trends
- HPI YoY
- ▲ 0.49%
- Current HPI
- 263.4732
- Rent YoY
- —
- Metro
- Boston-Cambridge-Newton, MA-NH
- State GDP YoY
- ▲ 2.28%
- F500 in state
- 38
Industry mix (Fortune 500 HQ in MA)
| Industry | F500 HQs | Revenue |
|---|---|---|
| Technology | 3 | $17B |
|
||
| Insurance | 2 | $84B |
|
||
| Retail | 2 | $76B |
|
||
| Life Sciences | 1 | $43B |
|
||
| Energy Technology | 1 | $31B |
|
||
| Aerospace / Defense | 1 | $18B |
|
||
Price history
1 event — show timeline
- 2026-05-06 Listed $1,425,000 MLS PIN
Property tax history
+3.4%/yrLatest (2025): $9,554 · +3.4% YoY. Source: county tax records.
Cash-flow waterfall
monthlySold comps — $/sqft
last 12 mo · ≤1 miLoading sold comps…