 5-Plex
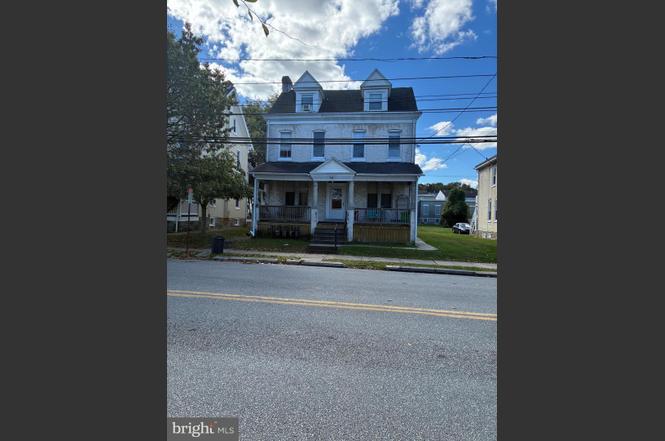
24 Philadelphia · Shillington, PA
Flood risk 1/10 · Minimal
- FEMA flood zone
- X (unshaded)
- Chance of flooding over 30 yrs
- 0.0%
- Est. flood insurance / yr
- $473 – $860
Fire risk 3/10 · Minor
- Est. fire insurance / yr
- $511 – $949
Heat risk 6/10 · Moderate
- Hot days now (above 100°F)
- 7 days/yr
- Hot days in 30 yrs
- 16 days/yr
Wind risk 4/10 · Minor
- Chance of severe wind over 30 yrs
- 14.0%
Air-quality risk 3/10 · Minor
- Unhealthy air days now
- 2 days/yr
- Unhealthy air days in 30 yrs
- 3 days/yr
Risk factors via First Street. Map © Google.
Why this score? — see what drove the B grade
The composite is a weighted blend of 9 inputs, each scored 0–100. Each bar is that input's sub-score; the figure is the points it added to the 100-point composite (weight × sub-score).
- Cash flow +30.0/30.0
- 1% rule +10.0/10.0
- DSCR +10.0/10.0
- ARV discount +7.5/15.0
- Livability +4.0/5.0
- Schools +3.6/10.0
- Rent growth +2.5/5.0
- Condition / age +2.5/5.0
- Appreciation +0.0/10.0
$499,000
🖨 Deal sheet (PDF) 📄 Offer letter ✓ Due diligence
Multi-family units
County records classify this as Multi-Family (5+ Unit). Listing-text estimate: 5 units. confirmed
5+ unit building — per-unit beds/baths from public records are typically unavailable; the breakdown below (if shown) is an estimate from the listing text.
Listing remarks
Very rare 5 unit rental property in the heart of Shillington, Current annual rents total $58,200 with several units being under market value. 4 one bedroom units and 1 two bedroom unit. Gas heat and hot water paid by owner, trash and recycling paid by tenants. This would be a great starter property for the new investor or solid addition to a seasoned investors portfolio. Property is within walking distance to all major amenities and public transportation and when a unit does become available it is unusually rented within days. Property just passed the Shillington rental codes inspection.
Key facts
- 7,840 sq ft lot
- Built 1900
- Listed 124 days
Tags
Neighborhood map
What this means for you Summary
Snapshot
- This is a 4×1bd/1.0ba + 1×2bd/1.0ba units multifamily listed at $499k.
Deal economics
- At list price, monthly cash flow is $3k ($38k/yr) — positive. Per door: $638/mo.
- The deal already cash-flows at list — no discount required.
- Meets the 1% rule at list price ($8k rent vs $499k).
- Recommended offer: $439k (12.0% below list) — sets the bar for market timing.
- Cap rate 14.0% vs local median 4.8% in Shillington — top-decile yield for the area; either an underpriced asset or a hidden risk that comps aren't pricing in. Stress-test before assuming the spread holds.
Location & tenants
- Location reads 79/100 on livability (#230 in PA, #2,007 nationally) — a middle-class / working-renter tenant base. Strengths: crime A+, cost of living A+, housing A+; Watch: amenities F, commute F.
- Governor Mifflin SD (suburban): math 31% / reading 50% proficiency, ranked #325 of 539 in PA (top 60%) — families likely to look elsewhere, expect single-tenant / working-renter base with shorter leases.
- Zoned schools: Cumru El Sch (math 42% / reading 47%, grade F, #815 of 1,518 statewide, top 56%, 406 students, 56% FRL); Governor Mifflin Ms (math 18% / reading 51%, grade F, #328 of 512 statewide, top 65%, 629 students, 54% FRL); Governor Mifflin Shs (math 50% / reading 24%, grade F, #288 of 437 statewide, top 66%, 1,480 students, 44% FRL) — zoned schools average 51% FRL vs 27% district-wide (24 pts higher); higher-poverty schools than district average — tighter screening recommended.
- Market conditions: 90 active listings in the ZIP; solid renter incomes; 258 units permitted in Berks County in 2024 (27 in 5+ unit buildings).
- At $8,116/mo this rent would consume 120% of the median local household income ($81k/yr) (locally 469% of renters already pay >50% of income on rent) — very limited rent-growth headroom before tenants either downsize or default.
Forward outlook
- Local home prices are declining (-3.0%/yr); year-one equity from $3k of loan paydown is wiped out by about $15k of value loss. Plan a longer hold.
- Berks County population projected at +3% by 2050 — modest demand growth; plan on rents tracking national, not racing it.
- At projected returns (-3.0% appreciation + 3.0% rent growth), your $140k cash investment doubles in ~5 years — after that, you're playing with house money.
Negotiation context
- It's been on market 124 days — a 12% lower offer ($439k) is reasonable based on typical stale-listing flexibility.
- 2 sale attempts; this cycle's ask has dropped $36k (7%) from the opening price — seller is motivated, your offer sets the floor, not the list.
Risks & watch-outs
- Watch-outs: built in 1900 — expect roof / HVAC / electrical / plumbing capex.
- Climate carrying-cost: extreme-heat days projected 7→16/yr by 2055 (HVAC capex compounding) — expect insurance premiums to compound above CPI over the hold.
Questions for the listing agent
- It's been on market 124 days. Have you received any prior offers? Is the seller open to a 12% concession, seller financing, or rate buy-down credit?
- Can we see the unit-by-unit rent roll, current vacancy, and any below-market leases? What's the average tenancy length?
- What capital expenditures (roof, boiler, parking lot, exteriors) have been made in the last 5 years, and what's planned in the next 2?
- Built in 1900 — when were the roof, HVAC, electrical panel, plumbing, and water heater last replaced?
- Why hasn't it sold? Are there any deal-killer items the seller is aware of (foundation, flood, title, zoning, code violations)?
- Is there a deadline driving the sale (1031 exchange, divorce, estate, relocation)? That informs how much negotiation room exists.
- Schools are B-rated — typically a magnet for longer-tenancy family renters. What's the average tenant stay here, and is there a school-zone premium baked into asking?
- What's the average days-on-market for RENTAL listings here right now (not sales)? A rising rental-DOM trend means longer vacancies and softer asking-rent achievability than the comps imply.
- What's the recent tenant-quality profile in this submarket — average credit score on applications, eviction rate, late-payment / NSF rate, and stable-employment percentage? A property-management company in the area should have these aggregated.
- How much new apartment / multifamily construction is in the pipeline within 1–3 miles? Heavy new supply (>2% of stock underway) typically softens rents 12–24 months out; light construction supports rent growth.
Investment metrics
- 1% rule
- 1.63% ✓
- Cap rate
- 13.96%
- Cash-on-cash
- 27.38%
- DSCR
- 2.22
- GRM
- 5.1
CMA / ARV
No comps found within radius.
Projected returns pro-forma
-3.0% appreciation · 3.0% rent growth · sell at horizon
- IRR
- 21.4%
- Equity multiple
- 1.87×
- Total profit
- $122,183
- Equity at exit
- $74,403
- IRR
- 29.5%
- Equity multiple
- 3.63×
- Total profit
- $367,800
- Equity at exit
- $43,144
Cash invested: $139,720 (down + closing). Projections, not guarantees.
Landlord ↔ Tenant lean methodology
- Overall (STATE)
- 62 Landlord-Friendly
- State Pennsylvania
- 62 Landlord-Friendly · EVEN
- County
- — inherits STATE
- City
- — inherits STATE
ZIP-level market 19607
- Home prices YoY
- -14.1%
- Active inventory
- 90
- Price-to-rent
- 26.0×
Monthly cashflow live
- Estimated rent
- $8,116 high interval (Pro) →
- Mortgage (P&I)
- −$2,617
- Tax from tax record
- −$399 /mo · $4,785/yr
- Insurance
- −$208
- HOA
- −$0
- Vacancy / Maint / Mgmt
- −$1,704
- Net cashflow
- $3,188
Break-even live
Sensitivity live
| Price | -10% $3,471 | -5% $3,329 | +0% $3,188 | +5% $3,047 | +10% $2,906 |
|---|---|---|---|---|---|
| Rent | -10% $2,547 | -5% $2,868 | +0% $3,188 | +5% $3,509 | +10% $3,829 |
| Rate | -1.0pp $3,439 | -0.5pp $3,315 | base $3,188 | +0.5pp $3,059 | +1.0pp $2,927 |
5-unit breakdown (identical units grouped — click to expand)
| Units | Beds | Baths | Est. rent |
|---|---|---|---|
| 4× units | 1 | 1 | $6,408 |
| #1 | 1 | 1 | $1,602 |
| #2 | 1 | 1 | $1,602 |
| #3 | 1 | 1 | $1,602 |
| #4 | 1 | 1 | $1,602 |
| 1× unit | 2 | 1 | $1,709 |
| Total (5 units) | $8,116 | ||
UW: 25.0% down · 7.5% · 30yr · 1.5% tax · 5.0% vac · 8.0% maint · 8.0% mgmt
Financing live
Cash to close
- Down payment
- $124,750
- Closing costs
- $14,970
- Reserves months
- —
- Total cash needed
- —
Loan-product check · same deal, 3 products live
Conventional
25% down · 7.5% · 30yr
- Down + closing
- —
- Monthly P&I
- —
- Monthly cashflow
- —
- DSCR
- —
- Eligible?
- —
Personal DTI + credit; lowest rate.
DSCR
20% down · 8.5% · 30yr
- Down + closing
- —
- Monthly P&I
- —
- Monthly cashflow
- —
- DSCR
- —
- Eligible?
- —
No personal income docs; deal must DSCR.
Hard money
10% down · 12.0% · 12mo
- Down + closing
- —
- Monthly P&I
- —
- Monthly cashflow
- —
- DSCR
- —
- Eligible?
- —
Short-term bridge; refi at stabilization.
Listing history 8 events
-
2026-03-17status Pending
-
2026-03-05historical
-
2025-11-20price $499,000
-
2025-11-20status Active
-
2025-11-05status Pending
-
2025-11-02historical
-
2025-10-29price $510,000
-
2025-10-14$535,000 Active
ⓘ Source: listings_history table (triggers on properties + properties_extension) + one-shot
backfill from property_details.listing_events for pre-trigger history.
Tax reassessment forecast PA · Partial reset (capped growth)
- Current annual tax
- $4,785 · $399/mo
- Projected year-2 tax
- $6,334 · $528/mo
- Expected delta
- +$1,550/yr (+$129/mo · 32.4%)
ⓘ Screening estimate from a state-policy table — verify with the county assessor before closing.
Climate risk First Street
- Flood 1/10 Low FEMA zone X (unshaded) · 0% chance over 30 yrs
- Wildfire 3/10 Moderate
- Heat 6/10 Major 7 d/yr ≥100°F today · 16 d/yr by 30 yrs out
- Wind 4/10 Moderate 14% chance of damaging wind over 30 yrs
- Air quality 3/10 Moderate 2 unhealthy d/yr today · 3 by 30 yrs out
Nearby sold comps map
Loading sold comps map…
Walkable amenities ~0.75 mi
Loading nearby amenities…
Taxation est. · year 1
- Rental income
- $97,392
- − Mortgage interest
- −$27,952
- − Property taxes
- −$4,785
- − Insurance
- −$2,495
- − Repairs & maintenance
- −$7,791
- − Management
- −$7,791
- − Depreciation
- −$14,516
- Taxable income
- $32,062
- Est. tax owed @ 24.0%
- −$7,695
- After-tax cash flow
- $30,564/yr
For passive investors: Depreciation is non-cash, so a rental often shows a tax loss while cash-flowing — sheltering income. Rental losses are passive: they offset passive income freely, and up to $25,000/yr can offset ordinary (W-2) income if you actively participate and your MAGI is under $100k (phasing out to $0 by $150k); unused losses carry forward. On sale, claimed depreciation is recaptured at up to 25%, and gains may owe capital-gains tax (a 1031 exchange can defer both). Figures are a year-1 estimate at your 24.0% rate — not tax advice; consult a CPA.
Schools (NCES district)
- District
- Governor Mifflin SD
- NCES district ID
- 4210860
- Math proficiency
- 31% ▼ -12.00%
- Reading proficiency
- 50% ▼ -11.00%
- Median HH income
- $60,881
- Composite
- 35.88/100
- National rank
- #4815
- State rank
- #325 of 539 in PA
Livability — Shillington
- Score
- 79/100
- State rank
- #230
- US rank
- #2007
Category grades
Schools grade is shown separately in the Schools card above.
Census & demographics
- Census place
- Shillington, PA
- County
- Berks County · 195,629 people
- Metro
- Reading, PA
- Population (ZIP)
- 24,045
- Household income
- $81,346
- Rent vs Own
- Severe rent burden
- 469.0
Population outlook (Berks County) Hauer SSP2
- Today (2025)
- 425,767 people
- By 2030
- 428,814 · +0.7%
- By 2040
- 433,463 · +1.8%
- By 2050
- 439,426 · +3.2%
- By 2075
- 478,647 · +12.4%
- By 2100
- 518,507 · +21.8%
Race, ethnicity, and origin ACS 2023
- Neighborhood character
- Predominantly White (67%)
- Race & ethnicity
- White 67% Hispanic / Latino 22% Two or more races 12% Black 5% Asian 1%
- Hispanic origin (detail)
- Mexican 3% Puerto Rican 14% Dominican 3%
- Common ancestry
- Romanian 5% Italian 2% Slovak 1%
- Foreign-born
- 7% · Canada, Jamaica
- Languages at home
- 83% English-only · Spanish 14% Russian/Polish/Slavic 1% Other Indo-European 1%
Political lean MEDSL · Berks
- 2024 margin
- R (+12.2) · D 43.4% · R 55.6%
- 2008→2024 swing
- -21.4pp toward R · 2008: 9.2pp · 2024: -12.2pp
- All cycles
- 2024: R+12.2 2020: R+8.2 2016: R+10.2 2012: R+0.6 2008: D+9.2
Not yet ingested
- Civics
- —
Market trends
- HPI YoY
- ▼ -46.25%
- Current HPI
- 282.2782
- Rent YoY
- —
- Metro
- Reading, PA
- State GDP YoY
- ▲ 1.68%
- F500 in state
- 34
Industry mix (Fortune 500 HQ in PA)
| Industry | F500 HQs | Revenue |
|---|---|---|
| Healthcare | 2 | $309B |
|
||
| Insurance | 2 | $27B |
|
||
| Telecommunications / Media | 1 | $124B |
|
||
| Industrial Distribution | 1 | $22B |
|
||
| Financial Services | 1 | $20B |
|
||
| Chemicals / Materials | 1 | $18B |
|
||
Price history
-6.7% since first listed8 events — show timeline
- 2026-03-17 Pending — BRIGHT MLS
- 2026-03-05 Listing Removed — BRIGHT MLS
- 2025-11-20 Price Changed $499,000 BRIGHT MLS
- 2025-11-20 Relisted — BRIGHT MLS
- 2025-11-05 Pending — BRIGHT MLS
- 2025-11-02 Listing Removed — BRIGHT MLS
- 2025-10-29 Price Changed $510,000 BRIGHT MLS
- 2025-10-14 Listed $535,000 BRIGHT MLS
Property tax history
+2.2%/yrLatest (2026): $4,785 · +0.0% YoY. Source: county tax records.
Cash-flow waterfall
monthlySold comps — $/sqft
last 12 mo · ≤1 miLoading sold comps…