1060 S Main St #74 · Brigham City, UT
Flood risk 6/10 · Moderate
- FEMA flood zone
- X
- Chance of flooding over 30 yrs
- 0.97%
- Est. flood insurance / yr
- $435 – $905
Fire risk 5/10 · Moderate
- Est. fire insurance / yr
- $453 – $841
Heat risk 4/10 · Minor
- Hot days now (above threshold)
- 9 days/yr
- Hot days in 30 yrs
- 25 days/yr
Wind risk No data
- Chance of severe wind over 30 yrs
- —
Air-quality risk 3/10 · Minor
- Unhealthy air days now
- 3 days/yr
- Unhealthy air days in 30 yrs
- 3 days/yr
Risk factors via First Street. Map © Google.
Why this score? — see what drove the C grade
The composite is a weighted blend of 9 inputs, each scored 0–100. Each bar is that input's sub-score; the figure is the points it added to the 100-point composite (weight × sub-score).
- Cash flow +20.6/30.0
- 1% rule +10.0/10.0
- ARV discount +7.5/15.0
- DSCR +6.5/10.0
- Schools +3.6/10.0
- Livability +3.4/5.0
- Rent growth +2.5/5.0
- Condition / age +2.5/5.0
- Appreciation +0.0/10.0
$65,000
🖨 Deal sheet (PDF) 📄 Offer letter ✓ Due diligence
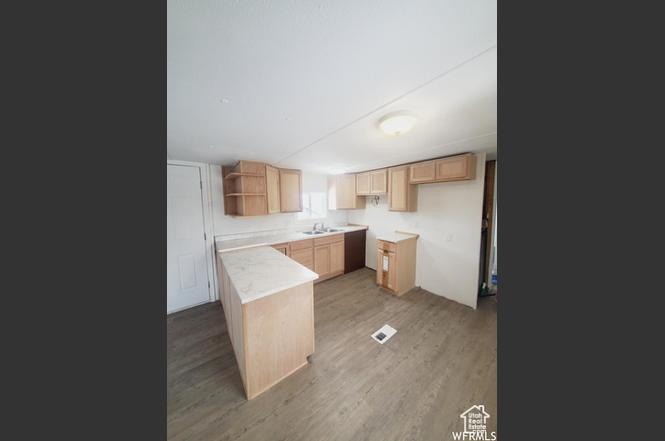
Listing remarks
Newly remodeled mobile home. Three bedrooms and 1 bedroom and new windows. Call for your private showing. New owners will be required to have a background check done by the HOA. Sq ft are provided as a courtesy estimate only. Come check it out!
Key facts
- Built 1959
- Listed 870 days
Property features AI
Finance
- Other: Agent owned
- HOA & community: Homeowners association with an annual fee of $600
Exterior
- Utilities: Culinary water
- Home design: Mobile home; Built/standing condition (effective year 2023); Residential use
- Construction: Built in 2023
- Exterior features: Faces west; Lot dimensions listed (0.0 x 0.0 x 0.0)
Interior
- Bedrooms: Three main-level bedrooms
- Bathrooms: One full bathroom
- Heating & cooling: Forced air heating
- Interior features: Six total rooms; No basement
Neighborhood map
What this means for you Summary
Snapshot
- This is a 3-bed/1.0-bath manufactured listed at $65k.
Deal economics
- At list price, monthly cash flow is $87 ($1k/yr) — positive.
- The deal already cash-flows at list — no discount required.
- Meets the 1% rule at list price ($1k rent vs $65k).
- Recommended offer: $57k (12.0% below list) — sets the bar for market timing.
Location & tenants
- Location reads 68/100 on livability (#115 in UT) — a middle-class / working-renter tenant base. Strengths: cost of living A+, housing A+; Watch: amenities F, commute F.
- Box Elder District (town): math 41% / reading 42% proficiency, ranked #38 of 80 in UT (top 48%) — families likely to look elsewhere, expect single-tenant / working-renter base with shorter leases.
- Zoned schools: Lake View School (math 28% / reading 26%, grade F, #454 of 585 statewide, top 79%, 609 students, 55% FRL); Young Intermediate (math 38% / reading 43%, grade F, #69 of 138 statewide, top 51%, 1,079 students, 33% FRL); Box Elder High (math 29% / reading 50%, grade F, #65 of 171 statewide, top 39%, 1,583 students, 23% FRL).
- Market conditions: 329 active listings in the ZIP; 3 comparable units currently listed for rent nearby; rentals at typical pace (median 26d on market — plan ~3-4 weeks tenant-placement turnaround); 461 units permitted in Box Elder County in 2024 (62 in 5+ unit buildings).
Forward outlook
- Local home prices are declining (-3.0%/yr); year-one equity from $449 of loan paydown is wiped out by about $2k of value loss. Plan a longer hold.
- Box Elder County population projected at +6% by 2050 — modest demand growth; plan on rents tracking national, not racing it.
Negotiation context
- It's been on market 870 days — a 12% lower offer ($57k) is reasonable based on typical stale-listing flexibility.
- 4 sale attempts since 3y ago; this cycle's ask has dropped $7k (10%) from the opening price — seller is motivated, your offer sets the floor, not the list.
Risks & watch-outs
- Watch-outs: HOA is 42% of rent; built in 1959 — expect roof / HVAC / electrical / plumbing capex.
- Climate carrying-cost: major flood risk; moderate wildfire risk — expect insurance premiums to compound above CPI over the hold.
Questions for the listing agent
- It's been on market 870 days. Have you received any prior offers? Is the seller open to a 12% concession, seller financing, or rate buy-down credit?
- Built in 1959 — when were the roof, HVAC, electrical panel, plumbing, and water heater last replaced?
- What does the HOA fee cover, when was the last increase, and are there any pending special assessments or reserve-fund shortfalls?
- Why hasn't it sold? Are there any deal-killer items the seller is aware of (foundation, flood, title, zoning, code violations)?
- Is there a deadline driving the sale (1031 exchange, divorce, estate, relocation)? That informs how much negotiation room exists.
- Schools are D-rated, which usually means shorter tenancies and higher turnover. Who's the typical renter profile here, and what's been the actual vacancy rate?
- What's the average days-on-market for RENTAL listings here right now (not sales)? A rising rental-DOM trend means longer vacancies and softer asking-rent achievability than the comps imply.
- What's the recent tenant-quality profile in this submarket — average credit score on applications, eviction rate, late-payment / NSF rate, and stable-employment percentage? A property-management company in the area should have these aggregated.
- How much new for-sale + rental construction is in the pipeline within 1–3 miles? Heavy new supply typically softens prices + rents 12–24 months out; constrained supply supports both.
Investment metrics
- 1% rule
- 2.21% ✓
- Cap rate
- 7.90%
- Cash-on-cash
- 5.72%
- DSCR
- 1.25
- GRM
- 3.8
CMA / ARV
No comps found within radius.
Projected returns pro-forma
-3.0% appreciation · 3.0% rent growth · sell at horizon
- IRR
- -6.8%
- Equity multiple
- 0.75×
- Total profit
- $-4,612
- Equity at exit
- $9,692
- IRR
- 3.5%
- Equity multiple
- 1.26×
- Total profit
- $4,691
- Equity at exit
- $5,620
Cash invested: $18,200 (down + closing). Projections, not guarantees.
Landlord ↔ Tenant lean methodology
- Overall (STATE)
- 86 Strongly Landlord-Friendly
- State Utah
- 86 Strongly Landlord-Friendly · R+15
- County
- — inherits STATE
- City
- — inherits STATE
ZIP-level market 84302
- Active inventory
- 329
- Price-to-rent
- 3.8×
Monthly cashflow live
- Estimated rent
- $1,438 medium interval (Pro) →
- Mortgage (P&I)
- −$341
- Tax est. 1.5%
- −$81 /mo · $975/yr
- Insurance
- −$27
- HOA
- −$600
- Vacancy / Maint / Mgmt
- −$302
- Net cashflow
- $87
Break-even live
Sensitivity live
| Price | -10% $132 | -5% $109 | +0% $87 | +5% $64 | +10% $42 |
|---|---|---|---|---|---|
| Rent | -10% $-27 | -5% $30 | +0% $87 | +5% $144 | +10% $200 |
| Rate | -1.0pp $120 | -0.5pp $103 | base $87 | +0.5pp $70 | +1.0pp $53 |
UW: 25.0% down · 7.5% · 30yr · 1.5% tax · 5.0% vac · 8.0% maint · 8.0% mgmt
Financing live
Cash to close
- Down payment
- $16,250
- Closing costs
- $1,950
- Reserves months
- —
- Total cash needed
- —
Loan-product check · same deal, 3 products live
Conventional
25% down · 7.5% · 30yr
- Down + closing
- —
- Monthly P&I
- —
- Monthly cashflow
- —
- DSCR
- —
- Eligible?
- —
Personal DTI + credit; lowest rate.
DSCR
20% down · 8.5% · 30yr
- Down + closing
- —
- Monthly P&I
- —
- Monthly cashflow
- —
- DSCR
- —
- Eligible?
- —
No personal income docs; deal must DSCR.
Hard money
10% down · 12.0% · 12mo
- Down + closing
- —
- Monthly P&I
- —
- Monthly cashflow
- —
- DSCR
- —
- Eligible?
- —
Short-term bridge; refi at stabilization.
Rent comps 3 comps
| Address | Beds | Baths | Sqft | Rent | $/sqft | DOM | Units | Dist |
|---|---|---|---|---|---|---|---|---|
| 747 S Main St Brigham City, UT | 1.0–2.0 | 1.0–2.0 | 860 | $1,600 | $1.86 | 25d | 4 | 0.49mi |
| 295 E 800 S Unit B405 Brigham City, UT | 2.0 | 1.0 | 947 | $1,250 | $1.32 | 25d | 1 | 0.56mi |
| 800 E 100 S Unit 4 Brigham City, UT | 2.0 | 2.0 | 1076 | $1,450 | $1.35 | 25d | 1 | 1.44mi |
HOA detail
- Monthly dues
- $600 · $7,200/yr
Listing history 27 events
-
2026-06-22days on market $65,000 Active 870 DOM
-
2026-06-18days on market $65,000 Active 867 DOM
-
2026-06-17days on market $65,000 Active 866 DOM
-
2026-06-16days on market $65,000 Active 865 DOM
-
2026-06-15days on market $65,000 Active 864 DOM
-
2026-06-14days on market $65,000 Active 862 DOM
-
2026-06-10days on market $65,000 Active 859 DOM
-
2026-06-09days on market $65,000 Active 858 DOM
-
2026-06-08days on market $65,000 Active 857 DOM
-
2026-06-07days on market $65,000 Active 856 DOM
-
2026-06-03days on market $65,000 Active 852 DOM
-
2026-06-02days on market $65,000 Active 851 DOM
-
2026-06-01days on market $65,000 Active 850 DOM
-
2026-05-31days on market $65,000 Active 849 DOM
-
2026-05-31days on market $65,000 Active 848 DOM
-
2025-01-04status Active
-
2024-12-23historical
-
2024-06-09price $65,000
-
2024-04-01price $70,000
-
2024-01-22$72,000 Active
-
2023-10-06historical
-
2023-09-11price $64,000
-
2023-08-26price $68,000
-
2023-08-04price $70,000
-
2023-08-04status Active
-
2023-04-19status Under Contract
-
2023-04-05$65,000 Active
ⓘ Source: listings_history table (triggers on properties + properties_extension) + one-shot
backfill from property_details.listing_events for pre-trigger history.
Climate risk First Street
- Flood 6/10 Major FEMA zone X · 97% chance over 30 yrs
- Wildfire 5/10 Major
- Heat 4/10 Moderate
- Air quality 3/10 Moderate 3 unhealthy d/yr today · 3 by 30 yrs out
Nearby sold comps map
Loading sold comps map…
Walkable amenities ~0.75 mi
Loading nearby amenities…
Taxation est. · year 1
- Rental income
- $17,256
- − Mortgage interest
- −$3,641
- − Property taxes
- −$975
- − Insurance
- −$325
- − Repairs & maintenance
- −$1,380
- − Management
- −$1,380
- − HOA
- −$7,200
- − Depreciation
- −$1,891
- Taxable income
- $463
- Est. tax owed @ 24.0%
- −$111
- After-tax cash flow
- $931/yr
For passive investors: Depreciation is non-cash, so a rental often shows a tax loss while cash-flowing — sheltering income. Rental losses are passive: they offset passive income freely, and up to $25,000/yr can offset ordinary (W-2) income if you actively participate and your MAGI is under $100k (phasing out to $0 by $150k); unused losses carry forward. On sale, claimed depreciation is recaptured at up to 25%, and gains may owe capital-gains tax (a 1031 exchange can defer both). Figures are a year-1 estimate at your 24.0% rate — not tax advice; consult a CPA.
Schools (NCES district)
- District
- Box Elder District
- NCES district ID
- 4900090
- Math proficiency
- 41% ▼ -4.00%
- Reading proficiency
- 42% ▼ -6.00%
- Median HH income
- $55,796
- Composite
- 36.3/100
- National rank
- #4698
- State rank
- #38 of 80 in UT
Livability — Brigham City
- Score
- 68/100
- State rank
- #115
- US rank
- #9530
Category grades
Schools grade is shown separately in the Schools card above.
Census & demographics
- Census place
- Brigham City, UT
- Population (ZIP)
- 26,711
Population outlook (Box Elder County) Hauer SSP2
- Today (2025)
- 55,528 people
- By 2030
- 56,848 · +2.4%
- By 2040
- 58,697 · +5.7%
- By 2050
- 59,164 · +6.5%
- By 2075
- 55,699 · +0.3%
- By 2100
- 45,932 · -17.3%
Race, ethnicity, and origin ACS 2023
- Neighborhood character
- Predominantly White (85%)
- Race & ethnicity
- White 85% Hispanic / Latino 10% Two or more races 8%
- Hispanic origin (detail)
- Mexican 7%
- Common ancestry
- Slovak 5% Italian 5% Portuguese 2%
- Foreign-born
- 3% · Canada
- Languages at home
- 93% English-only · Spanish 6%
Political lean MEDSL · Box Elder
- 2024 margin
- Solid R (+60.8) · D 18.2% · R 79.0% · Other 2.7%
- 2008→2024 swing
- +1.7pp toward D · 2008: -62.5pp · 2024: -60.8pp
- All cycles
- 2024: R+60.8 2020: R+63.2 2016: R+51.4 2012: R+78.2 2008: R+62.5
Not yet ingested
- Civics
- —
Market trends
- HPI YoY
- ▼ -256.79%
- Current HPI
- 259.4008
- Rent YoY
- —
- Metro
- —
- State GDP YoY
- ▲ 3.54%
- F500 in state
- 2
Industry mix (Fortune 500 HQ in UT)
| Industry | F500 HQs | Revenue |
|---|---|---|
| Financial Services | 1 | $3B |
|
||
Price history
+0.0% since first listed12 events — show timeline
- 2025-01-04 Relisted — WFRMLS
- 2024-12-23 Listing Removed — WFRMLS
- 2024-06-09 Price Changed $65,000 WFRMLS
- 2024-04-01 Price Changed $70,000 WFRMLS
- 2024-01-22 Listed $72,000 WFRMLS
- 2023-10-06 Listing Removed — WFRMLS
- 2023-09-11 Price Changed $64,000 WFRMLS
- 2023-08-26 Price Changed $68,000 WFRMLS
- 2023-08-04 Price Changed $70,000 WFRMLS
- 2023-08-04 Relisted — WFRMLS
- 2023-04-19 Pending — WFRMLS
- 2023-04-05 Listed $65,000 WFRMLS
Cash-flow waterfall
monthlySold comps — $/sqft
last 12 mo · ≤1 miLoading sold comps…