 Triplex
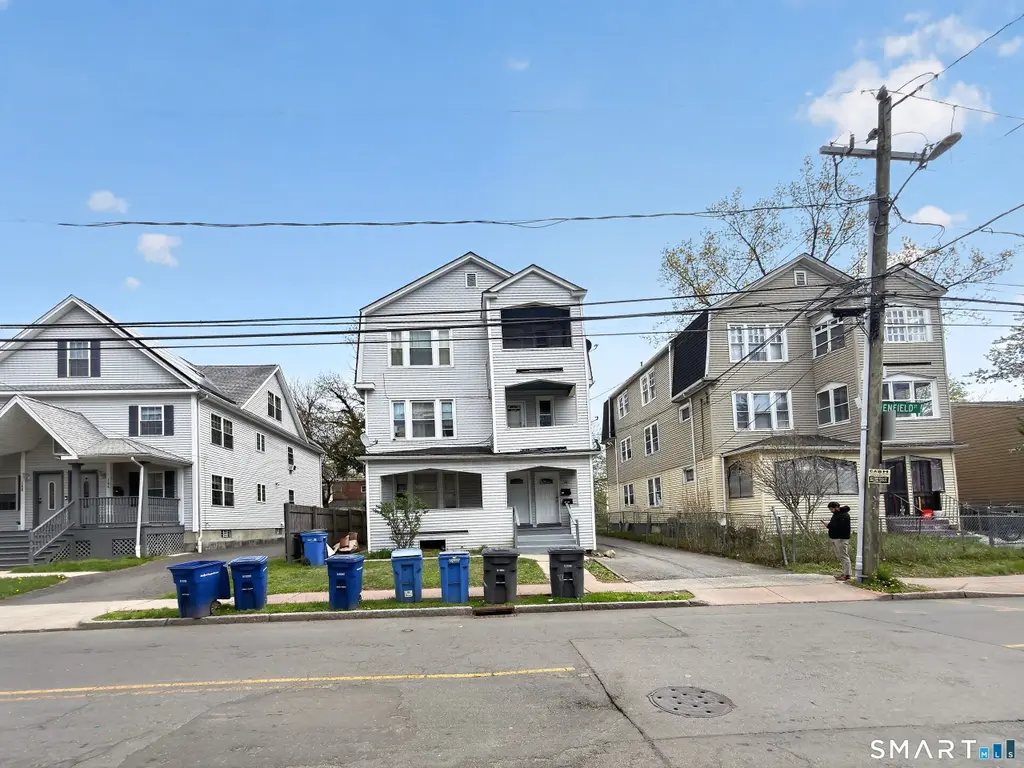
140 Enfield St · Hartford, CT
Flood risk 1/10 · Minimal
- FEMA flood zone
- X (unshaded)
- Chance of flooding over 30 yrs
- 0.0%
- Est. flood insurance / yr
- $473 – $860
Fire risk 1/10 · Minimal
- Est. fire insurance / yr
- $829 – $1,539
Heat risk 5/10 · Moderate
- Hot days now (above 97°F)
- 7 days/yr
- Hot days in 30 yrs
- 16 days/yr
Wind risk 6/10 · Moderate
- Chance of severe wind over 30 yrs
- 27.0%
Air-quality risk 3/10 · Minor
- Unhealthy air days now
- 3 days/yr
- Unhealthy air days in 30 yrs
- 4 days/yr
Risk factors via First Street. Map © Google.
Why this score? — see what drove the B- grade
The composite is a weighted blend of 9 inputs, each scored 0–100. Each bar is that input's sub-score; the figure is the points it added to the 100-point composite (weight × sub-score).
- Cash flow +29.4/30.0
- DSCR +10.0/10.0
- Appreciation +10.0/10.0
- 1% rule +8.2/10.0
- Livability +3.8/5.0
- Rent growth +2.5/5.0
- Condition / age +2.2/5.0
- Schools +1.4/10.0
- ARV discount +0.0/15.0
$509,900
🖨 Deal sheet 📄 Offer letter ✓ Due diligence
Multi-family units
County records classify this as Multi-Family (2-4 Unit). Listing-text estimate: 3 units. confirmed
Listing remarks MLS
Well-maintained three-family home located at 140 Enfield Street in Hartford, CT, offering over 3,800 square feet of living space and just minutes from downtown Hartford. This is an excellent opportunity for both investors and owner-occupants. Each unit features 3 spacious bedrooms, 1 full bathroom, and over 1,000 square feet of comfortable living space, providing strong rental potential and flexibility. Conveniently situated near public transportation, schools, shopping centers, grocery stores, and everyday essentials, this property offers both accessibility and practicality. Don't miss your chance to own a multi-family home in a prime Hartford location-perfect for generating income or building long-term equity.
Key facts
- Three-family home
- 5,227 sq ft lot
- 4 parking spots
Tags
Neighborhood map
What this means for you Summary
Snapshot
- This is a 3 × 3-bed/1.0-bath units multifamily listed at $510k. Condition is rated fair.
Deal economics
- At list price, monthly cash flow is $2k ($22k/yr) — positive. Per door: $604/mo.
- The deal already cash-flows at list — no discount required.
- Meets the 1% rule at list price ($7k rent vs $510k).
Location & tenants
- Location reads 76/100 on livability (#58 in CT, #3,553 nationally) — a middle-class / working-renter tenant base. Strengths: amenities A+, commute A+, health & safety A+; Watch: schools D-, crime F, employment F.
- Hartford School District (urban): math 13% / reading 21% proficiency, ranked #150 of 153 in CT (top 98%) — low school quality limits family demand, transient renter base, plan for 1-2y turnover; 84% free/reduced lunch — lower-income household profile, screen leases tightly.
- Market conditions: 47 active listings in the ZIP; lower-income renter base — watch delinquency; 1,867 units permitted in Capitol Planning Region in 2024 (1,399 in 5+ unit buildings).
- At $6,756/mo this rent would consume 182% of the median local household income ($44k/yr) (locally 1466% of renters already pay >50% of income on rent) — very limited rent-growth headroom before tenants either downsize or default.
Forward outlook
- In year one you build about $55k of equity ($4k loan paydown + $51k appreciation (10.0% local appreciation)).
- At projected returns (10.0% appreciation + 3.0% rent growth), your $143k cash investment doubles in ~2 years — after that, you're playing with house money.
- By year 2, paydown + projected appreciation supports a ~$88k cash-out refi (75% LTV) — recoverable capital for the next deal without selling this one.
Negotiation context
- Only 1 days on market — expect competitive offers; lowballing is unlikely to land.
- 7 sale attempts since 11y ago with the ask held roughly flat each time — persistent listings suggest the price (not the market) is what's stuck; bring a comps-based counter.
- Current owner paid $435k; 17% above their basis — modest negotiation headroom, anchor on the comps not their cost.
Risks & watch-outs
- Watch-outs: built in 1925 — expect roof / HVAC / electrical / plumbing capex.
- Climate carrying-cost: major wind risk, 27% chance of damaging wind over 30y; extreme-heat days projected 7→16/yr by 2055 (HVAC capex compounding) — expect insurance premiums to compound above CPI over the hold.
Questions for the listing agent
- Can we see the unit-by-unit rent roll, current vacancy, and any below-market leases? What's the average tenancy length?
- What capital expenditures (roof, boiler, parking lot, exteriors) have been made in the last 5 years, and what's planned in the next 2?
- Have any recent inspections been done? Can we get a copy of the seller's disclosures and any deferred-maintenance estimates?
- Built in 1925 — when were the roof, HVAC, electrical panel, plumbing, and water heater last replaced?
- Is there a deadline driving the sale (1031 exchange, divorce, estate, relocation)? That informs how much negotiation room exists.
- Schools are D-rated, which usually means shorter tenancies and higher turnover. Who's the typical renter profile here, and what's been the actual vacancy rate?
- Crime grade is F in this area — have there been break-ins, vandalism, or insurance claims at this property in the last 3 years? What carrier currently insures it and at what premium?
- What's the average days-on-market for RENTAL listings here right now (not sales)? A rising rental-DOM trend means longer vacancies and softer asking-rent achievability than the comps imply.
- What's the recent tenant-quality profile in this submarket — average credit score on applications, eviction rate, late-payment / NSF rate, and stable-employment percentage? A property-management company in the area should have these aggregated.
- How much new apartment / multifamily construction is in the pipeline within 1–3 miles? Heavy new supply (>2% of stock underway) typically softens rents 12–24 months out; light construction supports rent growth.
Investment metrics
- 1% rule
- 1.32% ✓
- Cap rate
- 10.56%
- Cash-on-cash
- 15.24%
- DSCR
- 1.68
- GRM
- 6.3
CMA / ARV
- ARV (median comp)
- $427,311
- List price
- $509,900
- Delta
- 17.01%
- Verdict
- OVERPRICED
- Comps
- 3 within 2.0 mi
Projected returns pro-forma
10.0% appreciation · 3.0% rent growth · sell at horizon
- IRR
- 35.5%
- Equity multiple
- 3.75×
- Total profit
- $393,306
- Equity at exit
- $459,358
- IRR
- 30.6%
- Equity multiple
- 8.48×
- Total profit
- $1,067,596
- Equity at exit
- $990,624
Cash invested: $142,772 (down + closing). Projections, not guarantees.
Landlord ↔ Tenant lean methodology
- Overall (STATE)
- 27 Tenant-Leaning
- State Connecticut
- 27 Tenant-Leaning · D+7
- County
- — inherits STATE
- City
- — inherits STATE
ZIP-level market 06112
- Home prices YoY
- 4.9%
- Active inventory
- 47
- Price-to-rent
- 18.9×
Monthly cashflow live
- Estimated rent
- $6,756 high interval (Pro) →
- Mortgage (P&I)
- −$2,674
- Tax est. 1.5%
- −$637 /mo · $7,648/yr
- Insurance
- −$212
- HOA
- −$0
- Vacancy / Maint / Mgmt
- −$1,419
- Net cashflow
- $1,813
Break-even live
3-unit breakdown (identical units grouped — click to expand)
| Units | Beds | Baths | Est. rent |
|---|---|---|---|
| 3× units | 3 | 1 | $6,756 |
| #1 | 3 | 1 | $2,252 |
| #2 | 3 | 1 | $2,252 |
| #3 | 3 | 1 | $2,252 |
| Total (3 units) | $6,756 | ||
UW: 25.0% down · 7.5% · 30yr · 1.5% tax · 5.0% vac · 8.0% maint · 8.0% mgmt
Financing live
Cash to close
- Down payment
- $127,475
- Closing costs
- $15,297
- Reserves months
- —
- Total cash needed
- —
Loan-product check · same deal, 3 products live
Conventional
25% down · 7.5% · 30yr
- Down + closing
- —
- Monthly P&I
- —
- Monthly cashflow
- —
- DSCR
- —
- Eligible?
- —
Personal DTI + credit; lowest rate.
DSCR
20% down · 8.5% · 30yr
- Down + closing
- —
- Monthly P&I
- —
- Monthly cashflow
- —
- DSCR
- —
- Eligible?
- —
No personal income docs; deal must DSCR.
Hard money
10% down · 12.0% · 12mo
- Down + closing
- —
- Monthly P&I
- —
- Monthly cashflow
- —
- DSCR
- —
- Eligible?
- —
Short-term bridge; refi at stabilization.
Listing history 31 events
-
2026-06-18pricedays on market $509,900 Active 1 DOM
-
2026-06-15days on market $499,999 Active 58 DOM
-
2026-06-13days on market $499,999 Active 56 DOM
-
2026-06-13days on market $499,999 Active 55 DOM
-
2026-06-10days on market $499,999 Active 53 DOM
-
2026-06-09days on market $499,999 Active 52 DOM
-
2026-06-08days on market $499,999 Active 51 DOM
-
2026-06-07days on market $499,999 Active 50 DOM
-
2026-06-05days on market $499,999 Active 47 DOM
-
2026-06-03days on market $499,999 Active 46 DOM
-
2026-06-02days on market $499,999 Active 45 DOM
-
2026-06-01days on market $499,999 Active 44 DOM
-
2026-05-31days on market $499,999 Active 43 DOM
-
2026-04-18$525,000 Active 724-char remark
Show marketing remark (724 chars)
Well-maintained three-family home located at 140 Enfield Street in Hartford, CT, offering over 3,800 square feet of living space and just minutes from downtown Hartford. This is an excellent opportunity for both investors and owner-occupants. Each unit features 3 spacious bedrooms, 1 full bathroom, and over 1,000 square feet of comfortable living space, providing strong rental potential and flexibility. Conveniently situated near public transportation, schools, shopping centers, grocery stores, and everyday essentials, this property offers both accessibility and practicality. Don't miss your chance to own a multi-family home in a prime Hartford location-perfect for generating income or building long-term equity.
-
2025-05-09soldstatus $435,000 Closed 612-char remark
Show marketing remark (612 chars)
This well-kept three-family home at 140-142 Enfield St, Hartford, CT is a fantastic opportunity for investors or owner-occupants. Featuring low-maintenance upkeep and off-street parking in the backyard, this property offers convenience and long-term value. Located near public transportation, convenience stores, and shopping areas, it provides easy access to everyday essentials. Each unit is occupied by reliable, paying tenants, with room to increase rents, making it an attractive investment with income growth potential. Don't miss your chance to own this multi-family property in a prime Hartford location!
-
2025-03-26status Under Contract 612-char remark
Show marketing remark (612 chars)
This well-kept three-family home at 140-142 Enfield St, Hartford, CT is a fantastic opportunity for investors or owner-occupants. Featuring low-maintenance upkeep and off-street parking in the backyard, this property offers convenience and long-term value. Located near public transportation, convenience stores, and shopping areas, it provides easy access to everyday essentials. Each unit is occupied by reliable, paying tenants, with room to increase rents, making it an attractive investment with income growth potential. Don't miss your chance to own this multi-family property in a prime Hartford location!
-
2025-03-19$399,000 Active 612-char remark
Show marketing remark (612 chars)
This well-kept three-family home at 140-142 Enfield St, Hartford, CT is a fantastic opportunity for investors or owner-occupants. Featuring low-maintenance upkeep and off-street parking in the backyard, this property offers convenience and long-term value. Located near public transportation, convenience stores, and shopping areas, it provides easy access to everyday essentials. Each unit is occupied by reliable, paying tenants, with room to increase rents, making it an attractive investment with income growth potential. Don't miss your chance to own this multi-family property in a prime Hartford location!
-
2021-09-29historical
-
2021-08-15$289,000 Active
-
2021-06-01soldstatus $187,000 Closed
-
2021-02-01$200,000 Active
-
2021-01-26historical $200,000
-
2018-05-17status Under Contract
-
2018-05-17soldstatus $120,360 Closed
-
2018-04-10historical Under Contract - Continue to Show
-
2018-03-29price $129,900
-
2018-01-22$134,900 Active
-
2016-05-31historical
-
2016-01-16$139,900
-
2015-12-31historical
-
2015-07-30$139,900
ⓘ Source: listings_history table (triggers on properties + properties_extension) + one-shot
backfill from property_details.listing_events for pre-trigger history.
Climate risk First Street
- Flood 1/10 Low FEMA zone X (unshaded) · 0% chance over 30 yrs
- Wildfire 1/10 Low
- Heat 5/10 Major 7 d/yr ≥97°F today · 16 d/yr by 30 yrs out
- Wind 6/10 Major 27% chance of damaging wind over 30 yrs
- Air quality 3/10 Moderate 3 unhealthy d/yr today · 4 by 30 yrs out
Nearby sold comps map
Loading sold comps map…
Walkable amenities ~0.75 mi
Loading nearby amenities…
Taxation est. · year 1
- Rental income
- $81,072
- − Mortgage interest
- −$28,562
- − Property taxes
- −$7,648
- − Insurance
- −$2,550
- − Repairs & maintenance
- −$6,486
- − Management
- −$6,486
- − Depreciation
- −$14,833
- Taxable income
- $14,507
- Est. tax owed @ 24.0%
- −$3,482
- After-tax cash flow
- $18,280/yr
For passive investors: Depreciation is non-cash, so a rental often shows a tax loss while cash-flowing — sheltering income. Rental losses are passive: they offset passive income freely, and up to $25,000/yr can offset ordinary (W-2) income if you actively participate and your MAGI is under $100k (phasing out to $0 by $150k); unused losses carry forward. On sale, claimed depreciation is recaptured at up to 25%, and gains may owe capital-gains tax (a 1031 exchange can defer both). Figures are a year-1 estimate at your 24.0% rate — not tax advice; consult a CPA.
Condition & rehab AI · 2 photos
This three-family home requires extensive repairs and updates to its roof, exterior, and HVAC system, significantly impacting its value. Immediate action is needed to address these critical issues.
Repairs flagged
- Major roof — Damaged shingles
- Major exterior siding — Weathered and peeling
- Major HVAC/mechanicals — No photos, but likely outdated
Value-add opportunities
- Both repair and replace roof — Critical to safety and appearance
- Both repair and paint exterior siding — Improves curb appeal and value
- Both replace HVAC system — Modernizes and improves comfort
Renovation cost estimate screening
| Repair item | Severity | Est. cost |
|---|---|---|
| roof · Damaged shingles | Major | $15,000–50,000 |
| exterior siding · Weathered and peeling | Major | $15,000–50,000 |
| HVAC/mechanicals · No photos, but likely outdated | Major | $15,000–50,000 |
| Total estimated repair cost · 3 items | $45,000–150,000 |
Value-add ROI direction
- Both repair and replace roof — Critical to safety and appearance ↑
- Both repair and paint exterior siding — Improves curb appeal and value ↑
- Both replace HVAC system — Modernizes and improves comfort ↑
ⓘ Cost ranges are severity-bucket heuristics (US national rule-of-thumb). Get contractor quotes + a written scope before underwriting a rehab budget.
Schools (NCES district)
- District
- Hartford School District
- NCES district ID
- 0901920
- Math proficiency
- 13% ▼ -5.00%
- Reading proficiency
- 21% ▼ -6.00%
- Median HH income
- $30,521
- Composite
- 13.54/100
- National rank
- #9514
- State rank
- #150 of 153 in CT
Livability — Hartford
- Score
- 76/100
- State rank
- #58
- US rank
- #3553
Category grades
Schools grade is shown separately in the Schools card above.
Census & demographics
- Census place
- Hartford, CT
- County
- Hartford County · 754,208 people
- City population
- 121,162
- Metro
- Hartford-East Hartford-Middletown, CT
- Population (ZIP)
- 22,333
- Household income
- $44,460
- Rent vs Own
- Severe rent burden
- 1466.0
Population outlook (Capitol County) Hauer SSP2
- By 2040
- 1,063,519
Race, ethnicity, and origin ACS 2023
- Neighborhood character
- Predominantly Black (68%)
- Race & ethnicity
- Black 68% Hispanic / Latino 19% White 9% Two or more races 6%
- Hispanic origin (detail)
- Puerto Rican 15% Dominican 1%
- Common ancestry
- Hispanic 2%
- Foreign-born
- 26% · Canada
- Languages at home
- 81% English-only · Spanish 14% French/Haitian/Cajun 2% Other Indo-European 1%
Political lean MEDSL · Capitol
- 2024 margin
- Strong D (+21.9) · D 60.1% · R 38.2% · Other 1.7%
- All cycles
- 2024: D+21.9
Not yet ingested
- Civics
- —
Market trends
- HPI YoY
- ▲ 14.58%
- Current HPI
- 310.7763
- Rent YoY
- —
- Metro
- Hartford-East Hartford-Middletown, CT
- State GDP YoY
- ▲ 1.06%
- F500 in state
- 38
Industry mix (Fortune 500 HQ in CT)
| Industry | F500 HQs | Revenue |
|---|---|---|
| Industrial Machinery | 4 | $38B |
|
||
| Insurance | 3 | $71B |
|
||
| Financial Services | 2 | $25B |
|
||
| Transportation / Logistics | 2 | $18B |
|
||
| Healthcare | 1 | $247B |
|
||
| Telecommunications | 1 | $55B |
|
||
Price history
+275.3% since first listed18 events — show timeline
- 2026-04-18 Listed $525,000 Smart MLS
- 2025-05-09 Sold (MLS) $435,000 Smart MLS
- 2025-03-26 Pending — Smart MLS
- 2025-03-19 Listed $399,000 Smart MLS
- 2021-09-29 Listing Removed — Smart MLS
- 2021-08-15 Listed $289,000 Smart MLS
- 2021-06-01 Sold (MLS) $187,000 Smart MLS
- 2021-02-01 Listed $200,000 Smart MLS
- 2021-01-26 Coming Soon $200,000 Smart MLS
- 2018-05-17 Pending — Smart MLS
- 2018-05-17 Sold (MLS) $120,360 Smart MLS
- 2018-04-10 Contingent — Smart MLS
- 2018-03-29 Price Changed $129,900 Smart MLS
- 2018-01-22 Listed $134,900 Smart MLS
- 2016-05-31 Listing Removed — Smart MLS
- 2016-01-16 Listed $139,900 Smart MLS
- 2015-12-31 Listing Removed — Smart MLS
- 2015-07-30 Listed $139,900 Smart MLS
Cash-flow waterfall
monthlySold comps — $/sqft
last 12 mo · ≤1 miLoading sold comps…