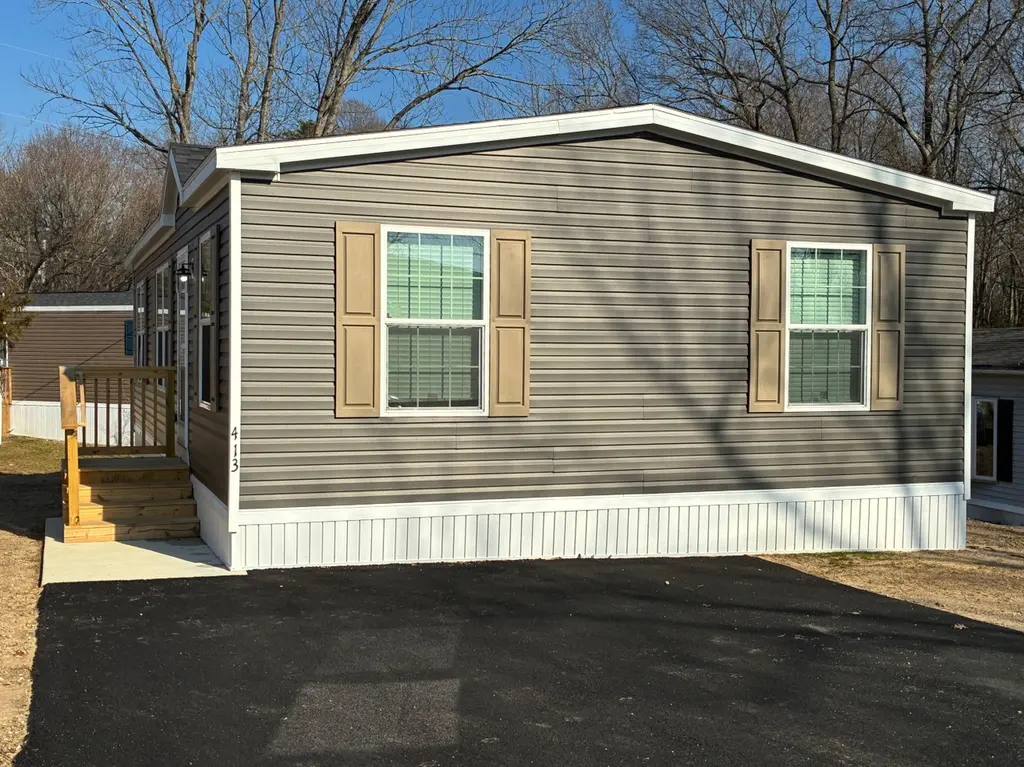
10505 Cedarville Rd Unit 4-13 · Cedarville, MD
Flood risk 1/10 · Minimal
- FEMA flood zone
- X (unshaded)
- Chance of flooding over 30 yrs
- 0.0%
- Est. flood insurance / yr
- $473 – $860
Fire risk 6/10 · Moderate
- Est. fire insurance / yr
- $755 – $1,403
Heat risk 7/10 · Major
- Hot days now (above 102°F)
- 7 days/yr
- Hot days in 30 yrs
- 16 days/yr
Wind risk 5/10 · Moderate
- Chance of severe wind over 30 yrs
- 25.0%
Air-quality risk 3/10 · Minor
- Unhealthy air days now
- 2 days/yr
- Unhealthy air days in 30 yrs
- 3 days/yr
Risk factors via First Street. Map © Google.
Why this score? — see what drove the B- grade
The composite is a weighted blend of 9 inputs, each scored 0–100. Each bar is that input's sub-score; the figure is the points it added to the 100-point composite (weight × sub-score).
- Cash flow +30.0/30.0
- 1% rule +10.0/10.0
- DSCR +10.0/10.0
- ARV discount +7.5/15.0
- Condition / age +5.0/5.0
- Livability +2.9/5.0
- Rent growth +2.5/5.0
- Schools +1.7/10.0
- Appreciation +0.0/10.0
$117,400
🖨 Deal sheet 📄 Offer letter ✓ Due diligence
Listing remarks MLS
Your brand new 3 bedroom, 2 bathroom home is waiting for you to move in! This comfortable home features premium entry doors, a modern bathroom, as well as new brand name appliances. In the community, enjoy with your friends and family all the amenities we have to offer such as a clubhouse, a playground, and community events. This home won't be on the market long, so call us today for more information or to schedule a tour. Deposits & Fees are subject to change.
Key facts
- Clubhouse
- Modern bathroom
- Premium entry doors
Tags
Neighborhood map
What this means for you Summary
Snapshot
- This is a 3-bed/2.0-bath manufactured listed at $117k. Condition is rated excellent.
Deal economics
- At list price, monthly cash flow is $1k ($17k/yr) — positive.
- The deal already cash-flows at list — no discount required.
- Meets the 1% rule at list price ($3k rent vs $117k).
- Recommended offer: $103k (12.0% below list) — sets the bar for market timing.
Location & tenants
- Location reads 57/100 on livability (#399 in MD) — a working-class tenant base; expect higher turnover. Strengths: employment A+, crime A, cost of living B; Watch: schools F, amenities F, commute F.
- Prince George'S County Public Schools (suburban): math 8% / reading 24% proficiency, ranked #21 of 24 in MD (top 88%) — low school quality limits family demand, transient renter base, plan for 1-2y turnover.
- Market conditions: 216 active listings in the ZIP; high-income renter base; 1,481 units permitted in Prince George's County in 2024 (0 in 5+ unit buildings).
Forward outlook
- Local home prices are declining (-3.0%/yr); year-one equity from $812 of loan paydown is wiped out by about $4k of value loss. Plan a longer hold.
- Prince George's County population projected at +18% by 2050 — long-run rental-demand tailwind backs the buy-and-hold thesis.
- At projected returns (-3.0% appreciation + 3.0% rent growth), your $33k cash investment doubles in ~3 years — after that, you're playing with house money.
Negotiation context
- It's been on market 230 days — a 12% lower offer ($103k) is reasonable based on typical stale-listing flexibility.
Risks & watch-outs
- Climate carrying-cost: moderate wind risk, 25% chance of damaging wind over 30y; major wildfire risk; extreme-heat days projected 7→16/yr by 2055 (HVAC capex compounding) — expect insurance premiums to compound above CPI over the hold.
Questions for the listing agent
- It's been on market 230 days. Have you received any prior offers? Is the seller open to a 12% concession, seller financing, or rate buy-down credit?
- Why hasn't it sold? Are there any deal-killer items the seller is aware of (foundation, flood, title, zoning, code violations)?
- Is there a deadline driving the sale (1031 exchange, divorce, estate, relocation)? That informs how much negotiation room exists.
- Schools are F-rated, which usually means shorter tenancies and higher turnover. Who's the typical renter profile here, and what's been the actual vacancy rate?
- What's the average days-on-market for RENTAL listings here right now (not sales)? A rising rental-DOM trend means longer vacancies and softer asking-rent achievability than the comps imply.
- What's the recent tenant-quality profile in this submarket — average credit score on applications, eviction rate, late-payment / NSF rate, and stable-employment percentage? A property-management company in the area should have these aggregated.
- How much new for-sale + rental construction is in the pipeline within 1–3 miles? Heavy new supply typically softens prices + rents 12–24 months out; constrained supply supports both.
Investment metrics
- 1% rule
- 2.36% ✓
- Cap rate
- 20.38%
- Cash-on-cash
- 50.30%
- DSCR
- 3.24
- GRM
- 3.5
CMA / ARV
No comps found within radius.
Projected returns pro-forma
-3.0% appreciation · 3.0% rent growth · sell at horizon
- IRR
- 48.1%
- Equity multiple
- 3.09×
- Total profit
- $68,780
- Equity at exit
- $17,505
- IRR
- 53.7%
- Equity multiple
- 6.26×
- Total profit
- $173,070
- Equity at exit
- $10,151
Cash invested: $32,872 (down + closing). Projections, not guarantees.
Landlord ↔ Tenant lean methodology
- Overall (STATE)
- 27 Tenant-Leaning
- State Maryland
- 27 Tenant-Leaning · D+14
- County
- — inherits STATE
- City
- — inherits STATE
ZIP-level market 20613
- Home prices YoY
- -29.0%
- Active inventory
- 216
- Price-to-rent
- 3.5×
Monthly cashflow live
- Estimated rent
- $2,771 medium interval (Pro) →
- Mortgage (P&I)
- −$616
- Tax est. 1.5%
- −$147 /mo · $1,761/yr
- Insurance
- −$49
- HOA
- −$0
- Vacancy / Maint / Mgmt
- −$582
- Net cashflow
- $1,378
Break-even live
UW: 25.0% down · 7.5% · 30yr · 1.5% tax · 5.0% vac · 8.0% maint · 8.0% mgmt
Financing live
Cash to close
- Down payment
- $29,350
- Closing costs
- $3,522
- Reserves months
- —
- Total cash needed
- —
Loan-product check · same deal, 3 products live
Conventional
25% down · 7.5% · 30yr
- Down + closing
- —
- Monthly P&I
- —
- Monthly cashflow
- —
- DSCR
- —
- Eligible?
- —
Personal DTI + credit; lowest rate.
DSCR
20% down · 8.5% · 30yr
- Down + closing
- —
- Monthly P&I
- —
- Monthly cashflow
- —
- DSCR
- —
- Eligible?
- —
No personal income docs; deal must DSCR.
Hard money
10% down · 12.0% · 12mo
- Down + closing
- —
- Monthly P&I
- —
- Monthly cashflow
- —
- DSCR
- —
- Eligible?
- —
Short-term bridge; refi at stabilization.
Listing history 15 events
-
2026-06-18days on market $117,400 Active 230 DOM
-
2026-06-17days on market $117,400 Active 229 DOM
-
2026-06-16days on market $117,400 Active 228 DOM
-
2026-06-15days on market $117,400 Active 227 DOM
-
2026-06-13days on market $117,400 Active 225 DOM
-
2026-06-10days on market $117,400 Active 221 DOM
-
2026-06-08days on market $117,400 Active 220 DOM
-
2026-06-07days on market $117,400 Active 219 DOM
-
2026-06-04days on market $117,400 Active 216 DOM
-
2026-06-03days on market $117,400 Active 215 DOM
-
2026-06-02days on market $117,400 Active 214 DOM
-
2026-06-01pricedays on market $117,400 Active 213 DOM
-
2026-05-31days on market $116,900 Active 212 DOM
-
2026-02-01price $116,900 471-char remark
Show marketing remark (471 chars)
Your brand new 3 bedroom, 2 bathroom home is waiting for you to move in! This comfortable home features premium entry doors, a modern bathroom, as well as new brand name appliances. In the community, enjoy with your friends and family all the amenities we have to offer such as a clubhouse, a playground, and community events. This home won't be on the market long, so call us today for more information or to schedule a tour. Deposits & Fees are subject to change.
-
2025-10-31$117,400 Active 471-char remark
Show marketing remark (471 chars)
Your brand new 3 bedroom, 2 bathroom home is waiting for you to move in! This comfortable home features premium entry doors, a modern bathroom, as well as new brand name appliances. In the community, enjoy with your friends and family all the amenities we have to offer such as a clubhouse, a playground, and community events. This home won't be on the market long, so call us today for more information or to schedule a tour. Deposits & Fees are subject to change.
ⓘ Source: listings_history table (triggers on properties + properties_extension) + one-shot
backfill from property_details.listing_events for pre-trigger history.
Climate risk First Street
- Flood 1/10 Low FEMA zone X (unshaded) · 0% chance over 30 yrs
- Wildfire 6/10 Major
- Heat 7/10 Severe 7 d/yr ≥102°F today · 16 d/yr by 30 yrs out
- Wind 5/10 Major 25% chance of damaging wind over 30 yrs
- Air quality 3/10 Moderate 2 unhealthy d/yr today · 3 by 30 yrs out
Nearby sold comps map
Loading sold comps map…
Walkable amenities ~0.75 mi
Loading nearby amenities…
Taxation est. · year 1
- Rental income
- $33,255
- − Mortgage interest
- −$6,576
- − Property taxes
- −$1,761
- − Insurance
- −$587
- − Repairs & maintenance
- −$2,660
- − Management
- −$2,660
- − Depreciation
- −$3,415
- Taxable income
- $15,595
- Est. tax owed @ 24.0%
- −$3,743
- After-tax cash flow
- $12,793/yr
For passive investors: Depreciation is non-cash, so a rental often shows a tax loss while cash-flowing — sheltering income. Rental losses are passive: they offset passive income freely, and up to $25,000/yr can offset ordinary (W-2) income if you actively participate and your MAGI is under $100k (phasing out to $0 by $150k); unused losses carry forward. On sale, claimed depreciation is recaptured at up to 25%, and gains may owe capital-gains tax (a 1031 exchange can defer both). Figures are a year-1 estimate at your 24.0% rate — not tax advice; consult a CPA.
Condition & rehab AI · 3 photos
This brand new 3-bedroom, 2-bathroom home is move-in ready with premium features and a great location.
Value-add opportunities
- Both Landscaping improvements — Enhances curb appeal and adds value
- Both Interior paint touch-ups — Fresh paint can make a home more appealing
- Both New flooring in bathrooms — Modern flooring can increase both resale and rental value
Renovation cost estimate screening
Value-add ROI direction
- Both Landscaping improvements — Enhances curb appeal and adds value ↑
- Both Interior paint touch-ups — Fresh paint can make a home more appealing ↑
- Both New flooring in bathrooms — Modern flooring can increase both resale and rental value ↑
ⓘ Cost ranges are severity-bucket heuristics (US national rule-of-thumb). Get contractor quotes + a written scope before underwriting a rehab budget.
Schools (NCES district)
- District
- Prince George'S County Public Schools
- NCES district ID
- 2400510
- Math proficiency
- 8% ▼ -11.00%
- Reading proficiency
- 24% ▼ -9.00%
- Median HH income
- $73,967
- Composite
- 16.82/100
- National rank
- #9151
- State rank
- #21 of 24 in MD
Livability — Cedarville
- Score
- 57/100
- State rank
- #399
- US rank
- #21965
Category grades
Schools grade is shown separately in the Schools card above.
Census & demographics
- Census place
- Cedarville, MD
- County
- Prince Georges County · 919,866 people
- City population
- 15,923
- Metro
- Washington-Arlington-Alexandria, DC-VA-MD-WV
- Population (ZIP)
- 17,590
- Household income
- $151,422
- Rent vs Own
Population outlook (Prince George's County) Hauer SSP2
- Today (2025)
- 1,005,426 people
- By 2030
- 1,048,416 · +4.3%
- By 2040
- 1,123,425 · +11.7%
- By 2050
- 1,183,220 · +17.7%
- By 2075
- 1,306,202 · +29.9%
- By 2100
- 1,408,179 · +40.1%
Race, ethnicity, and origin ACS 2023
- Neighborhood character
- Predominantly Black (66%)
- Race & ethnicity
- Black 66% White 20% Hispanic / Latino 7% Two or more races 7% Asian 2%
- Hispanic origin (detail)
- Puerto Rican 2%
- Common ancestry
- Lithuanian 1% Iranian 1% Italian 1%
- Foreign-born
- 7% · Canada, Vietnam, United Kingdom
- Languages at home
- 91% English-only · Spanish 3% French/Haitian/Cajun 2%
Political lean MEDSL · Prince George's
- 2024 margin
- Solid D (+75.2) · D 86.3% · R 11.2% · Other 2.5%
- 2008→2024 swing
- -3.3pp toward R · 2008: 78.5pp · 2024: 75.2pp
- All cycles
- 2024: D+75.2 2020: D+80.5 2016: D+81.0 2012: D+80.9 2008: D+78.5
Not yet ingested
- Civics
- —
Market trends
- HPI YoY
- ▼ -101.19%
- Current HPI
- 247.5504
- Rent YoY
- —
- Metro
- Washington-Arlington-Alexandria, DC-VA-MD-WV
- State GDP YoY
- ▲ 2.97%
- F500 in state
- 12
Industry mix (Fortune 500 HQ in MD)
| Industry | F500 HQs | Revenue |
|---|---|---|
| Aerospace / Defense | 1 | $71B |
|
||
| Utilities | 1 | $25B |
|
||
| Hotels | 1 | $24B |
|
||
| Consumer Goods | 1 | $7B |
|
||
| Real Estate | 1 | $6B |
|
||
| Chemicals | 1 | $2B |
|
||
Price history
-0.4% since first listed2 events — show timeline
- 2026-02-01 Price Changed $116,900 Zillow
- 2025-10-31 Listed $117,400 Zillow
Cash-flow waterfall
monthlySold comps — $/sqft
last 12 mo · ≤1 miLoading sold comps…