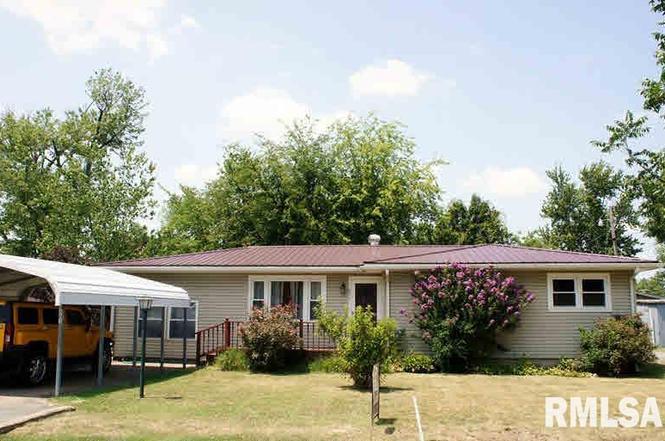
803 Butler St · Metropolis, IL
Flood risk 1/10 · Minimal
- FEMA flood zone
- X
- Chance of flooding over 30 yrs
- 0.0%
- Est. flood insurance / yr
- $507 – $1,088
Fire risk 3/10 · Minor
- Est. fire insurance / yr
- $804 – $1,492
Heat risk 6/10 · Moderate
- Hot days now (above 108°F)
- 7 days/yr
- Hot days in 30 yrs
- 20 days/yr
Wind risk 3/10 · Minor
- Chance of severe wind over 30 yrs
- 6.0%
Air-quality risk 2/10 · Minimal
- Unhealthy air days now
- 1 days/yr
- Unhealthy air days in 30 yrs
- 2 days/yr
Risk factors via First Street. Map © Google.
Why this score? — see what drove the B- grade
The composite is a weighted blend of 9 inputs, each scored 0–100. Each bar is that input's sub-score; the figure is the points it added to the 100-point composite (weight × sub-score).
- Cash flow +25.2/30.0
- ARV discount +15.0/15.0
- DSCR +8.3/10.0
- 1% rule +6.2/10.0
- Livability +3.8/5.0
- Rent growth +2.5/5.0
- Condition / age +2.5/5.0
- Schools +2.2/10.0
- Appreciation +0.0/10.0
$110,000
🖨 Deal sheet 📄 Offer letter ✓ Due diligence
Listing remarks
With four bedrooms, there's plenty of room for the whole family to spread out and make themselves at home. This home features a spacious primary bedroom with walk in closet. Numerous recent updates including: metal roof and laminate flooring. There are also hardwood floors in many of rooms. With an extra corner lot included, you'll have even more room to roam and enjoy the fresh air. Back porch grill is included and already attached to natural gas line. But the real showstopper is the garage - which has been converted into an epic theatre room! Just imagine cozying up with loved ones for a movie night, or hosting friends for a game-day party. The possibilities are endless! This property is
Key facts
- Laminate flooring
- Metal roof
- Hardwood floors
Tags
Property features AI
Finance
- Other: Living area listed as estimated; Immediate possession available
- Financial info: Homeowner tax exemption (per records)
Exterior
- Parking: 2 total parking spaces; 2-car garage with alley access
- Utilities: Public water; Public sewer; 100 amp electric service
- Home design: Detached single-family home; One-story; Fee simple ownership; Built before 1978
- Construction: Block foundation; Block and vinyl siding construction; 71–80 years old
- Exterior features: Corner lot; Lot dimensions approximately 90 x 75 and 40 x 150
Interior
- Kitchen: Eating area/table space; Dishwasher; Range; Refrigerator
- Bedrooms: 4 bedrooms (all on main level); Bedroom sizes: 15 x 24 (master), 12 x 11, 15 x 10, 12 x 12
- Flooring: Hardwood in one bedroom; Laminate in master bedroom and kitchen; Carpet in two bedrooms
- Bathrooms: 1 full bathroom
- Heating & cooling: Forced air heating (natural gas); Central air conditioning
- Interior features: Non-smoking unit; Egress window in basement
- Laundry & utility: Washer/dryer connections not specified
Neighborhood map
What this means for you Summary
Snapshot
- This is a 4-bed/1.0-bath single-family listed at $110k.
Deal economics
- At list price, monthly cash flow is $245 ($3k/yr) — positive.
- The deal already cash-flows at list — no discount required.
- Meets the 1% rule at list price ($1k rent vs $110k).
- Recommended offer: $97k (12.0% below list) — sets the bar for market timing.
- Cap rate 9.0% vs local median 5.3% in Metropolis — top-decile yield for the area; either an underpriced asset or a hidden risk that comps aren't pricing in. Stress-test before assuming the spread holds.
Location & tenants
- Location reads 75/100 on livability (#217 in IL, #4,091 nationally) — a middle-class / working-renter tenant base. Strengths: cost of living A+, housing A+, health & safety A+; Watch: schools D-, commute F, employment D-.
- Massac UD 1 (rural): math 24% / reading 28% proficiency, ranked #318 of 620 in IL (top 51%) — low school quality limits family demand, transient renter base, plan for 1-2y turnover.
- Market conditions: 73 active listings in the ZIP; 5 units permitted in Massac County in 2024 (0 in 5+ unit buildings).
Forward outlook
- Local home prices are declining (-3.0%/yr); year-one equity from $761 of loan paydown is wiped out by about $3k of value loss. Plan a longer hold.
- Massac County population projected at -28% by 2050 — secular population decline; favor cash flow + early exit over multi-decade hold.
Negotiation context
- It's been on market 151 days — a 12% lower offer ($97k) is reasonable based on typical stale-listing flexibility.
- 8 sale attempts since 15y ago; this cycle's ask is 59% above the opening price — seller raised mid-cycle; expect resistance to lowballs.
- Current owner paid $61k; list at $110k implies a 79% gain — meaningful room to come down on a strong offer.
Risks & watch-outs
- Watch-outs: built in 1953 — expect roof / HVAC / electrical / plumbing capex.
- Climate carrying-cost: extreme-heat days projected 7→20/yr by 2055 (HVAC capex compounding) — expect insurance premiums to compound above CPI over the hold.
Questions for the listing agent
- It's been on market 151 days. Have you received any prior offers? Is the seller open to a 12% concession, seller financing, or rate buy-down credit?
- Built in 1953 — when were the roof, HVAC, electrical panel, plumbing, and water heater last replaced?
- Why hasn't it sold? Are there any deal-killer items the seller is aware of (foundation, flood, title, zoning, code violations)?
- Is there a deadline driving the sale (1031 exchange, divorce, estate, relocation)? That informs how much negotiation room exists.
- Schools are D-rated, which usually means shorter tenancies and higher turnover. Who's the typical renter profile here, and what's been the actual vacancy rate?
- What's the average days-on-market for RENTAL listings here right now (not sales)? A rising rental-DOM trend means longer vacancies and softer asking-rent achievability than the comps imply.
- What's the recent tenant-quality profile in this submarket — average credit score on applications, eviction rate, late-payment / NSF rate, and stable-employment percentage? A property-management company in the area should have these aggregated.
- How much new for-sale + rental construction is in the pipeline within 1–3 miles? Heavy new supply typically softens prices + rents 12–24 months out; constrained supply supports both.
Investment metrics
- 1% rule
- 1.12% ✓
- Cap rate
- 8.97%
- Cash-on-cash
- 9.56%
- DSCR
- 1.43
- GRM
- 7.5
CMA / ARV
- ARV (on-the-fly)
- $138,168
- Comps found
- 12
Show comp detail 12 sales within ~0.75 mi
| Address | Dist | Beds/Ba | Sqft | Sold | Price | $/sf | Match |
|---|---|---|---|---|---|---|---|
| 807 E 5th St | 0.28mi | 3/1.0 (-1) | 1,296 (-5%) | 12mo | $75,000 | $58 | 64 |
| 1018 Girard St | 0.35mi | 3/1.0 (-1) | 1,197 (-12%) | 0mo | $19,000 | $16 | 58 |
| 312 E 12th St | 0.36mi | 3/2.0 (-1) | 1,450 (+6%) | 15mo | $110,000 | $76 | 52 |
| 1110 Girard St | 0.37mi | 3/1.0 (-1) | 1,481 (+8%) | 18mo | $119,900 | $81 | 49 |
| 1020 Ferry St | 0.49mi | 3/2.0 (-1) | 1,350 (-1%) | 23mo | $195,000 | $144 | 47 |
| 1002 Ferry St | 0.48mi | 3/1.5 (-1) | 1,200 (-12%) | 8mo | $59,000 | $49 | 43 |
| 1701 Ferry St | 0.73mi | 3/1.0 (-1) | 1,376 (+1%) | 21mo | $110,000 | $80 | 42 |
| 1509 Ferry St | 0.65mi | 3/1.0 (-1) | 1,458 (+7%) | 21mo | $147,500 | $101 | 36 |
| 2 Eagle Ln | 0.58mi | 3/2.0 (-1) | 1,500 (+10%) | 14mo | $180,400 | $120 | 36 |
| 2 Dove Ln | 0.62mi | 3/2.0 (-1) | 1,570 (+15%) | 2mo | $215,000 | $137 | 36 |
| 116 Oak Ln | 0.64mi | 3/2.0 (-1) | 1,476 (+8%) | 23mo | $150,000 | $102 | 29 |
| 1600 Catherine St | 0.71mi | 3/2.0 (-1) | 1,210 (-12%) | 23mo | $137,000 | $113 | 19 |
Match score weights: distance 35% · size 25% · config 20% · recency 20%. Top-matched comps best support the ARV.
Projected returns pro-forma
-3.0% appreciation · 3.0% rent growth · sell at horizon
- IRR
- -1.9%
- Equity multiple
- 0.93×
- Total profit
- $-2,204
- Equity at exit
- $16,401
- IRR
- 7.8%
- Equity multiple
- 1.59×
- Total profit
- $18,183
- Equity at exit
- $9,511
Cash invested: $30,800 (down + closing). Projections, not guarantees.
Landlord ↔ Tenant lean methodology
- Overall (STATE)
- 43 Moderately Tenant-Leaning
- State Illinois
- 43 Moderately Tenant-Leaning · D+7
- County
- — inherits STATE
- City
- — inherits STATE
ZIP-level market 62960
- Home prices YoY
- -19.6%
- Active inventory
- 73
- Price-to-rent
- 7.5×
Monthly cashflow live
- Estimated rent
- $1,227 medium interval (Pro) →
- Mortgage (P&I)
- −$577
- Tax from tax record
- −$101 /mo · $1,213/yr
- Insurance
- −$46
- HOA
- −$0
- Vacancy / Maint / Mgmt
- −$258
- Net cashflow
- $245
Break-even live
UW: 25.0% down · 7.5% · 30yr · 1.5% tax · 5.0% vac · 8.0% maint · 8.0% mgmt
Financing live
Cash to close
- Down payment
- $27,500
- Closing costs
- $3,300
- Reserves months
- —
- Total cash needed
- —
Loan-product check · same deal, 3 products live
Conventional
25% down · 7.5% · 30yr
- Down + closing
- —
- Monthly P&I
- —
- Monthly cashflow
- —
- DSCR
- —
- Eligible?
- —
Personal DTI + credit; lowest rate.
DSCR
20% down · 8.5% · 30yr
- Down + closing
- —
- Monthly P&I
- —
- Monthly cashflow
- —
- DSCR
- —
- Eligible?
- —
No personal income docs; deal must DSCR.
Hard money
10% down · 12.0% · 12mo
- Down + closing
- —
- Monthly P&I
- —
- Monthly cashflow
- —
- DSCR
- —
- Eligible?
- —
Short-term bridge; refi at stabilization.
Listing history 25 events
-
2026-06-13days on market $110,000 Active 151 DOM
-
2026-06-12pricedays on market $110,000 Active 150 DOM
-
2026-05-24status Active
-
2026-05-24status Active
-
2026-05-23historical
-
2026-05-23historical
-
2026-05-23price $132,900
-
2026-04-22price $125,000
-
2026-01-15status Temporarily No Showings
-
2026-01-06historical
-
2025-12-31historical
-
2025-11-07price
-
2025-09-23price
-
2025-06-21Active
-
2021-08-06historical
-
2013-03-04soldstatus $61,453
-
2012-11-02soldstatus $69,000
-
2012-11-02soldstatus $69,000
-
2012-07-20$69,000
-
2012-07-20$69,000
-
2012-01-23soldstatus $53,500
-
2012-01-20soldstatus $53,500
-
2012-01-20soldstatus $53,500
-
2011-10-24$59,500
-
2011-10-24$59,500
ⓘ Source: listings_history table (triggers on properties + properties_extension) + one-shot
backfill from property_details.listing_events for pre-trigger history.
Tax reassessment forecast IL · Partial reset (capped growth)
- Current annual tax
- $1,213 · $101/mo
- Projected year-2 tax
- $1,855 · $155/mo
- Expected delta
- +$642/yr (+$53/mo · 52.9%)
ⓘ Screening estimate from a state-policy table — verify with the county assessor before closing.
Climate risk First Street
- Flood 1/10 Low FEMA zone X · 0% chance over 30 yrs
- Wildfire 3/10 Moderate
- Heat 6/10 Major 7 d/yr ≥108°F today · 20 d/yr by 30 yrs out
- Wind 3/10 Moderate 6% chance of damaging wind over 30 yrs
- Air quality 2/10 Low 1 unhealthy d/yr today · 2 by 30 yrs out
Nearby sold comps map
Loading sold comps map…
Walkable amenities ~0.75 mi
Loading nearby amenities…
Taxation est. · year 1
- Rental income
- $14,720
- − Mortgage interest
- −$6,162
- − Property taxes
- −$1,213
- − Insurance
- −$550
- − Repairs & maintenance
- −$1,178
- − Management
- −$1,178
- − Depreciation
- −$3,200
- Taxable income
- $1,240
- Est. tax owed @ 24.0%
- −$298
- After-tax cash flow
- $2,646/yr
For passive investors: Depreciation is non-cash, so a rental often shows a tax loss while cash-flowing — sheltering income. Rental losses are passive: they offset passive income freely, and up to $25,000/yr can offset ordinary (W-2) income if you actively participate and your MAGI is under $100k (phasing out to $0 by $150k); unused losses carry forward. On sale, claimed depreciation is recaptured at up to 25%, and gains may owe capital-gains tax (a 1031 exchange can defer both). Figures are a year-1 estimate at your 24.0% rate — not tax advice; consult a CPA.
Schools (NCES district)
- District
- Massac UD 1
- NCES district ID
- 1725000
- Math proficiency
- 24% ▼ -13.00%
- Reading proficiency
- 28% ▼ -13.00%
- Median HH income
- $41,431
- Composite
- 22.06/100
- National rank
- #8192
- State rank
- #318 of 620 in IL
Livability — Metropolis
- Score
- 75/100
- State rank
- #217
- US rank
- #4091
Category grades
Schools grade is shown separately in the Schools card above.
Census & demographics
- Census place
- Metropolis, IL
- Population (ZIP)
- 10,823
Population outlook (Massac County) Hauer SSP2
- Today (2025)
- 13,461 people
- By 2030
- 12,675 · -5.8%
- By 2040
- 11,124 · -17.4%
- By 2050
- 9,711 · -27.9%
- By 2075
- 7,253 · -46.1%
- By 2100
- 5,666 · -57.9%
Race, ethnicity, and origin ACS 2023
- Neighborhood character
- Predominantly White (86%)
- Race & ethnicity
- White 86% Black 7% Two or more races 5% Hispanic / Latino 3%
- Common ancestry
- Romanian 2% Serbian 2% Lithuanian 2%
- Foreign-born
- 2% · Canada
- Languages at home
- 97% English-only · Spanish 2%
Political lean MEDSL · Massac
- 2024 margin
- Solid R (+48.8) · D 25.2% · R 74.0%
- 2008→2024 swing
- -25.4pp toward R · 2008: -23.4pp · 2024: -48.8pp
- All cycles
- 2024: R+48.8 2020: R+48.0 2016: R+49.6 2012: R+33.7 2008: R+23.4
Not yet ingested
- Civics
- —
Market trends
- HPI YoY
- ▼ -33.38%
- Current HPI
- 137.0772
- Rent YoY
- —
- Metro
- —
- State GDP YoY
- ▲ 1.59%
- F500 in state
- 60
Industry mix (Fortune 500 HQ in IL)
| Industry | F500 HQs | Revenue |
|---|---|---|
| Insurance | 4 | $201B |
|
||
| Consumer Goods | 4 | $87B |
|
||
| Industrial Machinery | 3 | $64B |
|
||
| Healthcare | 2 | $55B |
|
||
| Retail / Pharmacy | 1 | $148B |
|
||
| Agriculture / Food | 1 | $86B |
|
||
Price history
+123.4% since first listed23 events — show timeline
- 2026-05-24 Relisted — MRED as Distributed by MLS Grid
- 2026-05-24 Relisted — MRED as Distributed by MLS Grid
- 2026-05-23 Listing Removed — MRED as Distributed by MLS Grid
- 2026-05-23 Listing Removed — MRED as Distributed by MLS Grid
- 2026-05-23 Price Changed $132,900 MRED as Distributed by MLS Grid
- 2026-04-22 Price Changed $125,000 MRED as Distributed by MLS Grid
- 2026-01-15 Relisted — MRED as Distributed by MLS Grid
- 2026-01-06 Listing Removed — RMLSA as Distributed by MLS Grid
- 2025-12-31 Listing Removed — MRED as Distributed by MLS Grid
- 2025-11-07 Price Changed — RMLSA as Distributed by MLS Grid
- 2025-09-23 Price Changed — RMLSA as Distributed by MLS Grid
- 2025-06-21 Listed — RMLSA as Distributed by MLS Grid
- 2021-08-06 Listing Removed — RMLSA as Distributed by MLS Grid
- 2013-03-04 Sold (Public Records) $61,453 Public Records
- 2012-11-02 Sold (MLS) $69,000 RMLSA as Distributed by MLS Grid
- 2012-11-02 Sold (MLS) $69,000 MRED as Distributed by MLS Grid
- 2012-07-20 Listed $69,000 RMLSA as Distributed by MLS Grid
- 2012-07-20 Listed $69,000 MRED as Distributed by MLS Grid
- 2012-01-23 Sold (Public Records) $53,500 Public Records
- 2012-01-20 Sold (MLS) $53,500 MRED as Distributed by MLS Grid
- 2012-01-20 Sold (MLS) $53,500 RMLSA as Distributed by MLS Grid
- 2011-10-24 Listed $59,500 MRED as Distributed by MLS Grid
- 2011-10-24 Listed $59,500 RMLSA as Distributed by MLS Grid
Property tax history
-1.5%/yrLatest (2024): $1,213 · -3.0% YoY. Source: county tax records.
Cash-flow waterfall
monthlySold comps — $/sqft
last 12 mo · ≤1 miLoading sold comps…