616 Lease Land Rd · Clyde, TX
Flood risk No data
- FEMA flood zone
- —
- Chance of flooding over 30 yrs
- —
- Est. flood insurance / yr
- —
Fire risk No data
- Est. fire insurance / yr
- —
Heat risk No data
- Hot days now (above threshold)
- —
- Hot days in 30 yrs
- —
Wind risk No data
- Chance of severe wind over 30 yrs
- —
Air-quality risk No data
- Unhealthy air days now
- —
- Unhealthy air days in 30 yrs
- —
Risk factors via First Street. Map © Google.
Why this score? — see what drove the D grade
The composite is a weighted blend of 9 inputs, each scored 0–100. Each bar is that input's sub-score; the figure is the points it added to the 100-point composite (weight × sub-score).
- Cash flow +13.2/30.0
- ARV discount +7.5/15.0
- DSCR +4.0/10.0
- Condition / age +3.8/5.0
- 1% rule +3.7/10.0
- Livability +3.4/5.0
- Schools +3.3/10.0
- Rent growth +2.5/5.0
- Appreciation +0.0/10.0
$99,000
🖨 Deal sheet 📄 Offer letter ✓ Due diligence
Listing remarks
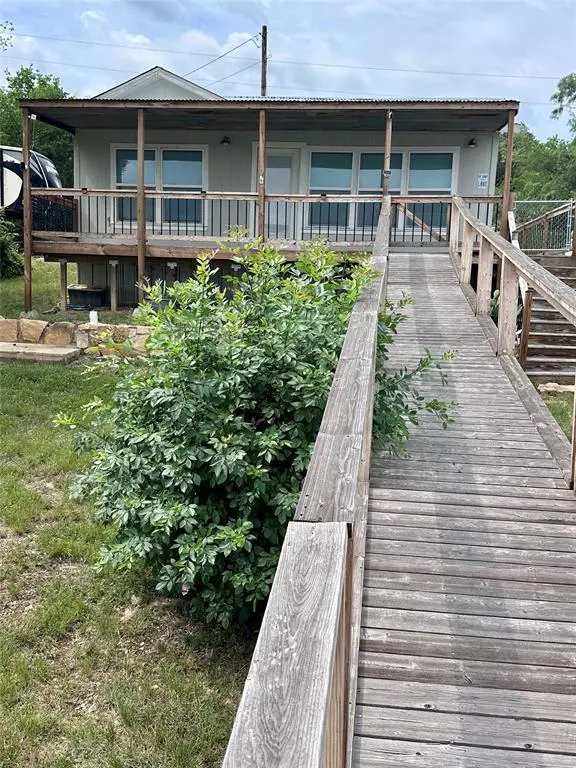
Escape to the perfect fishing getaway with this cozy one bedroom cabin, nestled on a highly sought after fishing lake. This cabin comes fully equipped with a king size bed and frame, a loft with mattress, washer, dryer, refrigerator and stove, making it ideal for weekend getaways or extended stays. Enjoy the convenience of water access with your own boat ramp plus it already has water and electric running along the walkway for easy access or adding a dock. You can spend your days casting a line or sit under the covered patio, do not miss this opportunity call for your showing.
Key facts
- Covered patio
- Fishing lake
- Fishing getaway
Tags
Property features AI
Finance
- Other: Property is lease land; County: Coleman; Located at 616 Lease Land Rd, Clyde, TX
- Financial info: Sale offered for cash or owner carry second
- HOA & community: No homeowners association
Exterior
- Parking: Gravel parking
- Utilities: Septic system; Not in a municipal utility district
- Home design: Single-family residence; One story; Residential property; Built in 2023
- Construction: Frame construction; Metal roof; Pillar/post/pier foundation
- Exterior features: Covered patio/porch; Lakefront property; Boat ramp in the community; Leasehold lot; Electric easement; Lake pump present
Interior
- Kitchen: Electric oven
- Bedrooms: One bedroom on the main level (approx. 9 x 9)
- Flooring: Vinyl flooring
- Bathrooms: One full bathroom
- Heating & cooling: Electric heating; Electric cooling
- Interior features: Loft; Two total rooms (living area plus bedroom); One living area
- Laundry & utility: Stacked washer/dryer area
Neighborhood map
What this means for you Summary
Snapshot
- This is a 1-bed/1.0-bath single-family listed at $99k. Condition is rated good.
Deal economics
- At list price, monthly cash flow is $-1 ($-11/yr) — negative.
- To cash-flow at today's rent, offer at most $99k (0.1% below list).
- To meet the 1% rule (rent ≥ 1% of price), the offer needs to be $86k (12.6% below list).
- Recommended offer: $86k (12.6% below list) — sets the bar for 1% rule.
- Cap rate 6.3% vs local median 3.2% in Clyde — top-decile yield for the area; either an underpriced asset or a hidden risk that comps aren't pricing in. Stress-test before assuming the spread holds.
Location & tenants
- Location reads 68/100 on livability (#498 in TX) — a middle-class / working-renter tenant base. Strengths: crime A+, cost of living A+, housing A+; Watch: employment C-, health & safety D+, amenities F.
- Coleman ISD (town): math 42% / reading 39% proficiency, ranked #439 of 826 in TX (top 53%) — families likely to look elsewhere, expect single-tenant / working-renter base with shorter leases.
- Zoned schools: Coleman El (math 32% / reading 27%, grade F, #2,525 of 4,322 statewide, top 62%, 339 students, 69% FRL).
- Market conditions: 132 active listings in the ZIP; 5 units permitted in Coleman County in 2024 (0 in 5+ unit buildings).
Forward outlook
- Local home prices are declining (-3.0%/yr); year-one equity from $684 of loan paydown is wiped out by about $3k of value loss. Plan a longer hold.
- Coleman County population projected at -28% by 2050 — secular population decline; favor cash flow + early exit over multi-decade hold.
Negotiation context
- It's been on market 19 days — a 2% lower offer ($98k) is reasonable based on typical stale-listing flexibility.
Questions for the listing agent
- What do current leases actually rent for vs. the listed asking? Can we see a recent rent roll and the last 12 months of T-12 income?
- Is there a deadline driving the sale (1031 exchange, divorce, estate, relocation)? That informs how much negotiation room exists.
- The area grade is low — what's the realistic commute time and amenity access for the typical tenant pool here? Any planned neighborhood developments (good or bad) we should know about?
- What's the average days-on-market for RENTAL listings here right now (not sales)? A rising rental-DOM trend means longer vacancies and softer asking-rent achievability than the comps imply.
- What's the recent tenant-quality profile in this submarket — average credit score on applications, eviction rate, late-payment / NSF rate, and stable-employment percentage? A property-management company in the area should have these aggregated.
- How much new for-sale + rental construction is in the pipeline within 1–3 miles? Heavy new supply typically softens prices + rents 12–24 months out; constrained supply supports both.
Investment metrics
- 1% rule
- 0.87% ✗
- Cap rate
- 6.28%
- Cash-on-cash
- -0.04%
- DSCR
- 1.00
- GRM
- 9.5
CMA / ARV
No comps found within radius.
Projected returns pro-forma
-3.0% appreciation · 3.0% rent growth · sell at horizon
- IRR
- -16.4%
- Equity multiple
- 0.42×
- Total profit
- $-16,089
- Equity at exit
- $14,761
- IRR
- -8.1%
- Equity multiple
- 0.49×
- Total profit
- $-14,033
- Equity at exit
- $8,560
Cash invested: $27,720 (down + closing). Projections, not guarantees.
Landlord ↔ Tenant lean methodology
- Overall (STATE)
- 87 Strongly Landlord-Friendly
- State Texas
- 87 Strongly Landlord-Friendly · R+5
- County
- — inherits STATE
- City
- — inherits STATE
ZIP-level market 79510
- Home prices YoY
- -21.6%
- Active inventory
- 132
- Price-to-rent
- 9.5×
Monthly cashflow live
- Estimated rent
- $865 medium interval (Pro) →
- Mortgage (P&I)
- −$519
- Tax est. 1.5%
- −$124 /mo · $1,485/yr
- Insurance
- −$41
- HOA
- −$0
- Vacancy / Maint / Mgmt
- −$182
- Net cashflow
- $-1
Break-even live
UW: 25.0% down · 7.5% · 30yr · 1.5% tax · 5.0% vac · 8.0% maint · 8.0% mgmt
Financing live
Cash to close
- Down payment
- $24,750
- Closing costs
- $2,970
- Reserves months
- —
- Total cash needed
- —
Loan-product check · same deal, 3 products live
Conventional
25% down · 7.5% · 30yr
- Down + closing
- —
- Monthly P&I
- —
- Monthly cashflow
- —
- DSCR
- —
- Eligible?
- —
Personal DTI + credit; lowest rate.
DSCR
20% down · 8.5% · 30yr
- Down + closing
- —
- Monthly P&I
- —
- Monthly cashflow
- —
- DSCR
- —
- Eligible?
- —
No personal income docs; deal must DSCR.
Hard money
10% down · 12.0% · 12mo
- Down + closing
- —
- Monthly P&I
- —
- Monthly cashflow
- —
- DSCR
- —
- Eligible?
- —
Short-term bridge; refi at stabilization.
Listing history 15 events
-
2026-06-18days on market $99,000 Active 19 DOM
-
2026-06-17days on market $99,000 Active 18 DOM
-
2026-06-16days on market $99,000 Active 17 DOM
-
2026-06-15days on market $99,000 Active 16 DOM
-
2026-06-13days on market $99,000 Active 14 DOM
-
2026-06-12days on market $99,000 Active 13 DOM
-
2026-06-09days on market $99,000 Active 10 DOM
-
2026-06-08days on market $99,000 Active 9 DOM
-
2026-06-08days on market $99,000 Active 8 DOM
-
2026-06-07days on market $99,000 Active 7 DOM
-
2026-06-03days on market $99,000 Active 4 DOM
-
2026-06-02days on market $99,000 Active 3 DOM
-
2026-06-01days on market $99,000 Active 2 DOM
-
2026-05-31remarks 583-char remark
-
2026-05-31$99,000 Active 1 DOM
ⓘ Source: listings_history table (triggers on properties + properties_extension) + one-shot
backfill from property_details.listing_events for pre-trigger history.
Nearby sold comps map
Loading sold comps map…
Walkable amenities ~0.75 mi
Loading nearby amenities…
Taxation est. · year 1
- Rental income
- $10,378
- − Mortgage interest
- −$5,546
- − Property taxes
- −$1,485
- − Insurance
- −$495
- − Repairs & maintenance
- −$830
- − Management
- −$830
- − Depreciation
- −$2,880
- Taxable loss
- −$1,688
- Est. tax savings @ 24.0%
- +$405
- After-tax cash flow
- $394/yr
For passive investors: Depreciation is non-cash, so a rental often shows a tax loss while cash-flowing — sheltering income. Rental losses are passive: they offset passive income freely, and up to $25,000/yr can offset ordinary (W-2) income if you actively participate and your MAGI is under $100k (phasing out to $0 by $150k); unused losses carry forward. On sale, claimed depreciation is recaptured at up to 25%, and gains may owe capital-gains tax (a 1031 exchange can defer both). Figures are a year-1 estimate at your 24.0% rate — not tax advice; consult a CPA.
Condition & rehab AI · 13 photos
This cozy one-bedroom cabin is in good condition with modern amenities and a great location by the lake. A fresh coat of paint and some minor maintenance would significantly enhance its curb appeal and value.
Value-add opportunities
- Both Paint the exterior siding — Enhances curb appeal and value
- Both Replace the deck if necessary — Improves safety and adds value
Renovation cost estimate screening
Value-add ROI direction
- Both Paint the exterior siding — Enhances curb appeal and value ↑
- Both Replace the deck if necessary — Improves safety and adds value ↑
ⓘ Cost ranges are severity-bucket heuristics (US national rule-of-thumb). Get contractor quotes + a written scope before underwriting a rehab budget.
Schools (NCES district)
- District
- Coleman ISD
- NCES district ID
- 4814550
- Math proficiency
- 42% ▲ 3.00%
- Reading proficiency
- 39% ▲ 3.00%
- Median HH income
- $31,765
- Composite
- 33.18/100
- National rank
- #5540
- State rank
- #439 of 826 in TX
Livability — Clyde
- Score
- 68/100
- State rank
- #498
- US rank
- #9935
Category grades
Schools grade is shown separately in the Schools card above.
Census & demographics
- Population (ZIP)
- 8,135
Population outlook (Coleman County) Hauer SSP2
- Today (2025)
- 7,321 people
- By 2030
- 6,834 · -6.7%
- By 2040
- 5,968 · -18.5%
- By 2050
- 5,283 · -27.8%
- By 2075
- 4,205 · -42.6%
- By 2100
- 3,405 · -53.5%
Race, ethnicity, and origin ACS 2023
- Neighborhood character
- Predominantly White (79%)
- Race & ethnicity
- White 79% Hispanic / Latino 13% Two or more races 12% Black 2%
- Hispanic origin (detail)
- Mexican 13%
- Common ancestry
- Italian 8% Slovak 3% Serbian 3%
- Foreign-born
- 1% · China
- Languages at home
- 93% English-only · Spanish 5% German/W. Germanic 2%
Political lean MEDSL · Coleman
- 2024 margin
- Solid R (+79.0) · D 10.3% · R 89.3%
- 2008→2024 swing
- -15.1pp toward R · 2008: -64.0pp · 2024: -79.0pp
- All cycles
- 2024: R+79.0 2020: R+77.3 2016: R+76.8 2012: R+73.7 2008: R+64.0
Not yet ingested
- Civics
- —
Market trends
- HPI YoY
- ▼ -51.42%
- Current HPI
- 186.6326
- Rent YoY
- —
- Metro
- —
- State GDP YoY
- ▲ 3.95%
- F500 in state
- 110
Industry mix (Fortune 500 HQ in TX)
| Industry | F500 HQs | Revenue |
|---|---|---|
| Energy | 16 | $1,198B |
|
||
| Technology | 5 | $198B |
|
||
| Engineering / Construction | 4 | $72B |
|
||
| Energy Services | 3 | $60B |
|
||
| Utilities | 3 | $41B |
|
||
| Healthcare | 2 | $330B |
|
||
Price history
1 event — show timeline
- 2026-05-30 Listed $99,000 NTREIS
Cash-flow waterfall
monthlySold comps — $/sqft
last 12 mo · ≤1 miLoading sold comps…