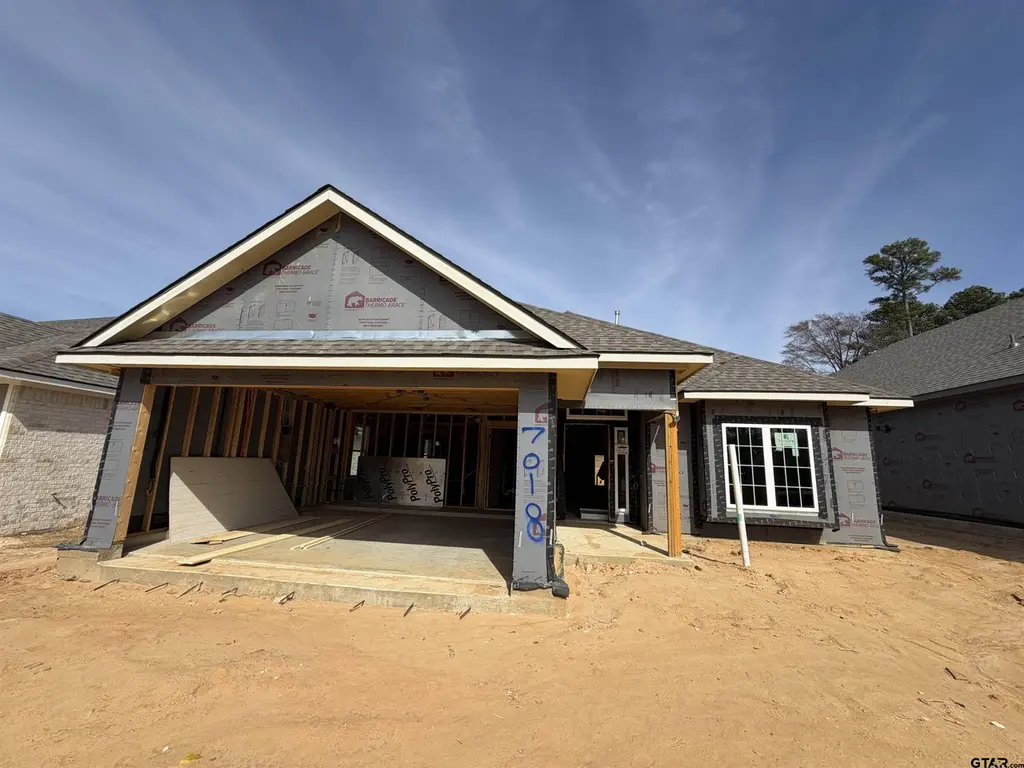
 🏗️ New Construction
7018 Cottage Sq · Tyler, TX
Flood risk 1/10 · Minimal
- FEMA flood zone
- X (unshaded)
- Chance of flooding over 30 yrs
- 0.0%
- Est. flood insurance / yr
- $507 – $1,088
Fire risk 4/10 · Minor
- Est. fire insurance / yr
- $1,222 – $2,270
Heat risk 6/10 · Moderate
- Hot days now (above 109°F)
- 7 days/yr
- Hot days in 30 yrs
- 26 days/yr
Wind risk 6/10 · Moderate
- Chance of severe wind over 30 yrs
- 62.0%
Air-quality risk 2/10 · Minimal
- Unhealthy air days now
- 0 days/yr
- Unhealthy air days in 30 yrs
- 1 days/yr
Risk factors via First Street. Map © Google.
Why this score? — see what drove the F grade
The composite is a weighted blend of 9 inputs, each scored 0–100. Each bar is that input's sub-score; the figure is the points it added to the 100-point composite (weight × sub-score).
- ARV discount +7.5/15.0
- Cash flow +6.3/30.0
- Livability +3.8/5.0
- Schools +3.3/10.0
- Condition / age +2.5/5.0
- Rent growth +2.0/5.0
- 1% rule +1.6/10.0
- DSCR +0.6/10.0
- Appreciation +0.0/10.0
$315,900
🖨 Deal sheet 📄 Offer letter ✓ Due diligence
Listing remarks
This beauty is luxury living with three bedrooms and two baths. This beautiful home features large secondary bedrooms with walk-in closets. Open living, dining, and kitchen provides abundant space without all the cost. The primary bedroom suite is fit for a king sized bed and features a large walk-in closet.
Key facts
- 2 garage spots
- Built 2026
- Listed 19 days
Property features AI
Finance
- Other: Subdivision: Henshaw Creek
- HOA & community: Homeowners association with annual fee of $230 (about $19.17/month)
Exterior
- Parking: 2-car garage
- Security: Smoke detector(s)
- Home design: Single family detached residence; One story
- Construction: Brick and stone construction; Composition roof
- Exterior features: Covered patio/porch; Wood fencing; New construction
Interior
- Kitchen: Dishwasher; Electric oven; Electric range; Microwave; Disposal
- Bathrooms: 2 full bathrooms
- Heating & cooling: Central heating (electric); Central air; Ceiling fan(s)
- Interior features: Walk-in closets; Pantry; Smoke detector(s)
Neighborhood map
What this means for you Summary
Snapshot
- This is a 3-bed/2.0-bath single-family listed at $316k.
Deal economics
- At list price, monthly cash flow is $-652 ($-8k/yr) — negative.
- To cash-flow at today's rent, offer at most $275k (13.1% below list).
- To meet the 1% rule (rent ≥ 1% of price), the offer needs to be $243k (23.2% below list).
- Recommended offer: $243k (23.2% below list) — sets the bar for 1% rule.
Location & tenants
- Location reads 75/100 on livability (#147 in TX, #4,181 nationally) — a middle-class / working-renter tenant base. Strengths: cost of living A+, housing A+, health & safety A+; Watch: employment C-, crime D+, commute F.
- Tyler ISD (urban): math 39% / reading 38% proficiency, ranked #449 of 826 in TX (top 54%) — families likely to look elsewhere, expect single-tenant / working-renter base with shorter leases; 66% free/reduced lunch — lower-income household profile, screen leases tightly.
- Zoned schools: Dr Bryan C Jack El (math 53% / reading 51%, grade C-, #742 of 4,322 statewide, top 19%, 685 students, 46% FRL); Three Lakes Middle (math 35% / reading 42%, grade F, #704 of 1,662 statewide, top 43%, 873 students, 64% FRL); Tyler H S (math 26% / reading 27%, grade F, #1,228 of 1,632 statewide, top 76%, 2,164 students, 90% FRL) — zoned schools at 66% FRL track the district average.
- Market conditions: Rents soft (-1.9%/yr); 649 active listings in the ZIP; 4 comparable units currently listed for rent nearby; rentals lingering (median 44d on market — plan ~5-8 weeks vacancy on turnover, expect pricing pressure); 50% of comp listings sitting > 30 days — soft ceiling on asking rent; solid renter incomes; 595 units permitted in Smith County in 2024 (45 in 5+ unit buildings).
- This rent runs 37% of the median local income ($79k/yr) — at the standard rent-burdened threshold; future hikes will face affordability resistance.
Forward outlook
- Local home prices are declining (-3.0%/yr); year-one equity from $3k of loan paydown is wiped out by about $11k of value loss. Plan a longer hold.
- Smith County population projected at +24% by 2050 — long-run rental-demand tailwind backs the buy-and-hold thesis.
Negotiation context
- It's been on market 19 days — a 2% lower offer ($311k) is reasonable based on typical stale-listing flexibility.
Risks & watch-outs
- Climate carrying-cost: major wind risk, 62% chance of damaging wind over 30y; extreme-heat days projected 7→26/yr by 2055 (HVAC capex compounding) — expect insurance premiums to compound above CPI over the hold.
Questions for the listing agent
- What do current leases actually rent for vs. the listed asking? Can we see a recent rent roll and the last 12 months of T-12 income?
- What does the HOA fee cover, when was the last increase, and are there any pending special assessments or reserve-fund shortfalls?
- Is there a deadline driving the sale (1031 exchange, divorce, estate, relocation)? That informs how much negotiation room exists.
- Schools are D-rated, which usually means shorter tenancies and higher turnover. Who's the typical renter profile here, and what's been the actual vacancy rate?
- Crime grade is D in this area — have there been break-ins, vandalism, or insurance claims at this property in the last 3 years? What carrier currently insures it and at what premium?
- The area grade is low — what's the realistic commute time and amenity access for the typical tenant pool here? Any planned neighborhood developments (good or bad) we should know about?
- What's the average days-on-market for RENTAL listings here right now (not sales)? A rising rental-DOM trend means longer vacancies and softer asking-rent achievability than the comps imply.
- What's the recent tenant-quality profile in this submarket — average credit score on applications, eviction rate, late-payment / NSF rate, and stable-employment percentage? A property-management company in the area should have these aggregated.
- How much new for-sale + rental construction is in the pipeline within 1–3 miles? Heavy new supply typically softens prices + rents 12–24 months out; constrained supply supports both.
Investment metrics
- 1% rule
- 0.66% ✗
- Cap rate
- 4.17%
- Cash-on-cash
- -7.58%
- DSCR
- 0.66
- GRM
- 12.7
CMA / ARV
- ARV (median comp)
- $368,992
- List price
- $315,900
- Delta
- -14.39%
- Verdict
- UNDERPRICED
- Comps
- 4 within 1.0 mi
Projected returns pro-forma
-3.0% appreciation · 0.0% rent growth · sell at horizon
- IRR
- -32.9%
- Equity multiple
- -0.05×
- Total profit
- $-108,401
- Equity at exit
- $55,018
- IRR
- -61.5%
- Equity multiple
- -0.70×
- Total profit
- $-175,174
- Equity at exit
- $31,904
Cash invested: $103,318 (down + closing). Projections, not guarantees.
Landlord ↔ Tenant lean methodology
- Overall (STATE)
- 87 Strongly Landlord-Friendly
- State Texas
- 87 Strongly Landlord-Friendly · R+5
- County
- — inherits STATE
- City
- — inherits STATE
ZIP-level market 75703
- Rents YoY
- -1.9%
- Active inventory
- 649
- Price-to-rent
- 10.9×
Monthly cashflow live
- Estimated rent
- $2,426 medium interval (Pro) →
- Mortgage (P&I)
- −$1,935
- Tax est. 1.5%
- −$461 /mo · $5,535/yr
- Insurance
- −$154
- HOA
- −$19
- Vacancy / Maint / Mgmt
- −$510
- Net cashflow
- $-652
Break-even live
UW: 25.0% down · 7.5% · 30yr · 1.5% tax · 5.0% vac · 8.0% maint · 8.0% mgmt
Financing live
Cash to close
- Down payment
- $92,248
- Closing costs
- $11,070
- Reserves months
- —
- Total cash needed
- —
Loan-product check · same deal, 3 products live
Conventional
25% down · 7.5% · 30yr
- Down + closing
- —
- Monthly P&I
- —
- Monthly cashflow
- —
- DSCR
- —
- Eligible?
- —
Personal DTI + credit; lowest rate.
DSCR
20% down · 8.5% · 30yr
- Down + closing
- —
- Monthly P&I
- —
- Monthly cashflow
- —
- DSCR
- —
- Eligible?
- —
No personal income docs; deal must DSCR.
Hard money
10% down · 12.0% · 12mo
- Down + closing
- —
- Monthly P&I
- —
- Monthly cashflow
- —
- DSCR
- —
- Eligible?
- —
Short-term bridge; refi at stabilization.
Rent comps 4 comps
| Address | Beds | Baths | Sqft | Rent | $/sqft | DOM | Units | Dist |
|---|---|---|---|---|---|---|---|---|
| 2830 W Grande Blvd Tyler, TX | 1.0–3.0 | 1.0–2.0 | 1170 | $2,370 | $2.03 | 13d | 30 | 0.57mi |
| 10801 Harvestwood Dr Tyler, TX | 4.0 | 2.5 | 1964 | $3,750 | $1.91 | 13d | 1 | 1.08mi |
| 6622 Bendale Dr Tyler, TX | 3.0 | 2.0 | 1825 | $2,695 | $1.48 | 43d | 1 | 1.22mi |
| 6618 Bendale Dr Tyler, TX | 3.0 | 2.0 | 1825 | $2,695 | $1.48 | 43d | 1 | 1.23mi |
HOA detail
- Monthly dues
- $19 · $228/yr
Listing history 2 events
-
2026-05-01$315,900 Active 309-char remark
-
2026-02-20$315,900 Active 859-char remark
ⓘ Source: listings_history table (triggers on properties + properties_extension) + one-shot
backfill from property_details.listing_events for pre-trigger history.
Climate risk First Street
- Flood 1/10 Low FEMA zone X (unshaded) · 0% chance over 30 yrs
- Wildfire 4/10 Moderate
- Heat 6/10 Major 7 d/yr ≥109°F today · 26 d/yr by 30 yrs out
- Wind 6/10 Major 62% chance of damaging wind over 30 yrs
- Air quality 2/10 Low 0 unhealthy d/yr today · 1 by 30 yrs out
Nearby sold comps map
Loading sold comps map…
Walkable amenities ~0.75 mi
Loading nearby amenities…
Taxation est. · year 1
- Rental income
- $29,114
- − Mortgage interest
- −$20,669
- − Property taxes
- −$5,535
- − Insurance
- −$1,845
- − Repairs & maintenance
- −$2,329
- − Management
- −$2,329
- − HOA
- −$228
- − Depreciation
- −$10,734
- Taxable loss
- −$14,555
- Est. tax savings @ 24.0%
- +$3,493
- After-tax cash flow
- $-4,335/yr
For passive investors: Depreciation is non-cash, so a rental often shows a tax loss while cash-flowing — sheltering income. Rental losses are passive: they offset passive income freely, and up to $25,000/yr can offset ordinary (W-2) income if you actively participate and your MAGI is under $100k (phasing out to $0 by $150k); unused losses carry forward. On sale, claimed depreciation is recaptured at up to 25%, and gains may owe capital-gains tax (a 1031 exchange can defer both). Figures are a year-1 estimate at your 24.0% rate — not tax advice; consult a CPA.
Schools (NCES district)
- District
- Tyler ISD
- NCES district ID
- 4843470
- Math proficiency
- 39% ▼ -4.00%
- Reading proficiency
- 38% ▼ -1.00%
- Median HH income
- $44,090
- Composite
- 32.69/100
- National rank
- #5650
- State rank
- #449 of 826 in TX
Livability — Tyler
- Score
- 75/100
- State rank
- #147
- US rank
- #4181
Category grades
Schools grade is shown separately in the Schools card above.
Census & demographics
- County
- Smith County · 180,570 people
- City population
- 127,842
- Metro
- Tyler, TX
- Population (ZIP)
- 46,039
- Household income
- $79,194
- Rent vs Own
- Severe rent burden
- 1585.0
Population outlook (Smith County) Hauer SSP2
- Today (2025)
- 248,890 people
- By 2030
- 261,665 · +5.1%
- By 2040
- 286,114 · +15.0%
- By 2050
- 308,006 · +23.8%
- By 2075
- 354,171 · +42.3%
- By 2100
- 372,828 · +49.8%
Race, ethnicity, and origin ACS 2023
- Neighborhood character
- Predominantly White (66%)
- Race & ethnicity
- White 66% Black 17% Hispanic / Latino 10% Two or more races 7% Asian 4%
- Hispanic origin (detail)
- Mexican 8%
- Common ancestry
- Slovak 3% Italian 2% Lithuanian 2%
- Foreign-born
- 7% · Canada, China, Vietnam
- Languages at home
- 89% English-only · Spanish 6% Other Indo-European 1% Tagalog/Filipino 1%
Political lean MEDSL · Smith
- 2024 margin
- Solid R (+45.1) · D 27.0% · R 72.1%
- 2008→2024 swing
- -5.6pp toward R · 2008: -39.5pp · 2024: -45.1pp
- All cycles
- 2024: R+45.1 2020: R+39.4 2016: R+43.9 2012: R+46.9 2008: R+39.5
Not yet ingested
- Civics
- —
Market trends
- HPI YoY
- ▼ -218.79%
- Current HPI
- 182.3842
- Rent YoY
- ▼ -1.95%
- Metro
- Tyler, TX
- State GDP YoY
- ▲ 3.95%
- F500 in state
- 110
Industry mix (Fortune 500 HQ in TX)
| Industry | F500 HQs | Revenue |
|---|---|---|
| Energy | 16 | $1,198B |
|
||
| Technology | 5 | $198B |
|
||
| Engineering / Construction | 4 | $72B |
|
||
| Energy Services | 3 | $60B |
|
||
| Utilities | 3 | $41B |
|
||
| Healthcare | 2 | $330B |
|
||
Price history
2 events — show timeline
- 2026-05-20 Pending — GTAR
- 2026-05-01 Listed $315,900 GTAR
Cash-flow waterfall
monthlySold comps — $/sqft
last 12 mo · ≤1 miLoading sold comps…