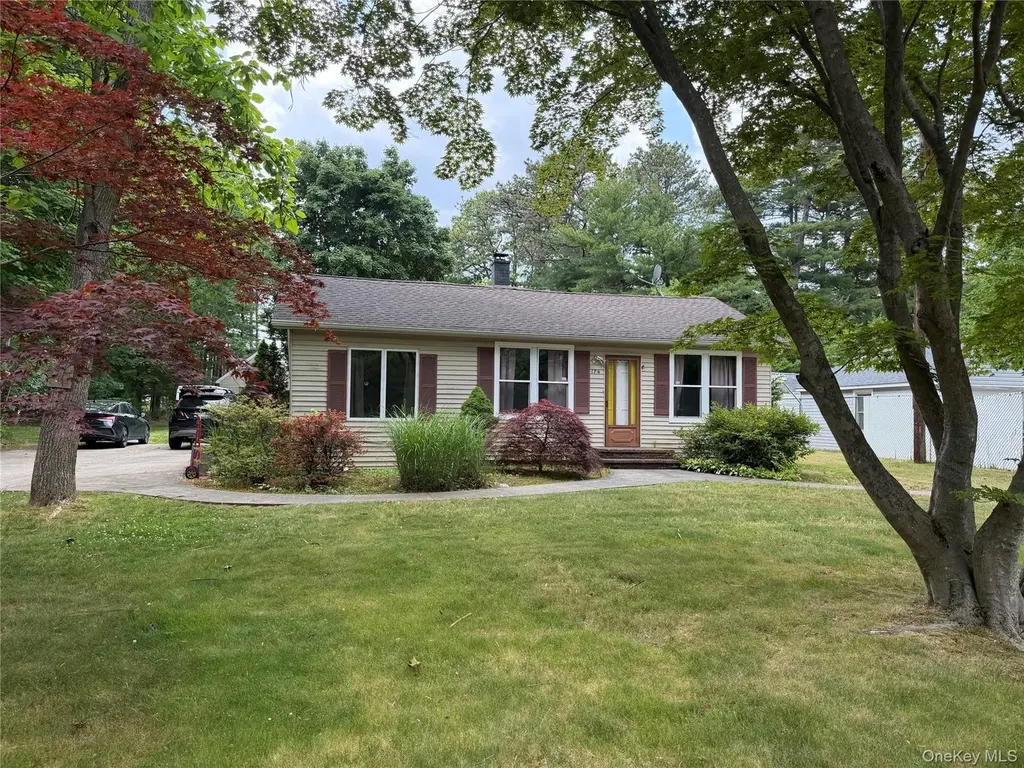
174 Middle Island Rd · Medford, NY
Flood risk 4/10 · Minor
- FEMA flood zone
- X (unshaded)
- Chance of flooding over 30 yrs
- 0.23%
- Est. flood insurance / yr
- $473 – $860
Fire risk 2/10 · Minimal
- Est. fire insurance / yr
- $691 – $1,283
Heat risk 4/10 · Minor
- Hot days now (above 93°F)
- 7 days/yr
- Hot days in 30 yrs
- 18 days/yr
Wind risk 6/10 · Moderate
- Chance of severe wind over 30 yrs
- 75.0%
Air-quality risk 3/10 · Minor
- Unhealthy air days now
- 3 days/yr
- Unhealthy air days in 30 yrs
- 4 days/yr
Risk factors via First Street. Map © Google.
Why this score? — see what drove the D+ grade
The composite is a weighted blend of 9 inputs, each scored 0–100. Each bar is that input's sub-score; the figure is the points it added to the 100-point composite (weight × sub-score).
- ARV discount +15.0/15.0
- Cash flow +11.7/30.0
- Schools +6.7/10.0
- DSCR +3.5/10.0
- Livability +3.5/5.0
- 1% rule +3.3/10.0
- Rent growth +2.5/5.0
- Condition / age +2.5/5.0
- Appreciation +0.0/10.0
$450,000
🖨 Deal sheet 📄 Offer letter ✓ Due diligence
Listing remarks
Welcome to this charming 1940s ranch situated on a spacious . 66-acre lot. Featuring 5 bedrooms and 2 full baths, large detached garage and storage shed, this property offers plenty of space and incredible potential. Perfect for a starter home or investor special, this home is ready for your updates and personal touches. Whether you're looking to renovate, expand, or create your dream home, the possibilities are endless. Enjoy the privacy and flexibility of the generous lot while adding value and making it your own. Conveniently located and full of character, this property is ready for its next chapter. Sold as is.
Key facts
- 0.66 acre lot
- Garage
- Built 1940
Property features AI
Exterior
- Parking: Detached parking; Driveway; 1-car garage
- Utilities: Cesspool sewer; Cable available; Electricity available and connected; Natural gas available; Propane available; Water available and connected
- Home design: Single family residence
- Construction: Frame construction; Vinyl siding
- Exterior features: Frame construction with vinyl siding; Not waterfront
Interior
- Kitchen: Dishwasher; Gas cooktop; Oven; Refrigerator
- Bedrooms: Includes a bedroom on the first floor
- Bathrooms: 2 full bathrooms
- Interior features: First-floor bedroom; First-floor full bathroom; Eat-in kitchen; Washer/dryer hookup; Partial, unfinished basement with storage space; Attic with crawl space and pull-down stairs; 12 total rooms
- Laundry & utility: Dryer; Washer/dryer hookup
Neighborhood map
What this means for you Summary
Snapshot
- This is a 5-bed/2.0-bath single-family listed at $450k.
Deal economics
- At list price, monthly cash flow is $-128 ($-2k/yr) — negative.
- To cash-flow at today's rent, offer at most $427k (5.0% below list).
- To meet the 1% rule (rent ≥ 1% of price), the offer needs to be $376k (16.5% below list).
- Recommended offer: $376k (16.5% below list) — sets the bar for 1% rule.
- Cap rate 6.0% vs local median 3.5% in Medford — top-decile yield for the area; either an underpriced asset or a hidden risk that comps aren't pricing in. Stress-test before assuming the spread holds.
Location & tenants
- Location reads 69/100 on livability (#502 in NY) — a middle-class / working-renter tenant base. Strengths: employment A+, housing A+, health & safety B; Watch: amenities F, commute F, cost of living F.
- Patchogue-Medford Union Free School District (suburban): math 83% / reading 69% proficiency, ranked #73 of 590 in NY (top 12%) — strong family-tenant draw, lease renewals of 3-5y typical.
- Zoned schools: Eagle Elementary School (math 24% / reading 75%, grade D+, #1,057 of 2,108 statewide, top 51%, 603 students, 40% FRL); Oregon Middle School (reading 75%, 592 students, 54% FRL); Patchogue-Medford High School (math 89% / reading 67%, grade A-, #577 of 1,100 statewide, top 52%, 2,443 students, 53% FRL).
- Zoned-school proficiency averages 64% at this address vs 76% district-wide (-12 pts) — the specific schools serving this property underperform the Patchogue-Medford Union Free School District average; the district grade overstates school quality for this exact location.
- Market conditions: 186 active listings in the ZIP; high-income renter base; 1,366 units permitted in Suffolk County in 2024 (216 in 5+ unit buildings).
- This rent runs 37% of the median local income ($121k/yr) — at the standard rent-burdened threshold; future hikes will face affordability resistance.
Forward outlook
- Local home prices are declining (-3.0%/yr); year-one equity from $3k of loan paydown is wiped out by about $14k of value loss. Plan a longer hold.
- Suffolk County population projected to shrink 5% by 2050 — rents likely to lag national; underwrite the cash flow, not the appreciation.
Negotiation context
- Only 4 days on market — expect competitive offers; lowballing is unlikely to land.
Risks & watch-outs
- Watch-outs: built in 1940 — expect roof / HVAC / electrical / plumbing capex.
- Climate carrying-cost: major wind risk, 75% chance of damaging wind over 30y — expect insurance premiums to compound above CPI over the hold.
Questions for the listing agent
- What do current leases actually rent for vs. the listed asking? Can we see a recent rent roll and the last 12 months of T-12 income?
- Built in 1940 — when were the roof, HVAC, electrical panel, plumbing, and water heater last replaced?
- Is there a deadline driving the sale (1031 exchange, divorce, estate, relocation)? That informs how much negotiation room exists.
- The area grade is low — what's the realistic commute time and amenity access for the typical tenant pool here? Any planned neighborhood developments (good or bad) we should know about?
- What's the average days-on-market for RENTAL listings here right now (not sales)? A rising rental-DOM trend means longer vacancies and softer asking-rent achievability than the comps imply.
- What's the recent tenant-quality profile in this submarket — average credit score on applications, eviction rate, late-payment / NSF rate, and stable-employment percentage? A property-management company in the area should have these aggregated.
- How much new for-sale + rental construction is in the pipeline within 1–3 miles? Heavy new supply typically softens prices + rents 12–24 months out; constrained supply supports both.
Investment metrics
- 1% rule
- 0.83% ✗
- Cap rate
- 5.95%
- Cash-on-cash
- -1.22%
- DSCR
- 0.95
- GRM
- 10.0
CMA / ARV
- ARV (on-the-fly)
- $684,648
- Comps found
- 4
Show comp detail 4 sales within ~0.75 mi
| Address | Dist | Beds/Ba | Sqft | Sold | Price | $/sf | Match |
|---|---|---|---|---|---|---|---|
| 3011 Maine Ave | 0.24mi | 4/2.0 (-1) | 1,901 (-8%) | 1mo | $630,000 | $331 | 71 |
| 1600 Fire Ave | 0.43mi | 5/2.0 | 1,973 (-4%) | 4mo | $600,000 | $304 | 70 |
| 1301 Race Ave | 0.32mi | 5/2.0 | 1,920 (-7%) | 7mo | $655,000 | $341 | 68 |
| 15 Bloomington St | 0.74mi | 5/2.5 | 2,192 (+7%) | 16mo | $730,000 | $333 | 39 |
Match score weights: distance 35% · size 25% · config 20% · recency 20%. Top-matched comps best support the ARV.
Projected returns pro-forma
-3.0% appreciation · 3.0% rent growth · sell at horizon
- IRR
- -18.3%
- Equity multiple
- 0.36×
- Total profit
- $-81,037
- Equity at exit
- $67,096
- IRR
- -10.6%
- Equity multiple
- 0.36×
- Total profit
- $-80,884
- Equity at exit
- $38,908
Cash invested: $126,000 (down + closing). Projections, not guarantees.
Landlord ↔ Tenant lean methodology
- Overall (STATE)
- 15 Strongly Tenant-Friendly
- State New York
- 15 Strongly Tenant-Friendly · D+10
- County
- — inherits STATE
- City
- — inherits STATE
ZIP-level market 11763
- Active inventory
- 186
- Price-to-rent
- 10.0×
Monthly cashflow live
- Estimated rent
- $3,757 medium interval (Pro) →
- Mortgage (P&I)
- −$2,360
- Tax from tax record
- −$549 /mo · $6,585/yr
- Insurance
- −$188
- HOA
- −$0
- Vacancy / Maint / Mgmt
- −$789
- Net cashflow
- $-128
Break-even live
UW: 25.0% down · 7.5% · 30yr · 1.5% tax · 5.0% vac · 8.0% maint · 8.0% mgmt
Financing live
Cash to close
- Down payment
- $112,500
- Closing costs
- $13,500
- Reserves months
- —
- Total cash needed
- —
Loan-product check · same deal, 3 products live
Conventional
25% down · 7.5% · 30yr
- Down + closing
- —
- Monthly P&I
- —
- Monthly cashflow
- —
- DSCR
- —
- Eligible?
- —
Personal DTI + credit; lowest rate.
DSCR
20% down · 8.5% · 30yr
- Down + closing
- —
- Monthly P&I
- —
- Monthly cashflow
- —
- DSCR
- —
- Eligible?
- —
No personal income docs; deal must DSCR.
Hard money
10% down · 12.0% · 12mo
- Down + closing
- —
- Monthly P&I
- —
- Monthly cashflow
- —
- DSCR
- —
- Eligible?
- —
Short-term bridge; refi at stabilization.
Listing history 5 events
-
2026-06-18days on market $450,000 Active 4 DOM
-
2026-06-17days on market $450,000 Active 3 DOM
-
2026-06-16days on market $450,000 Active 2 DOM
-
2026-06-15remarks 622-char remark
-
2026-06-15$450,000 Active 1 DOM
ⓘ Source: listings_history table (triggers on properties + properties_extension) + one-shot
backfill from property_details.listing_events for pre-trigger history.
Tax reassessment forecast NY · Partial reset (capped growth)
- Current annual tax
- $6,585 · $549/mo
- Projected year-2 tax
- $7,095 · $591/mo
- Expected delta
- +$510/yr (+$42/mo · 7.7%)
ⓘ Screening estimate from a state-policy table — verify with the county assessor before closing.
Climate risk First Street
- Flood 4/10 Moderate FEMA zone X (unshaded) · 23% chance over 30 yrs
- Wildfire 2/10 Low
- Heat 4/10 Moderate 7 d/yr ≥93°F today · 18 d/yr by 30 yrs out
- Wind 6/10 Major 75% chance of damaging wind over 30 yrs
- Air quality 3/10 Moderate 3 unhealthy d/yr today · 4 by 30 yrs out
Nearby sold comps map
Loading sold comps map…
Walkable amenities ~0.75 mi
Loading nearby amenities…
Taxation est. · year 1
- Rental income
- $45,082
- − Mortgage interest
- −$25,207
- − Property taxes
- −$6,585
- − Insurance
- −$2,250
- − Repairs & maintenance
- −$3,607
- − Management
- −$3,607
- − Depreciation
- −$13,091
- Taxable loss
- −$9,264
- Est. tax savings @ 24.0%
- +$2,223
- After-tax cash flow
- $685/yr
For passive investors: Depreciation is non-cash, so a rental often shows a tax loss while cash-flowing — sheltering income. Rental losses are passive: they offset passive income freely, and up to $25,000/yr can offset ordinary (W-2) income if you actively participate and your MAGI is under $100k (phasing out to $0 by $150k); unused losses carry forward. On sale, claimed depreciation is recaptured at up to 25%, and gains may owe capital-gains tax (a 1031 exchange can defer both). Figures are a year-1 estimate at your 24.0% rate — not tax advice; consult a CPA.
Schools (NCES district)
- District
- Patchogue-Medford Union Free School District
- NCES district ID
- 3622470
- Math proficiency
- 83% ▲ 27.00%
- Reading proficiency
- 69% ▲ 15.00%
- Median HH income
- $75,120
- Composite
- 66.81/100
- National rank
- #405
- State rank
- #73 of 590 in NY
Livability — Medford
- Score
- 69/100
- State rank
- #502
- US rank
- #8793
Category grades
Schools grade is shown separately in the Schools card above.
Census & demographics
- Census place
- Medford, NY
- County
- Suffolk County · 679,920 people
- City population
- 29,973
- Metro
- New York-Newark-Jersey City, NY-NJ-PA
- Population (ZIP)
- 29,973
- Household income
- $120,783
- Rent vs Own
- Severe rent burden
- 339.0
Population outlook (Suffolk County) Hauer SSP2
- Today (2025)
- 1,505,262 people
- By 2030
- 1,498,318 · -0.5%
- By 2040
- 1,471,101 · -2.3%
- By 2050
- 1,424,848 · -5.3%
- By 2075
- 1,337,157 · -11.2%
- By 2100
- 1,217,720 · -19.1%
Race, ethnicity, and origin ACS 2023
- Neighborhood character
- Diverse neighborhood (Simpson 0.61)
- Race & ethnicity
- White 54% Hispanic / Latino 29% Two or more races 14% Black 11% Asian 2%
- Hispanic origin (detail)
- Mexican 3% Puerto Rican 6% Dominican 3%
- Common ancestry
- Romanian 2% Scotch-Irish 2% Hispanic 2%
- Foreign-born
- 17% · Canada, Jamaica
- Languages at home
- 70% English-only · Spanish 23% French/Haitian/Cajun 3% Other Indo-European 2%
Political lean MEDSL · Suffolk
- 2024 margin
- Lean R (+10.0) · D 45.0% · R 55.0%
- 2008→2024 swing
- -16.0pp toward R · 2008: 6.0pp · 2024: -10.0pp
- All cycles
- 2024: R+10.0 2020: R+0.0 2016: R+8.2 2012: D+2.9 2008: D+6.0
Not yet ingested
- Civics
- —
Market trends
- HPI YoY
- ▼ -531.78%
- Current HPI
- 379.1499
- Rent YoY
- —
- Metro
- New York-Newark-Jersey City, NY-NJ-PA
- State GDP YoY
- ▲ 2.60%
- F500 in state
- 92
Industry mix (Fortune 500 HQ in NY)
| Industry | F500 HQs | Revenue |
|---|---|---|
| Financial Services | 10 | $950B |
|
||
| Consumer Goods | 9 | $162B |
|
||
| Insurance | 4 | $225B |
|
||
| Telecommunications | 2 | $144B |
|
||
| Pharmaceuticals | 2 | $112B |
|
||
| Media / Entertainment | 2 | $69B |
|
||
Price history
1 event — show timeline
- 2026-06-14 Listed $450,000 OneKey® MLS as Distributed by MLS Grid
Property tax history
+6.3%/yrLatest (2025): $6,585 · +0.0% YoY. Source: county tax records.
Cash-flow waterfall
monthlySold comps — $/sqft
last 12 mo · ≤1 miLoading sold comps…