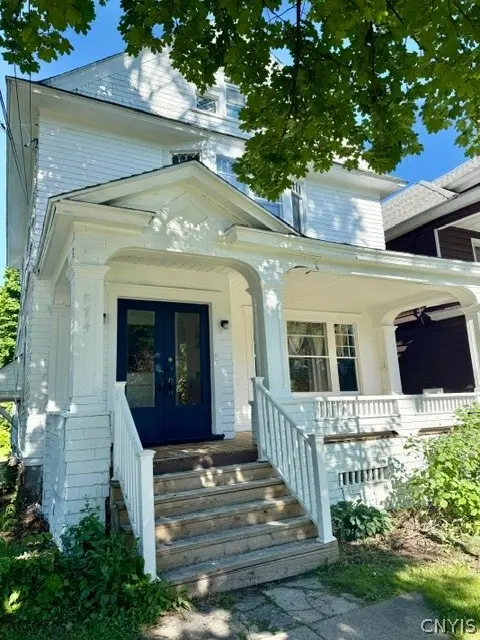
874 Ackerman Ave · Syracuse, NY
Flood risk 1/10 · Minimal
- FEMA flood zone
- X (unshaded)
- Chance of flooding over 30 yrs
- 0.0%
- Est. flood insurance / yr
- $473 – $860
Fire risk 1/10 · Minimal
- Est. fire insurance / yr
- $691 – $1,283
Heat risk 3/10 · Minor
- Hot days now (above 94°F)
- 7 days/yr
- Hot days in 30 yrs
- 16 days/yr
Wind risk 1/10 · Minimal
- Chance of severe wind over 30 yrs
- 1.0%
Air-quality risk 2/10 · Minimal
- Unhealthy air days now
- 0 days/yr
- Unhealthy air days in 30 yrs
- 1 days/yr
Risk factors via First Street. Map © Google.
Why this score? — see what drove the D grade
The composite is a weighted blend of 9 inputs, each scored 0–100. Each bar is that input's sub-score; the figure is the points it added to the 100-point composite (weight × sub-score).
- Cash flow +14.4/30.0
- ARV discount +6.4/15.0
- Rent growth +5.0/5.0
- DSCR +4.4/10.0
- 1% rule +4.0/10.0
- Livability +3.9/5.0
- Condition / age +2.5/5.0
- Schools +1.8/10.0
- Appreciation +0.0/10.0
$350,000
🖨 Deal sheet (PDF) 📄 Offer letter ✓ Due diligence
Listing remarks MLS
University Income Property. 5BR house rented for current AND next year already. Parking, great location- short walk to campus, short walk to all the shops, restaurants and nightlife on Westcott Street. Completely turnkey and profitable from day one!
Key facts
- Eat in dining room
- Onsite parking
- Free washers dryers
Tags
Property features AI
Exterior
- Parking: Detached garage; Driveway; 1 garage space
- Utilities: Public water connected; Sewer connected
- Home design: 2-story house; Existing property condition
- Construction: Aluminum siding; Wood siding; Block foundation
- Exterior features: Near public transit; Rectangular residential lot; City street frontage
Interior
- Kitchen: Free-standing range; Oven; Dishwasher; Refrigerator
- Bedrooms: 1 main-level bedroom
- Flooring: Hardwood floors; Luxury vinyl; Varied flooring
- Bathrooms: 1 full bathroom; 1 half bathroom; Main-level bathroom present
- Heating & cooling: Gas forced-air heating; Has heating
- Interior features: Bedroom on main level; See remarks / other interior features
- Laundry & utility: Washer; Dryer; Main-level laundry
Neighborhood map
What this means for you Summary
Snapshot
- This is a 5-bed/1.5-bath single-family listed at $350k.
Deal economics
- At list price, monthly cash flow is $70 ($844/yr) — positive.
- The deal already cash-flows at list — no discount required.
- To meet the 1% rule (rent ≥ 1% of price), the offer needs to be $315k (10.0% below list).
- Recommended offer: $315k (10.0% below list) — sets the bar for 1% rule.
- Cap rate 6.5% vs local median 8.2% in Syracuse — below-typical yield; the buyer is paying a premium for something (appreciation thesis, condition, location) that the cap rate doesn't capture.
Location & tenants
- Location reads 77/100 on livability (#187 in NY, #2,869 nationally) — a middle-class / working-renter tenant base. Strengths: amenities A+, commute A+, cost of living A+; Watch: crime F, employment D-.
- Syracuse City School District (urban): math 18% / reading 26% proficiency, ranked #590 of 590 in NY (top 100%) — low school quality limits family demand, transient renter base, plan for 1-2y turnover; 74% free/reduced lunch — lower-income household profile, screen leases tightly.
- Zoned schools: Edward Smith K-8 School (math 13% / reading 39%, grade F, #1,816 of 2,108 statewide, top 86%, 710 students, 69% FRL); Expeditionary Learning Middle School (math 17% / reading 32%, grade F, #611 of 729 statewide, top 88%, 170 students, 76% FRL); Nottingham High School (math 75% / reading 77%, grade A-, #616 of 1,100 statewide, top 57%, 1,226 students, 80% FRL) — zoned schools at 75% FRL track the district average.
- Zoned-school proficiency averages 42% at this address vs 22% district-wide (+20 pts) — the actual schools serving this property are materially stronger than the Syracuse City School District average implies; a family-tenant draw the district grade alone would hide.
- Market conditions: Rents rising fast (+11.2%/yr); 58 active listings in the ZIP; 5 comparable units currently listed for rent nearby; rentals at typical pace (median 23d on market — plan ~3-4 weeks tenant-placement turnaround); 40% of comp listings sitting > 30 days — soft ceiling on asking rent; lower-income renter base — watch delinquency; 616 units permitted in Onondaga County in 2024 (256 in 5+ unit buildings).
- At $3,151/mo this rent would consume 91% of the median local household income ($42k/yr) (locally 2307% of renters already pay >50% of income on rent) — very limited rent-growth headroom before tenants either downsize or default.
Forward outlook
- Local home prices are declining (-3.0%/yr); year-one equity from $2k of loan paydown is wiped out by about $10k of value loss. Plan a longer hold.
- Onondaga County population projected to shrink 9% by 2050 — rents likely to lag national; underwrite the cash flow, not the appreciation.
Negotiation context
- It's been on market 19 days — a 2% lower offer ($345k) is reasonable based on typical stale-listing flexibility.
- 2 sale attempts since 7y ago with the ask held roughly flat each time — persistent listings suggest the price (not the market) is what's stuck; bring a comps-based counter.
- Current owner paid $190k; list at $350k implies a 84% gain — meaningful room to come down on a strong offer.
Risks & watch-outs
- Watch-outs: built in 1940 — expect roof / HVAC / electrical / plumbing capex.
Questions for the listing agent
- Built in 1940 — when were the roof, HVAC, electrical panel, plumbing, and water heater last replaced?
- Is there a deadline driving the sale (1031 exchange, divorce, estate, relocation)? That informs how much negotiation room exists.
- Schools are D-rated, which usually means shorter tenancies and higher turnover. Who's the typical renter profile here, and what's been the actual vacancy rate?
- Crime grade is F in this area — have there been break-ins, vandalism, or insurance claims at this property in the last 3 years? What carrier currently insures it and at what premium?
- The area grade is low — what's the realistic commute time and amenity access for the typical tenant pool here? Any planned neighborhood developments (good or bad) we should know about?
- What's the average days-on-market for RENTAL listings here right now (not sales)? A rising rental-DOM trend means longer vacancies and softer asking-rent achievability than the comps imply.
- What's the recent tenant-quality profile in this submarket — average credit score on applications, eviction rate, late-payment / NSF rate, and stable-employment percentage? A property-management company in the area should have these aggregated.
- How much new for-sale + rental construction is in the pipeline within 1–3 miles? Heavy new supply typically softens prices + rents 12–24 months out; constrained supply supports both.
Investment metrics
- 1% rule
- 0.90% ✗
- Cap rate
- 6.53%
- Cash-on-cash
- 0.86%
- DSCR
- 1.04
- GRM
- 9.3
CMA / ARV
- ARV (on-the-fly)
- $341,640
- Comps found
- 12
Show comp detail 12 sales within ~0.75 mi
| Address | Dist | Beds/Ba | Sqft | Sold | Price | $/sf | Match |
|---|---|---|---|---|---|---|---|
| 108 Dorset Rd | 0.14mi | 5/2.5 | 2,416 (+3%) | 13mo | $470,000 | $195 | 73 |
| 109 Avondale Pl | 0.40mi | 4/1.5 (-1) | 2,154 (-8%) | 4mo | $282,500 | $131 | 60 |
| 101 Avondale Pl | 0.38mi | 5/2.5 | 2,000 (-14%) | 2mo | $291,000 | $146 | 53 |
| 603 Allen St | 0.63mi | 4/2.5 (-1) | 2,184 (-7%) | 4mo | $345,000 | $158 | 47 |
| 538 Cumberland Ave | 0.58mi | 4/2.0 (-1) | 2,079 (-11%) | 1mo | $195,000 | $94 | 46 |
| 470 Allen St | 0.73mi | 4/1.5 (-1) | 2,456 (+5%) | 9mo | $340,000 | $138 | 45 |
| 248 Scottholm Ter | 0.74mi | 4/2.0 (-1) | 2,172 (-7%) | 5mo | $323,000 | $149 | 42 |
| 522 Allen St | 0.69mi | 5/2.5 | 2,070 (-12%) | 5mo | $230,000 | $111 | 41 |
| 326 Berkeley Dr | 0.29mi | 6/4.5 (+1) | 2,052 (-12%) | 16mo | $412,000 | $201 | 35 |
| 249 Cambridge St | 0.64mi | 4/1.5 (-1) | 2,016 (-14%) | 11mo | $400,000 | $198 | 33 |
| 244 Scottholm Ter | 0.75mi | 4/3.0 (-1) | 2,150 (-8%) | 10mo | $276,000 | $128 | 32 |
| 228 Cambridge St | 0.65mi | 5/4.0 | 2,584 (+10%) | 13mo | $300,000 | $116 | 31 |
Match score weights: distance 35% · size 25% · config 20% · recency 20%. Top-matched comps best support the ARV.
Projected returns pro-forma
-3.0% appreciation · 8.0% rent growth · sell at horizon
- IRR
- -9.5%
- Equity multiple
- 0.64×
- Total profit
- $-35,539
- Equity at exit
- $52,186
- IRR
- 5.7%
- Equity multiple
- 1.52×
- Total profit
- $50,796
- Equity at exit
- $30,262
Cash invested: $98,000 (down + closing). Projections, not guarantees.
Landlord ↔ Tenant lean methodology
- Overall (STATE)
- 15 Strongly Tenant-Friendly
- State New York
- 15 Strongly Tenant-Friendly · D+10
- County
- — inherits STATE
- City
- — inherits STATE
ZIP-level market 13210
- Home prices YoY
- -9.0%
- Rents YoY
- 11.2%
- Active inventory
- 58
- Price-to-rent
- 9.3×
Monthly cashflow live
- Estimated rent
- $3,151 medium interval (Pro) →
- Mortgage (P&I)
- −$1,835
- Tax est. 1.5%
- −$438 /mo · $5,250/yr
- Insurance
- −$146
- HOA
- −$0
- Vacancy / Maint / Mgmt
- −$662
- Net cashflow
- $70
Break-even live
Sensitivity live
| Price | -10% $312 | -5% $191 | +0% $70 | +5% $-51 | +10% $-172 |
|---|---|---|---|---|---|
| Rent | -10% $-179 | -5% $-54 | +0% $70 | +5% $195 | +10% $319 |
| Rate | -1.0pp $247 | -0.5pp $159 | base $70 | +0.5pp $-20 | +1.0pp $-113 |
UW: 25.0% down · 7.5% · 30yr · 1.5% tax · 5.0% vac · 8.0% maint · 8.0% mgmt
Financing live
Cash to close
- Down payment
- $87,500
- Closing costs
- $10,500
- Reserves months
- —
- Total cash needed
- —
Loan-product check · same deal, 3 products live
Conventional
25% down · 7.5% · 30yr
- Down + closing
- —
- Monthly P&I
- —
- Monthly cashflow
- —
- DSCR
- —
- Eligible?
- —
Personal DTI + credit; lowest rate.
DSCR
20% down · 8.5% · 30yr
- Down + closing
- —
- Monthly P&I
- —
- Monthly cashflow
- —
- DSCR
- —
- Eligible?
- —
No personal income docs; deal must DSCR.
Hard money
10% down · 12.0% · 12mo
- Down + closing
- —
- Monthly P&I
- —
- Monthly cashflow
- —
- DSCR
- —
- Eligible?
- —
Short-term bridge; refi at stabilization.
Rent comps 5 comps
| Address | Beds | Baths | Sqft | Rent | $/sqft | DOM | Units | Dist |
|---|---|---|---|---|---|---|---|---|
| 750 Euclid Ave Syracuse, NY | 5.0 | 2.0 | 2736 | $4,100 | $1.50 | 45d | 1 | 0.22mi |
| 922 Westcott St Syracuse, NY | 4.0 | 2.0 | 1700 | $2,000 | $1.18 | 23d | 1 | 0.25mi |
| 1205 Madison St Fl -1 Syracuse, NY | 4.0 | 3.0 | 2988 | $2,640 | $0.88 | 45d | 1 | 0.83mi |
| 215 Locksley Rd Syracuse, NY | 4.0 | 3.5 | 2352 | $4,300 | $1.83 | 15d | 1 | 1.43mi |
| 269 W Borden Ave Syracuse, NY | 4.0 | 1.5 | 1800 | $650 | $0.36 | 23d | 1 | 1.46mi |
Listing history 14 events
-
2026-06-21days on market $350,000 Active 19 DOM
-
2026-06-18days on market $350,000 Active 16 DOM
-
2026-06-17days on market $350,000 Active 15 DOM
-
2026-06-16days on market $350,000 Active 14 DOM
-
2026-06-15days on market $350,000 Active 13 DOM
-
2026-06-14days on market $350,000 Active 11 DOM
-
2026-06-13days on market $350,000 Active 10 DOM
-
2026-06-10days on market $350,000 Active 8 DOM
-
2026-06-09days on market $350,000 Active 7 DOM
-
2026-06-08days on market $350,000 Active 6 DOM
-
2026-06-07days on market $350,000 Active 5 DOM
-
2026-06-05days on market $350,000 Active 2 DOM
-
2026-06-02remarks 471-char remark
-
2026-06-02$350,000 Active 1 DOM
ⓘ Source: listings_history table (triggers on properties + properties_extension) + one-shot
backfill from property_details.listing_events for pre-trigger history.
Climate risk First Street
- Flood 1/10 Low FEMA zone X (unshaded) · 0% chance over 30 yrs
- Wildfire 1/10 Low
- Heat 3/10 Moderate 7 d/yr ≥94°F today · 16 d/yr by 30 yrs out
- Wind 1/10 Low 100% chance of damaging wind over 30 yrs
- Air quality 2/10 Low 0 unhealthy d/yr today · 1 by 30 yrs out
Nearby sold comps map
Loading sold comps map…
Walkable amenities ~0.75 mi
Loading nearby amenities…
Taxation est. · year 1
- Rental income
- $37,809
- − Mortgage interest
- −$19,605
- − Property taxes
- −$5,250
- − Insurance
- −$1,750
- − Repairs & maintenance
- −$3,025
- − Management
- −$3,025
- − Depreciation
- −$10,182
- Taxable loss
- −$5,028
- Est. tax savings @ 24.0%
- +$1,207
- After-tax cash flow
- $2,050/yr
For passive investors: Depreciation is non-cash, so a rental often shows a tax loss while cash-flowing — sheltering income. Rental losses are passive: they offset passive income freely, and up to $25,000/yr can offset ordinary (W-2) income if you actively participate and your MAGI is under $100k (phasing out to $0 by $150k); unused losses carry forward. On sale, claimed depreciation is recaptured at up to 25%, and gains may owe capital-gains tax (a 1031 exchange can defer both). Figures are a year-1 estimate at your 24.0% rate — not tax advice; consult a CPA.
Schools (NCES district)
- District
- Syracuse City School District
- NCES district ID
- 3628590
- Math proficiency
- 18% ▼ -5.00%
- Reading proficiency
- 26% ▬ 0.00%
- Median HH income
- $32,097
- Composite
- 17.83/100
- National rank
- #9007
- State rank
- #590 of 590 in NY
Livability — Syracuse
- Score
- 77/100
- State rank
- #187
- US rank
- #2869
Category grades
Schools grade is shown separately in the Schools card above.
Census & demographics
- Census place
- Syracuse, NY
- County
- Onondaga County · 247,257 people
- City population
- 152,627
- Metro
- Syracuse, NY
- Population (ZIP)
- 19,803
- Household income
- $41,738
- Rent vs Own
- Severe rent burden
- 2307.0
Population outlook (Onondaga County) Hauer SSP2
- Today (2025)
- 467,894 people
- By 2030
- 463,381 · -1.0%
- By 2040
- 447,697 · -4.3%
- By 2050
- 426,399 · -8.9%
- By 2075
- 373,661 · -20.1%
- By 2100
- 307,967 · -34.2%
Race, ethnicity, and origin ACS 2023
- Neighborhood character
- Diverse neighborhood (Simpson 0.61)
- Race & ethnicity
- White 58% Black 18% Asian 9% Hispanic / Latino 9% Two or more races 8%
- Hispanic origin (detail)
- Puerto Rican 3%
- Common ancestry
- Romanian 3% Lithuanian 3% Italian 2%
- Foreign-born
- 18% · China, Canada, South Korea
- Languages at home
- 78% English-only · Chinese 5% Spanish 4% Other Indo-European 2%
Political lean MEDSL · Onondaga
- 2024 margin
- D (+17.3) · D 58.6% · R 41.4%
- 2008→2024 swing
- -3.0pp toward R · 2008: 20.3pp · 2024: 17.3pp
- All cycles
- 2024: D+17.3 2020: D+20.6 2016: D+12.8 2012: D+21.1 2008: D+20.3
Not yet ingested
- Civics
- —
Market trends
- HPI YoY
- ▼ -37.59%
- Current HPI
- 378.0277
- Rent YoY
- ▲ 11.18%
- Metro
- Syracuse, NY
- State GDP YoY
- ▲ 2.60%
- F500 in state
- 92
Industry mix (Fortune 500 HQ in NY)
| Industry | F500 HQs | Revenue |
|---|---|---|
| Financial Services | 10 | $950B |
|
||
| Consumer Goods | 9 | $162B |
|
||
| Insurance | 4 | $225B |
|
||
| Telecommunications | 2 | $144B |
|
||
| Pharmaceuticals | 2 | $112B |
|
||
| Media / Entertainment | 2 | $69B |
|
||
Price history
+63.2% since first listed5 events — show timeline
- 2026-06-02 Listed $350,000 CNYIS
- 2020-02-13 Sold (MLS) $190,000 CNYIS
- 2019-12-26 Pending — CNYIS
- 2019-11-22 Contingent — CNYIS
- 2019-11-10 Listed $214,500 CNYIS
Cash-flow waterfall
monthlySold comps — $/sqft
last 12 mo · ≤1 miLoading sold comps…