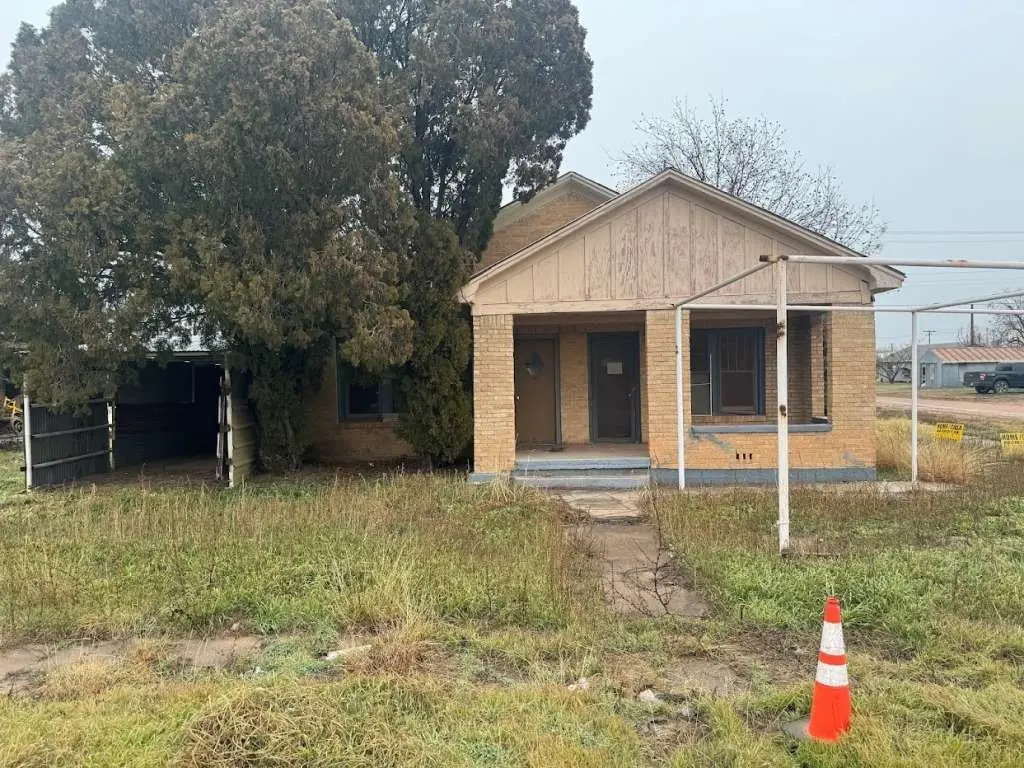
413 N Central Ave · Hamlin, TX
Flood risk 1/10 · Minimal
- FEMA flood zone
- X (unshaded)
- Chance of flooding over 30 yrs
- 0.0%
- Est. flood insurance / yr
- $507 – $1,088
Fire risk 7/10 · Major
- Est. fire insurance / yr
- $1,222 – $2,270
Heat risk 7/10 · Major
- Hot days now (above 106°F)
- 5 days/yr
- Hot days in 30 yrs
- 15 days/yr
Wind risk 3/10 · Minor
- Chance of severe wind over 30 yrs
- 7.0%
Air-quality risk 1/10 · Minimal
- Unhealthy air days now
- 0 days/yr
- Unhealthy air days in 30 yrs
- 0 days/yr
Risk factors via First Street. Map © Google.
Why this score? — see what drove the A- grade
The composite is a weighted blend of 9 inputs, each scored 0–100. Each bar is that input's sub-score; the figure is the points it added to the 100-point composite (weight × sub-score).
- Cash flow +30.0/30.0
- ARV discount +15.0/15.0
- 1% rule +10.0/10.0
- DSCR +10.0/10.0
- Appreciation +7.7/10.0
- Livability +3.2/5.0
- Rent growth +2.5/5.0
- Condition / age +2.5/5.0
- Schools +2.4/10.0
$80,509
🖨 Deal sheet 📄 Offer letter ✓ Due diligence
Listing remarks MLS
HUGE ATTACHED STORAGE AREA! Check out this one-story home in Hamlin, TX. It has an oversized attached storage area for all of your vehicles or other power equipment. It also features 4 bedrooms, 2 bathrooms, and 1200 square feet of living space. Situated conveniently off E Lake Dr, you'll find plenty of nearby shopping stores, gas stations, and eateries. With ample space for family or guests, this home provides both comfort and functionality. Don't miss out!
Key facts
- Ample space
- One-story home
- 6,969 sq ft lot
Tags
Neighborhood map
What this means for you Summary
Snapshot
- This is a 3-bed/1.0-bath single-family listed at $81k.
Deal economics
- At list price, monthly cash flow is $434 ($5k/yr) — positive.
- The deal already cash-flows at list — no discount required.
- Meets the 1% rule at list price ($1k rent vs $81k).
- Recommended offer: $71k (12.0% below list) — sets the bar for market timing.
Location & tenants
- Location reads 64/100 on livability (#747 in TX) — a middle-class / working-renter tenant base. Strengths: cost of living A+, housing A+, crime A-; Watch: health & safety C-, schools F, amenities F.
- Hamlin ISD (rural): math 26% / reading 31% proficiency, ranked #666 of 826 in TX (top 81%) — low school quality limits family demand, transient renter base, plan for 1-2y turnover.
- Market conditions: 15 active listings in the ZIP; 1 units permitted in Jones County in 2024 (0 in 5+ unit buildings).
Forward outlook
- In year one you build about $5k of equity ($557 loan paydown + $4k appreciation (5.4% local appreciation)).
- Jones County population projected at +13% by 2050 — modest demand growth; plan on rents tracking national, not racing it.
- At projected returns (5.4% appreciation + 3.0% rent growth), your $23k cash investment doubles in ~3 years — after that, you're playing with house money.
- By year 7, paydown + projected appreciation supports a ~$32k cash-out refi (75% LTV) — recoverable capital for the next deal without selling this one.
Negotiation context
- It's been on market 641 days — a 12% lower offer ($71k) is reasonable based on typical stale-listing flexibility.
- 2 sale attempts since 2y ago with the ask held roughly flat each time — persistent listings suggest the price (not the market) is what's stuck; bring a comps-based counter.
Risks & watch-outs
- Watch-outs: built in 1940 — expect roof / HVAC / electrical / plumbing capex.
- Climate carrying-cost: major wildfire risk; extreme-heat days projected 5→15/yr by 2055 (HVAC capex compounding) — expect insurance premiums to compound above CPI over the hold.
Questions for the listing agent
- It's been on market 641 days. Have you received any prior offers? Is the seller open to a 12% concession, seller financing, or rate buy-down credit?
- Built in 1940 — when were the roof, HVAC, electrical panel, plumbing, and water heater last replaced?
- Why hasn't it sold? Are there any deal-killer items the seller is aware of (foundation, flood, title, zoning, code violations)?
- Is there a deadline driving the sale (1031 exchange, divorce, estate, relocation)? That informs how much negotiation room exists.
- Schools are F-rated, which usually means shorter tenancies and higher turnover. Who's the typical renter profile here, and what's been the actual vacancy rate?
- What's the average days-on-market for RENTAL listings here right now (not sales)? A rising rental-DOM trend means longer vacancies and softer asking-rent achievability than the comps imply.
- What's the recent tenant-quality profile in this submarket — average credit score on applications, eviction rate, late-payment / NSF rate, and stable-employment percentage? A property-management company in the area should have these aggregated.
- How much new for-sale + rental construction is in the pipeline within 1–3 miles? Heavy new supply typically softens prices + rents 12–24 months out; constrained supply supports both.
Investment metrics
- 1% rule
- 1.60% ✓
- Cap rate
- 12.76%
- Cash-on-cash
- 23.11%
- DSCR
- 2.03
- GRM
- 5.2
CMA / ARV
- ARV (median comp)
- $121,084
- List price
- $80,509
- Delta
- -33.51%
- Verdict
- UNDERPRICED
- Comps
- 20 within 1.0 mi
Show comp detail 4 sales within ~0.75 mi
| Address | Dist | Beds/Ba | Sqft | Sold | Price | $/sf | Match |
|---|---|---|---|---|---|---|---|
| 332 NW Avenue A | 0.11mi | 2/2.0 (-1) | 1,732 (-14%) | 5mo | $149,500 | $86 | 57 |
| 131 Avenue I | 0.66mi | 3/2.0 | 2,231 (+10%) | 4mo | $179,900 | $81 | 45 |
| 312 SW Avenue B | 0.52mi | 3/2.0 | 1,800 (-11%) | 13mo | $80,000 | $44 | 42 |
| 711 NW Avenue I | 0.69mi | 3/2.0 | 2,229 (+10%) | 22mo | $225,000 | $101 | 28 |
Match score weights: distance 35% · size 25% · config 20% · recency 20%. Top-matched comps best support the ARV.
Projected returns pro-forma
5.42% appreciation · 3.0% rent growth · sell at horizon
- IRR
- 33.8%
- Equity multiple
- 3.14×
- Total profit
- $48,180
- Equity at exit
- $47,685
- IRR
- 31.9%
- Equity multiple
- 6.37×
- Total profit
- $120,969
- Equity at exit
- $84,054
Cash invested: $22,543 (down + closing). Projections, not guarantees.
Landlord ↔ Tenant lean methodology
- Overall (STATE)
- 87 Strongly Landlord-Friendly
- State Texas
- 87 Strongly Landlord-Friendly · R+5
- County
- — inherits STATE
- City
- — inherits STATE
ZIP-level market 79520
- Home prices YoY
- 4.6%
- Active inventory
- 15
- Price-to-rent
- 5.2×
Monthly cashflow live
- Estimated rent
- $1,290 medium interval (Pro) →
- Mortgage (P&I)
- −$422
- Tax from tax record
- −$129 /mo · $1,552/yr
- Insurance
- −$34
- HOA
- −$0
- Vacancy / Maint / Mgmt
- −$271
- Net cashflow
- $434
Break-even live
UW: 25.0% down · 7.5% · 30yr · 1.5% tax · 5.0% vac · 8.0% maint · 8.0% mgmt
Financing live
Cash to close
- Down payment
- $20,127
- Closing costs
- $2,415
- Reserves months
- —
- Total cash needed
- —
Loan-product check · same deal, 3 products live
Conventional
25% down · 7.5% · 30yr
- Down + closing
- —
- Monthly P&I
- —
- Monthly cashflow
- —
- DSCR
- —
- Eligible?
- —
Personal DTI + credit; lowest rate.
DSCR
20% down · 8.5% · 30yr
- Down + closing
- —
- Monthly P&I
- —
- Monthly cashflow
- —
- DSCR
- —
- Eligible?
- —
No personal income docs; deal must DSCR.
Hard money
10% down · 12.0% · 12mo
- Down + closing
- —
- Monthly P&I
- —
- Monthly cashflow
- —
- DSCR
- —
- Eligible?
- —
Short-term bridge; refi at stabilization.
Listing history 20 events
-
2026-06-18days on market $80,509 Active 641 DOM
-
2026-06-17days on market $80,509 Active 640 DOM
-
2026-06-16days on market $80,509 Active 639 DOM
-
2026-06-15days on market $80,509 Active 638 DOM
-
2026-06-13days on market $80,509 Active 636 DOM
-
2026-06-12days on market $80,509 Active 635 DOM
-
2026-06-10days on market $80,509 Active 632 DOM
-
2026-06-08days on market $80,509 Active 631 DOM
-
2026-06-08days on market $80,509 Active 630 DOM
-
2026-06-05days on market $80,509 Active 628 DOM
-
2026-06-03days on market $80,509 Active 626 DOM
-
2026-06-02days on market $80,509 Active 625 DOM
-
2026-06-01days on market $80,509 Active 624 DOM
-
2026-05-31days on market $80,509 Active 623 DOM
-
2025-08-28status Active 463-char remark
Show marketing remark (463 chars)
HUGE ATTACHED STORAGE AREA! Check out this one-story home in Hamlin, TX. It has an oversized attached storage area for all of your vehicles or other power equipment. It also features 4 bedrooms, 2 bathrooms, and 1200 square feet of living space. Situated conveniently off E Lake Dr, you'll find plenty of nearby shopping stores, gas stations, and eateries. With ample space for family or guests, this home provides both comfort and functionality. Don't miss out!
-
2025-08-25status Pending 463-char remark
Show marketing remark (463 chars)
HUGE ATTACHED STORAGE AREA! Check out this one-story home in Hamlin, TX. It has an oversized attached storage area for all of your vehicles or other power equipment. It also features 4 bedrooms, 2 bathrooms, and 1200 square feet of living space. Situated conveniently off E Lake Dr, you'll find plenty of nearby shopping stores, gas stations, and eateries. With ample space for family or guests, this home provides both comfort and functionality. Don't miss out!
-
2024-09-12$80,509 Active 463-char remark
Show marketing remark (463 chars)
HUGE ATTACHED STORAGE AREA! Check out this one-story home in Hamlin, TX. It has an oversized attached storage area for all of your vehicles or other power equipment. It also features 4 bedrooms, 2 bathrooms, and 1200 square feet of living space. Situated conveniently off E Lake Dr, you'll find plenty of nearby shopping stores, gas stations, and eateries. With ample space for family or guests, this home provides both comfort and functionality. Don't miss out!
-
2005-01-13soldstatus
-
2003-01-08soldstatus
-
1990-05-22soldstatus
ⓘ Source: listings_history table (triggers on properties + properties_extension) + one-shot
backfill from property_details.listing_events for pre-trigger history.
Tax reassessment forecast TX · Resets to sale price
- Current annual tax
- $1,552 · $129/mo
- Projected year-2 tax
- $1,552 · $129/mo
- Expected delta
- $0/yr ($0/mo · 0.0%)
ⓘ Screening estimate from a state-policy table — verify with the county assessor before closing.
Climate risk First Street
- Flood 1/10 Low FEMA zone X (unshaded) · 0% chance over 30 yrs
- Wildfire 7/10 Severe
- Heat 7/10 Severe 5 d/yr ≥106°F today · 15 d/yr by 30 yrs out
- Wind 3/10 Moderate 7% chance of damaging wind over 30 yrs
- Air quality 1/10 Low 0 unhealthy d/yr today · 0 by 30 yrs out
Nearby sold comps map
Loading sold comps map…
Walkable amenities ~0.75 mi
Loading nearby amenities…
Taxation est. · year 1
- Rental income
- $15,481
- − Mortgage interest
- −$4,510
- − Property taxes
- −$1,552
- − Insurance
- −$403
- − Repairs & maintenance
- −$1,239
- − Management
- −$1,239
- − Depreciation
- −$2,342
- Taxable income
- $4,198
- Est. tax owed @ 24.0%
- −$1,008
- After-tax cash flow
- $4,202/yr
For passive investors: Depreciation is non-cash, so a rental often shows a tax loss while cash-flowing — sheltering income. Rental losses are passive: they offset passive income freely, and up to $25,000/yr can offset ordinary (W-2) income if you actively participate and your MAGI is under $100k (phasing out to $0 by $150k); unused losses carry forward. On sale, claimed depreciation is recaptured at up to 25%, and gains may owe capital-gains tax (a 1031 exchange can defer both). Figures are a year-1 estimate at your 24.0% rate — not tax advice; consult a CPA.
Schools (NCES district)
- District
- Hamlin ISD
- NCES district ID
- 4822260
- Math proficiency
- 26% ▼ -6.00%
- Reading proficiency
- 31% ▼ -11.00%
- Median HH income
- $40,729
- Composite
- 24.06/100
- National rank
- #7763
- State rank
- #666 of 826 in TX
Livability — Hamlin
- Score
- 64/100
- State rank
- #747
- US rank
- #13794
Category grades
Schools grade is shown separately in the Schools card above.
Census & demographics
- Census place
- Hamlin, TX
- City population
- 2,576
- Population (ZIP)
- 2,576
Population outlook (Jones County) Hauer SSP2
- Today (2025)
- 19,845 people
- By 2030
- 20,213 · +1.9%
- By 2040
- 21,446 · +8.1%
- By 2050
- 22,499 · +13.4%
- By 2075
- 23,272 · +17.3%
- By 2100
- 20,420 · +2.9%
Race, ethnicity, and origin ACS 2023
- Neighborhood character
- Majority White (64%)
- Race & ethnicity
- White 64% Hispanic / Latino 32% Two or more races 21% Black 2%
- Hispanic origin (detail)
- Mexican 30% Puerto Rican 1%
- Common ancestry
- Lithuanian 2% Hungarian 1%
- Foreign-born
- 3% · Canada
- Languages at home
- 92% English-only · Spanish 8%
Political lean MEDSL · Jones
- 2024 margin
- Solid R (+73.2) · D 13.1% · R 86.2%
- 2008→2024 swing
- -27.1pp toward R · 2008: -46.1pp · 2024: -73.2pp
- All cycles
- 2024: R+73.2 2020: R+69.1 2016: R+65.4 2012: R+54.5 2008: R+46.1
Not yet ingested
- Civics
- —
Market trends
- HPI YoY
- ▲ 5.42%
- Current HPI
- 123.4254
- Rent YoY
- —
- Metro
- —
- State GDP YoY
- ▲ 3.95%
- F500 in state
- 110
Industry mix (Fortune 500 HQ in TX)
| Industry | F500 HQs | Revenue |
|---|---|---|
| Energy | 16 | $1,198B |
|
||
| Technology | 5 | $198B |
|
||
| Engineering / Construction | 4 | $72B |
|
||
| Energy Services | 3 | $60B |
|
||
| Utilities | 3 | $41B |
|
||
| Healthcare | 2 | $330B |
|
||
Price history
6 events — show timeline
- 2025-08-28 Relisted — HARMLS
- 2025-08-25 Pending — HARMLS
- 2024-09-12 Listed $80,509 HARMLS
- 2005-01-13 Sold (Public Records) — Public Records
- 2003-01-08 Sold (Public Records) — Public Records
- 1990-05-22 Sold (Public Records) — Public Records
Property tax history
+8.2%/yrLatest (2025): $1,552 · -29.1% YoY. Source: county tax records.
Cash-flow waterfall
monthlySold comps — $/sqft
last 12 mo · ≤1 miLoading sold comps…