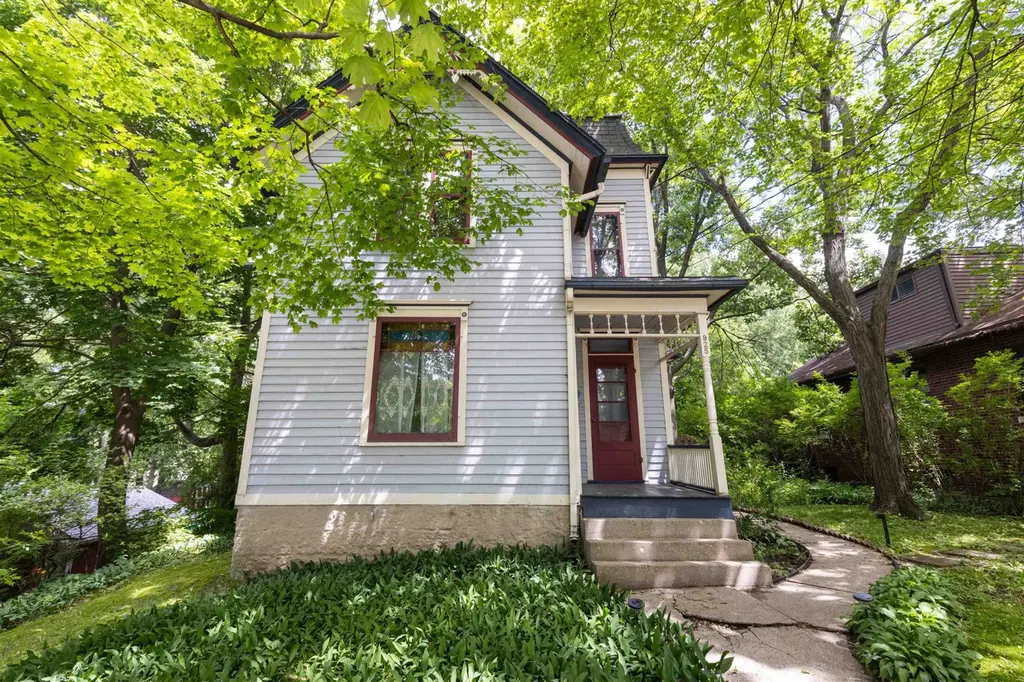
925 C St · Rockford, IL
Flood risk 1/10 · Minimal
- FEMA flood zone
- X (unshaded)
- Chance of flooding over 30 yrs
- 0.0%
- Est. flood insurance / yr
- $473 – $860
Fire risk 1/10 · Minimal
- Est. fire insurance / yr
- $804 – $1,492
Heat risk 2/10 · Minimal
- Hot days now (above 102°F)
- 7 days/yr
- Hot days in 30 yrs
- 14 days/yr
Wind risk 2/10 · Minimal
- Chance of severe wind over 30 yrs
- —
Air-quality risk 2/10 · Minimal
- Unhealthy air days now
- 1 days/yr
- Unhealthy air days in 30 yrs
- 2 days/yr
Risk factors via First Street. Map © Google.
Why this score? — see what drove the C- grade
The composite is a weighted blend of 9 inputs, each scored 0–100. Each bar is that input's sub-score; the figure is the points it added to the 100-point composite (weight × sub-score).
- Cash flow +16.0/30.0
- ARV discount +14.8/15.0
- DSCR +4.9/10.0
- 1% rule +4.4/10.0
- Rent growth +4.0/5.0
- Livability +3.1/5.0
- Condition / age +2.5/5.0
- Schools +1.2/10.0
- Appreciation +0.0/10.0
$159,900
🖨 Deal sheet (PDF) 📄 Offer letter ✓ Due diligence
Listing remarks MLS
Extremely well maintained Victorian in historic district with over 1600 SF. Opportunity to own this beautiful home for less than rent all inclusive. This property has the charm of yesteryear with many modern updates. Granite counter tops and tile backsplash are some of the many improvements in the kitchen. Bathroom has been completely remodeled. 9' ceilings on first floor accompanied by crown molding and original hardwood maple flooring. 1st floor laundry. Master bedroom has cathedral ceilings and new carpet. Private backyard w/ perennials and large patio. Property sold "as is"
Key facts
- Spacious kitchen
- First floor laundry
- Secret room
Tags
Property features AI
Finance
- Other: Property type: Single family residence; Lot size approximately 0.21 acres
- Financial info: Tax annual amount: information not provided
- HOA & community: HOA: information not provided
Exterior
- Parking: Parking: information not provided
- Security: Security: information not provided
- Utilities: Public water; Public sewer
- Home design: Single family residence; 2 stories
- Construction: Construction year: information not provided; Construction materials: information not provided; Foundation: information not provided
- Exterior features: Shingle roof
Interior
- Kitchen: Gas cooktop; Dishwasher; Microwave; Refrigerator
- Bedrooms: Bedrooms: information not provided
- Flooring: Flooring: information not provided
- Bathrooms: 1 full bathroom (main level)
- Heating & cooling: Forced air heating
- Interior features: Gas cooktop; Dishwasher; Microwave; Refrigerator; Gas water heater
- Laundry & utility: Washer; Dryer
Neighborhood map
What this means for you Summary
Snapshot
- This is a 3-bed/1.0-bath single-family listed at $160k.
Deal economics
- At list price, monthly cash flow is $78 ($938/yr) — positive.
- The deal already cash-flows at list — no discount required.
- To meet the 1% rule (rent ≥ 1% of price), the offer needs to be $150k (6.3% below list).
- Recommended offer: $150k (6.3% below list) — sets the bar for 1% rule.
Location & tenants
- Location reads 62/100 on livability (#876 in IL) — a middle-class / working-renter tenant base. Strengths: cost of living A+, housing A+, health & safety A+; Watch: crime F, amenities F, commute F.
- Rockford SD 205 (urban): math 12% / reading 16% proficiency, ranked #533 of 620 in IL (top 86%) — low school quality limits family demand, transient renter base, plan for 1-2y turnover; 73% free/reduced lunch — lower-income household profile, screen leases tightly.
- Zoned schools: C Henry Bloom Elem School (math 12% / reading 8%, grade F, #1,517 of 2,056 statewide, top 78%, 410 students, 0% FRL); Abraham Lincoln Middle School (math 3% / reading 7%, grade F, #636 of 665 statewide, top 98%, 699 students, 0% FRL); Rockford East High School (math 7% / reading 13%, grade F, #528 of 693 statewide, top 82%, 1,718 students, 0% FRL) — zoned schools average 0% FRL vs 73% district-wide (73 pts lower); this property's tenant base skews higher-income than the district average.
- Market conditions: Rents rising fast (+5.9%/yr); 157 active listings in the ZIP; 10 comparable units currently listed for rent nearby; rentals lingering (median 46d on market — plan ~5-8 weeks vacancy on turnover, expect pricing pressure); 60% of comp listings sitting > 30 days — soft ceiling on asking rent; solid renter incomes; 285 units permitted in Winnebago County in 2024 (0 in 5+ unit buildings).
Forward outlook
- Local home prices are declining (-3.0%/yr); year-one equity from $1k of loan paydown is wiped out by about $5k of value loss. Plan a longer hold.
- Winnebago County population projected at -20% by 2050 — secular population decline; favor cash flow + early exit over multi-decade hold.
Negotiation context
- Only 2 days on market — expect competitive offers; lowballing is unlikely to land.
- 3 sale attempts since 6y ago with the ask held roughly flat each time — persistent listings suggest the price (not the market) is what's stuck; bring a comps-based counter.
- Current owner paid $70k; list at $160k implies a 128% gain — meaningful room to come down on a strong offer.
Risks & watch-outs
- Watch-outs: built in 1900 — expect roof / HVAC / electrical / plumbing capex.
Questions for the listing agent
- Built in 1900 — when were the roof, HVAC, electrical panel, plumbing, and water heater last replaced?
- Is there a deadline driving the sale (1031 exchange, divorce, estate, relocation)? That informs how much negotiation room exists.
- Schools are F-rated, which usually means shorter tenancies and higher turnover. Who's the typical renter profile here, and what's been the actual vacancy rate?
- Crime grade is F in this area — have there been break-ins, vandalism, or insurance claims at this property in the last 3 years? What carrier currently insures it and at what premium?
- What's the average days-on-market for RENTAL listings here right now (not sales)? A rising rental-DOM trend means longer vacancies and softer asking-rent achievability than the comps imply.
- What's the recent tenant-quality profile in this submarket — average credit score on applications, eviction rate, late-payment / NSF rate, and stable-employment percentage? A property-management company in the area should have these aggregated.
- How much new for-sale + rental construction is in the pipeline within 1–3 miles? Heavy new supply typically softens prices + rents 12–24 months out; constrained supply supports both.
Investment metrics
- 1% rule
- 0.94% ✗
- Cap rate
- 6.88%
- Cash-on-cash
- 2.09%
- DSCR
- 1.09
- GRM
- 8.9
CMA / ARV
- ARV (on-the-fly)
- $190,995
- Comps found
- 12
Show comp detail 12 sales within ~0.75 mi
| Address | Dist | Beds/Ba | Sqft | Sold | Price | $/sf | Match |
|---|---|---|---|---|---|---|---|
| 1016 B St | 0.10mi | 3/1.5 | 1,590 (-1%) | 4mo | $217,000 | $136 | 88 |
| 634 Rome Ave | 0.62mi | 3/1.0 | 1,568 (-2%) | 0mo | $190,000 | $121 | 67 |
| 314 N London Ave | 0.72mi | 3/1.0 | 1,622 (+1%) | 1mo | $185,000 | $114 | 64 |
| 1508 Rural St | 0.32mi | 3/1.0 | 1,389 (-14%) | 0mo | $165,000 | $119 | 62 |
| 212 N Gardiner Ave | 0.73mi | 3/1.5 | 1,595 (-1%) | 2mo | $105,500 | $66 | 61 |
| 1529 Benton St | 0.59mi | 4/2.0 (+1) | 1,579 (-2%) | 1mo | $193,000 | $122 | 60 |
| 1436 Jackson St | 0.49mi | 3/1.0 | 1,380 (-14%) | 2mo | $120,000 | $87 | 52 |
| 2202 Princeton Ave | 0.55mi | 2/2.0 (-1) | 1,428 (-11%) | 2mo | $205,000 | $144 | 45 |
| 1011 Lundvall Ave | 0.74mi | 3/1.5 | 1,748 (+9%) | 4mo | $219,900 | $126 | 45 |
| 1404 Benton St | 0.58mi | 4/1.5 (+1) | 1,829 (+14%) | 1mo | $107,000 | $59 | 42 |
| 318 Logan St | 0.63mi | 4/1.0 (+1) | 1,384 (-14%) | 2mo | $158,000 | $114 | 41 |
| 1411 Crosby St | 0.67mi | 4/2.0 (+1) | 1,775 (+11%) | 2mo | $120,000 | $68 | 40 |
Match score weights: distance 35% · size 25% · config 20% · recency 20%. Top-matched comps best support the ARV.
Projected returns pro-forma
-3.0% appreciation · 5.92% rent growth · sell at horizon
- IRR
- -9.7%
- Equity multiple
- 0.63×
- Total profit
- $-16,378
- Equity at exit
- $23,842
- IRR
- 3.3%
- Equity multiple
- 1.27×
- Total profit
- $11,984
- Equity at exit
- $13,825
Cash invested: $44,772 (down + closing). Projections, not guarantees.
Landlord ↔ Tenant lean methodology
- Overall (STATE)
- 43 Moderately Tenant-Leaning
- State Illinois
- 43 Moderately Tenant-Leaning · D+7
- County
- — inherits STATE
- City
- — inherits STATE
ZIP-level market 61107
- Home prices YoY
- -20.1%
- Rents YoY
- 5.9%
- Active inventory
- 157
- Price-to-rent
- 8.9×
Monthly cashflow live
- Estimated rent
- $1,499 high interval (Pro) →
- Mortgage (P&I)
- −$839
- Tax from tax record
- −$201 /mo · $2,406/yr
- Insurance
- −$67
- HOA
- −$0
- Vacancy / Maint / Mgmt
- −$315
- Net cashflow
- $78
Break-even live
Sensitivity live
| Price | -10% $169 | -5% $123 | +0% $78 | +5% $33 | +10% $-12 |
|---|---|---|---|---|---|
| Rent | -10% $-40 | -5% $19 | +0% $78 | +5% $137 | +10% $197 |
| Rate | -1.0pp $159 | -0.5pp $119 | base $78 | +0.5pp $37 | +1.0pp $-5 |
UW: 25.0% down · 7.5% · 30yr · 1.5% tax · 5.0% vac · 8.0% maint · 8.0% mgmt
Financing live
Cash to close
- Down payment
- $39,975
- Closing costs
- $4,797
- Reserves months
- —
- Total cash needed
- —
Loan-product check · same deal, 3 products live
Conventional
25% down · 7.5% · 30yr
- Down + closing
- —
- Monthly P&I
- —
- Monthly cashflow
- —
- DSCR
- —
- Eligible?
- —
Personal DTI + credit; lowest rate.
DSCR
20% down · 8.5% · 30yr
- Down + closing
- —
- Monthly P&I
- —
- Monthly cashflow
- —
- DSCR
- —
- Eligible?
- —
No personal income docs; deal must DSCR.
Hard money
10% down · 12.0% · 12mo
- Down + closing
- —
- Monthly P&I
- —
- Monthly cashflow
- —
- DSCR
- —
- Eligible?
- —
Short-term bridge; refi at stabilization.
Rent comps 10 comps
| Address | Beds | Baths | Sqft | Rent | $/sqft | DOM | Units | Dist |
|---|---|---|---|---|---|---|---|---|
| 314 N Longwood St Rockford, IL | 2.0 | 1.0 | 1060 | $1,100 | $1.04 | 45d | 1 | 0.81mi |
| 913 N Main St Rockford, IL | 2.0 | 1.0–2.0 | 1050 | $2,300 | $2.19 | 23d | 1 | 0.83mi |
| 1405 N Court St Unit 1407 Rockford, IL | 2.0 | 1.0 | 1530 | $1,100 | $0.72 | 45d | 1 | 0.93mi |
| 922 N Church St Rockford, IL | 2.0 | 2.0 | 1150 | $1,450 | $1.26 | 45d | 1 | 0.93mi |
| 2021 2nd Ave Rockford, IL | 2.0 | 1.0 | 1250 | $1,000 | $0.80 | 15d | 1 | 1.06mi |
| 333 S Gardiner Ave Unit AVE2 Rockford, IL | 4.0 | 1.0 | 1306 | $1,600 | $1.23 | 45d | 1 | 1.07mi |
| 728 N Winnebago St Rockford, IL | 4.0 | 1.0 | 1250 | $1,600 | $1.28 | 15d | 1 | 1.24mi |
| 2308 Fremont St Rockford, IL | 3.0 | 1.0 | 1320 | $1,600 | $1.21 | 45d | 1 | 1.35mi |
| 2422 Benderwirt Ave Unit 2422-1 Rockford, IL | 2.0 | 1.0 | 1150 | $1,025 | $0.89 | 45d | 1 | 1.46mi |
| 4719 Illinois St Loves Park, IL | 3.0 | 1.0 | 1188 | $1,600 | $1.35 | 15d | 1 | 1.47mi |
Listing history 2 events
-
2026-06-21remarks 689-char remark
-
2026-06-21$159,900 Active 2 DOM
ⓘ Source: listings_history table (triggers on properties + properties_extension) + one-shot
backfill from property_details.listing_events for pre-trigger history.
Tax reassessment forecast IL · Partial reset (capped growth)
- Current annual tax
- $2,406 · $201/mo
- Projected year-2 tax
- $3,018 · $251/mo
- Expected delta
- +$612/yr (+$51/mo · 25.4%)
ⓘ Screening estimate from a state-policy table — verify with the county assessor before closing.
Climate risk First Street
- Flood 1/10 Low FEMA zone X (unshaded) · 0% chance over 30 yrs
- Wildfire 1/10 Low
- Heat 2/10 Low 7 d/yr ≥102°F today · 14 d/yr by 30 yrs out
- Wind 2/10 Low
- Air quality 2/10 Low 1 unhealthy d/yr today · 2 by 30 yrs out
Nearby sold comps map
Loading sold comps map…
Walkable amenities ~0.75 mi
Loading nearby amenities…
Taxation est. · year 1
- Rental income
- $17,982
- − Mortgage interest
- −$8,957
- − Property taxes
- −$2,406
- − Insurance
- −$800
- − Repairs & maintenance
- −$1,439
- − Management
- −$1,439
- − Depreciation
- −$4,652
- Taxable loss
- −$1,709
- Est. tax savings @ 24.0%
- +$410
- After-tax cash flow
- $1,348/yr
For passive investors: Depreciation is non-cash, so a rental often shows a tax loss while cash-flowing — sheltering income. Rental losses are passive: they offset passive income freely, and up to $25,000/yr can offset ordinary (W-2) income if you actively participate and your MAGI is under $100k (phasing out to $0 by $150k); unused losses carry forward. On sale, claimed depreciation is recaptured at up to 25%, and gains may owe capital-gains tax (a 1031 exchange can defer both). Figures are a year-1 estimate at your 24.0% rate — not tax advice; consult a CPA.
Schools (NCES district)
- District
- Rockford SD 205
- NCES district ID
- 1734510
- Math proficiency
- 12% ▼ -2.00%
- Reading proficiency
- 16% ▼ -3.00%
- Median HH income
- $42,533
- Composite
- 12.21/100
- National rank
- #9649
- State rank
- #533 of 620 in IL
Livability — Rockford
- Score
- 62/100
- State rank
- #876
- US rank
- #17035
Category grades
Schools grade is shown separately in the Schools card above.
Census & demographics
- Census place
- Rockford, IL
- County
- Winnebago County · 147,297 people
- City population
- 147,297
- Metro
- Rockford, IL
- Population (ZIP)
- 30,765
- Household income
- $78,574
- Rent vs Own
- Severe rent burden
- 981.0
Population outlook (Winnebago County) Hauer SSP2
- Today (2025)
- 271,080 people
- By 2030
- 260,684 · -3.8%
- By 2040
- 238,405 · -12.1%
- By 2050
- 216,129 · -20.3%
- By 2075
- 172,882 · -36.2%
- By 2100
- 135,336 · -50.1%
Race, ethnicity, and origin ACS 2023
- Neighborhood character
- Predominantly White (68%)
- Race & ethnicity
- White 68% Hispanic / Latino 15% Black 9% Two or more races 9% Asian 4% Native American 1%
- Hispanic origin (detail)
- Mexican 11% Puerto Rican 1%
- Common ancestry
- Romanian 6% Portuguese 4% Lithuanian 2%
- Foreign-born
- 10% · Canada, China
- Languages at home
- 83% English-only · Spanish 11% Arabic 1% Other Indo-European 1%
Political lean MEDSL · Winnebago
- 2024 margin
- Toss-up / Even · D 49.5% · R 49.0% · Other 1.5%
- 2008→2024 swing
- -12.2pp toward R · 2008: 12.8pp · 2024: 0.6pp
- All cycles
- 2024: D+0.6 2020: D+2.5 2016: R+1.2 2012: D+5.7 2008: D+12.8
Not yet ingested
- Civics
- —
Market trends
- HPI YoY
- ▼ -62.46%
- Current HPI
- 248.8598
- Rent YoY
- ▲ 5.92%
- Metro
- Rockford, IL
- State GDP YoY
- ▲ 1.59%
- F500 in state
- 60
Industry mix (Fortune 500 HQ in IL)
| Industry | F500 HQs | Revenue |
|---|---|---|
| Insurance | 4 | $201B |
|
||
| Consumer Goods | 4 | $87B |
|
||
| Industrial Machinery | 3 | $64B |
|
||
| Healthcare | 2 | $55B |
|
||
| Retail / Pharmacy | 1 | $148B |
|
||
| Agriculture / Food | 1 | $86B |
|
||
Price history
+128.4% since first listed7 events — show timeline
- 2026-06-19 Listed $159,900 NWIAR
- 2020-08-14 Sold (Public Records) $70,000 Public Records
- 2020-08-10 Sold (MLS) $70,000 MRED as Distributed by MLS Grid
- 2020-08-10 Sold (MLS) $70,000 NWIAR
- 2020-06-18 Pending — MRED as Distributed by MLS Grid
- 2020-06-17 Listed $70,000 MRED as Distributed by MLS Grid
- 2020-06-17 Listed $70,000 NWIAR
Property tax history
+0.0%/yrLatest (2025): $2,406 · +6.5% YoY. Source: county tax records.
Cash-flow waterfall
monthlySold comps — $/sqft
last 12 mo · ≤1 miLoading sold comps…