 🏷️ Likely Rental
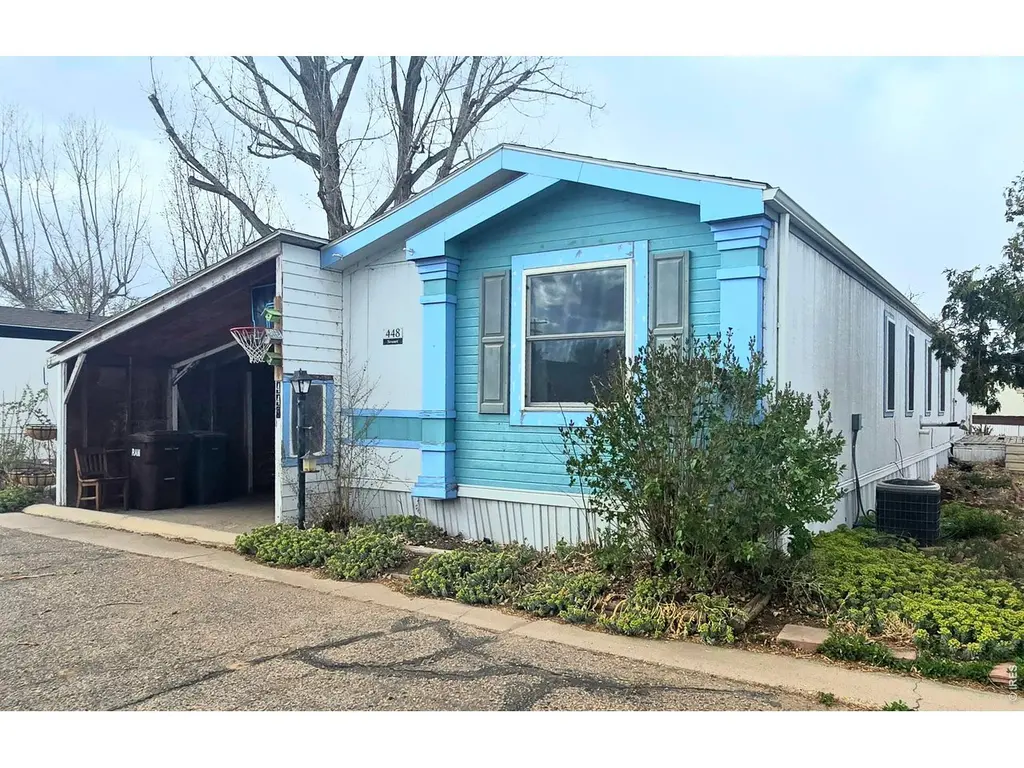
325 E 1st St #448 · Ault, CO
Flood risk 1/10 · Minimal
- FEMA flood zone
- A
- Chance of flooding over 30 yrs
- 0.0%
- Est. flood insurance / yr
- $1,009 – $1,996
Fire risk 1/10 · Minimal
- Est. fire insurance / yr
- $939 – $1,743
Heat risk 3/10 · Minor
- Hot days now (above 93°F)
- 7 days/yr
- Hot days in 30 yrs
- 20 days/yr
Wind risk 2/10 · Minimal
- Chance of severe wind over 30 yrs
- —
Air-quality risk 4/10 · Minor
- Unhealthy air days now
- 7 days/yr
- Unhealthy air days in 30 yrs
- 7 days/yr
Risk factors via First Street. Map © Google.
Why this score? — see what drove the B+ grade
The composite is a weighted blend of 9 inputs, each scored 0–100. Each bar is that input's sub-score; the figure is the points it added to the 100-point composite (weight × sub-score).
- Cash flow +30.0/30.0
- ARV discount +15.0/15.0
- 1% rule +10.0/10.0
- DSCR +10.0/10.0
- Livability +3.1/5.0
- Schools +2.8/10.0
- Rent growth +2.5/5.0
- Condition / age +2.5/5.0
- Appreciation +0.0/10.0
$68,900
🖨 Deal sheet 📄 Offer letter ✓ Due diligence
Listing remarks
Remarkable 3 bedroom, 2 bath Mobile home with a open concept floorplan. It features new windows throughout & Central A/C. It's Full of natural light, and a really cozy layout. Situated in a very nice Mobile Home Park with only $625 monthly lot rent. Straight shot right off Hwy 85 to Ft. Collins, Greeley, and Cheyenne. Some updates have been made, but trailer needs a little work. (some deferred maintenance from age and natural wear and tear, and price reflects that) Sold As Is. Buyer must call park manager, Sergio 970-834-2028 to qualify with 600 credit score, no evictions, no criminal history, & 1-yr at currant job. Sold AS IS. Seller is not able to make any repairs for buyer.
Key facts
- Open floorplan
- Natural light
- New windows
Tags
Property features AI
Finance
- HOA & community: Association covers common amenities and trash
Exterior
- Parking: Carport
- Utilities: City water (meter installed); Natural gas available (Atmos); Electricity available; Cable available; Ram Waste trash service
- Home design: Manufactured in park (mobile home); One story; Tandem garage
- Construction: Metal siding; Composition roof; Crawl space foundation; Built by Palm Harbor
- Exterior features: Deck; Storage structure; Level lot; Minimal flood risk (C rating)
Interior
- Kitchen: Gas range; Dishwasher; Refrigerator
- Bedrooms: 3 bedrooms
- Bathrooms: 2 full bathrooms
- Heating & cooling: Forced air heating; Central air conditioning; Ceiling fans
- Interior features: Eat-in kitchen; Cathedral ceilings; Open floorplan; Walk-in closets; Window coverings; Free-standing fireplace
- Laundry & utility: Washer; Dryer
Neighborhood map
What this means for you Summary
Snapshot
- This is a 3-bed/2.0-bath manufactured listed at $69k.
Deal economics
- At list price, monthly cash flow is $587 ($7k/yr) — positive.
- The deal already cash-flows at list — no discount required.
- Meets the 1% rule at list price ($1k rent vs $69k).
- Recommended offer: $67k (3.0% below list) — sets the bar for market timing.
- Cap rate 18.7% vs local median 1.9% in Ault — top-decile yield for the area; either an underpriced asset or a hidden risk that comps aren't pricing in. Stress-test before assuming the spread holds.
Location & tenants
- Location reads 61/100 on livability (#216 in CO) — a middle-class / working-renter tenant base. Strengths: housing A+, crime B; Watch: amenities F, commute F, health & safety F.
- Weld County School District No. Re-9 (rural): math 25% / reading 30% proficiency, ranked #117 of 176 in CO (top 66%) — low school quality limits family demand, transient renter base, plan for 1-2y turnover.
- Zoned schools: Highland Elementary School (math 10% / reading 34%, grade F, #651 of 966 statewide, top 68%, 473 students, 41% FRL); Highland High School (math 24% / reading 54%, grade F, #176 of 381 statewide, top 49%, 285 students, 38% FRL) — zoned schools at 39% FRL track the district average.
- Market conditions: 45 active listings in the ZIP; 3,170 units permitted in Weld County in 2024 (278 in 5+ unit buildings).
Forward outlook
- Local home prices are declining (-3.0%/yr); year-one equity from $476 of loan paydown is wiped out by about $2k of value loss. Plan a longer hold.
- Weld County population projected at +46% by 2050 — long-run rental-demand tailwind backs the buy-and-hold thesis.
- At projected returns (-3.0% appreciation + 3.0% rent growth), your $19k cash investment doubles in ~4 years — after that, you're playing with house money.
Negotiation context
- It's been on market 39 days — a 3% lower offer ($67k) is reasonable based on typical stale-listing flexibility.
Risks & watch-outs
- Watch-outs: flood insurance adds $125/mo.
- Climate carrying-cost: in FEMA flood zone A (mandatory federal flood insurance) — expect insurance premiums to compound above CPI over the hold.
Questions for the listing agent
- It's been on market 39 days. Have you received any prior offers? Is the seller open to a 3% concession, seller financing, or rate buy-down credit?
- What's the actual annual flood-insurance premium (NFIP or private), and is the property in a SFHA with mandatory coverage?
- Is there a deadline driving the sale (1031 exchange, divorce, estate, relocation)? That informs how much negotiation room exists.
- Schools are D-rated, which usually means shorter tenancies and higher turnover. Who's the typical renter profile here, and what's been the actual vacancy rate?
- What's the average days-on-market for RENTAL listings here right now (not sales)? A rising rental-DOM trend means longer vacancies and softer asking-rent achievability than the comps imply.
- What's the recent tenant-quality profile in this submarket — average credit score on applications, eviction rate, late-payment / NSF rate, and stable-employment percentage? A property-management company in the area should have these aggregated.
- How much new for-sale + rental construction is in the pipeline within 1–3 miles? Heavy new supply typically softens prices + rents 12–24 months out; constrained supply supports both.
Investment metrics
- 1% rule
- 2.07% ✓
- Cap rate
- 18.70%
- Cash-on-cash
- 44.33%
- DSCR
- 2.97
- GRM
- 4.0
CMA / ARV
- ARV (on-the-fly)
- $96,096
- Comps found
- 4
Show comp detail 4 sales within ~0.75 mi
| Address | Dist | Beds/Ba | Sqft | Sold | Price | $/sf | Match |
|---|---|---|---|---|---|---|---|
| 325 E 1st St #442 | 0.03mi | 4/2.0 (+1) | 1,216 (-1%) | 5mo | $42,000 | $35 | 87 |
| 325 E 1st St #456 | 0.03mi | 3/2.0 | 1,140 (-8%) | 14mo | $54,500 | $48 | 74 |
| 325 E 1st St #428 | 0.08mi | 4/2.0 (+1) | 1,216 (-1%) | 21mo | $95,000 | $78 | 72 |
| 316 S 3rd Ave | 0.40mi | 3/2.0 | 1,344 (+9%) | 7mo | $339,900 | $253 | 60 |
Match score weights: distance 35% · size 25% · config 20% · recency 20%. Top-matched comps best support the ARV.
Projected returns pro-forma
-3.0% appreciation · 3.0% rent growth · sell at horizon
- IRR
- 32.4%
- Equity multiple
- 2.36×
- Total profit
- $26,309
- Equity at exit
- $10,273
- IRR
- 39.5%
- Equity multiple
- 4.70×
- Total profit
- $71,331
- Equity at exit
- $5,957
Cash invested: $19,292 (down + closing). Projections, not guarantees.
Landlord ↔ Tenant lean methodology
- Overall (STATE)
- 38 Tenant-Leaning
- State Colorado
- 38 Tenant-Leaning · D+4
- County
- — inherits STATE
- City
- — inherits STATE
ZIP-level market 80610
- Home prices YoY
- -4.9%
- Active inventory
- 45
- Price-to-rent
- 4.0×
Monthly cashflow live
- Estimated rent
- $1,427 medium interval (Pro) →
- Mortgage (P&I)
- −$361
- Tax from tax record
- −$25 /mo · $296/yr
- Insurance
- −$29
- Flood insurance flood zone
- −$125 /mo · $1,502/yr
- HOA
- −$0
- Vacancy / Maint / Mgmt
- −$300
- Net cashflow
- $587
Break-even live
UW: 25.0% down · 7.5% · 30yr · 1.5% tax · 5.0% vac · 8.0% maint · 8.0% mgmt
Financing live
Cash to close
- Down payment
- $17,225
- Closing costs
- $2,067
- Reserves months
- —
- Total cash needed
- —
Loan-product check · same deal, 3 products live
Conventional
25% down · 7.5% · 30yr
- Down + closing
- —
- Monthly P&I
- —
- Monthly cashflow
- —
- DSCR
- —
- Eligible?
- —
Personal DTI + credit; lowest rate.
DSCR
20% down · 8.5% · 30yr
- Down + closing
- —
- Monthly P&I
- —
- Monthly cashflow
- —
- DSCR
- —
- Eligible?
- —
No personal income docs; deal must DSCR.
Hard money
10% down · 12.0% · 12mo
- Down + closing
- —
- Monthly P&I
- —
- Monthly cashflow
- —
- DSCR
- —
- Eligible?
- —
Short-term bridge; refi at stabilization.
Listing history 14 events
-
2026-06-18days on market $68,900 Active 39 DOM
-
2026-06-17days on market $68,900 Active 38 DOM
-
2026-06-16days on market $68,900 Active 37 DOM
-
2026-06-15days on market $68,900 Active 36 DOM
-
2026-06-14days on market $68,900 Active 34 DOM
-
2026-06-10days on market $68,900 Active 31 DOM
-
2026-06-09days on market $68,900 Active 30 DOM
-
2026-06-08days on market $68,900 Active 29 DOM
-
2026-06-07remarks 688-char remark
-
2026-06-07statusdays on market $68,900 Active 28 DOM
-
2026-06-01status $68,900 Pending 27 DOM
-
2026-05-31days on market $68,900 Active 27 DOM
-
2026-05-30days on market $68,900 Active 26 DOM
-
2026-04-08$68,900 Active
ⓘ Source: listings_history table (triggers on properties + properties_extension) + one-shot
backfill from property_details.listing_events for pre-trigger history.
Tax reassessment forecast CO · Resets to sale price
- Current annual tax
- $296 · $25/mo
- Projected year-2 tax
- $379 · $32/mo
- Expected delta
- +$83/yr (+$7/mo · 28.1%)
ⓘ Screening estimate from a state-policy table — verify with the county assessor before closing.
Climate risk First Street
- Flood 1/10 Low FEMA zone A · 0% chance over 30 yrs
- Wildfire 1/10 Low
- Heat 3/10 Moderate 7 d/yr ≥93°F today · 20 d/yr by 30 yrs out
- Wind 2/10 Low
- Air quality 4/10 Moderate 7 unhealthy d/yr today · 7 by 30 yrs out
Nearby sold comps map
Loading sold comps map…
Walkable amenities ~0.75 mi
Loading nearby amenities…
Taxation est. · year 1
- Rental income
- $17,124
- − Mortgage interest
- −$3,859
- − Property taxes
- −$296
- − Insurance
- −$1,847
- − Repairs & maintenance
- −$1,370
- − Management
- −$1,370
- − Depreciation
- −$2,004
- Taxable income
- $6,377
- Est. tax owed @ 24.0%
- −$1,531
- After-tax cash flow
- $5,518/yr
For passive investors: Depreciation is non-cash, so a rental often shows a tax loss while cash-flowing — sheltering income. Rental losses are passive: they offset passive income freely, and up to $25,000/yr can offset ordinary (W-2) income if you actively participate and your MAGI is under $100k (phasing out to $0 by $150k); unused losses carry forward. On sale, claimed depreciation is recaptured at up to 25%, and gains may owe capital-gains tax (a 1031 exchange can defer both). Figures are a year-1 estimate at your 24.0% rate — not tax advice; consult a CPA.
Schools (NCES district)
- District
- Weld County School District No. Re-9
- NCES district ID
- 0802310
- Math proficiency
- 25% ▲ 5.00%
- Reading proficiency
- 30% ▲ 5.00%
- Median HH income
- $55,080
- Composite
- 27.54/100
- National rank
- #12358
- State rank
- #117 of 176 in CO
Livability — Ault
- Score
- 61/100
- State rank
- #216
- US rank
- #17316
Category grades
Schools grade is shown separately in the Schools card above.
Census & demographics
- Census place
- Ault, CO
- Population (ZIP)
- 4,175
Population outlook (Weld County) Hauer SSP2
- Today (2025)
- 351,957 people
- By 2030
- 385,304 · +9.5%
- By 2040
- 451,818 · +28.4%
- By 2050
- 514,478 · +46.2%
- By 2075
- 648,733 · +84.3%
- By 2100
- 720,400 · +104.7%
Race, ethnicity, and origin ACS 2023
- Neighborhood character
- Predominantly White (68%)
- Race & ethnicity
- White 68% Hispanic / Latino 28% Two or more races 10%
- Hispanic origin (detail)
- Mexican 27%
- Common ancestry
- Italian 4% Lithuanian 3% Iranian 2%
- Foreign-born
- 7% · Canada
- Languages at home
- 85% English-only · Spanish 14% Korean 1%
Political lean MEDSL · Weld
- 2024 margin
- Strong R (+21.0) · D 38.2% · R 59.2% · Other 2.6%
- 2008→2024 swing
- -12.2pp toward R · 2008: -8.7pp · 2024: -21.0pp
- All cycles
- 2024: R+21.0 2020: R+18.0 2016: R+22.4 2012: R+13.2 2008: R+8.7
Not yet ingested
- Civics
- —
Market trends
- HPI YoY
- ▼ -17.81%
- Current HPI
- 342.8986
- Rent YoY
- —
- Metro
- —
- State GDP YoY
- ▲ 1.95%
- F500 in state
- 14
Industry mix (Fortune 500 HQ in CO)
| Industry | F500 HQs | Revenue |
|---|---|---|
| Technology Distribution | 1 | $31B |
|
||
| Food / Agriculture | 1 | $18B |
|
||
| Packaging | 1 | $14B |
|
||
| Healthcare | 1 | $13B |
|
||
| Energy | 1 | $10B |
|
||
| Technology | 1 | $4B |
|
||
Price history
1 event — show timeline
- 2026-04-08 Listed $68,900 IRES
Property tax history
+13.4%/yrLatest (2025): $296 · +239.9% YoY. Source: county tax records.
Cash-flow waterfall
monthlySold comps — $/sqft
last 12 mo · ≤1 miLoading sold comps…