219 Lowell Ave · Providence, RI
Flood risk 1/10 · Minimal
- FEMA flood zone
- X (unshaded)
- Chance of flooding over 30 yrs
- 0.0%
- Est. flood insurance / yr
- $473 – $860
Fire risk 1/10 · Minimal
- Est. fire insurance / yr
- $835 – $1,551
Heat risk 5/10 · Moderate
- Hot days now (above 96°F)
- 7 days/yr
- Hot days in 30 yrs
- 15 days/yr
Wind risk 6/10 · Moderate
- Chance of severe wind over 30 yrs
- 71.0%
Air-quality risk 2/10 · Minimal
- Unhealthy air days now
- 1 days/yr
- Unhealthy air days in 30 yrs
- 2 days/yr
Risk factors via First Street. Map © Google.
Why this score? — see what drove the D grade
The composite is a weighted blend of 9 inputs, each scored 0–100. Each bar is that input's sub-score; the figure is the points it added to the 100-point composite (weight × sub-score).
- ARV discount +15.0/15.0
- Cash flow +11.7/30.0
- Livability +4.2/5.0
- DSCR +3.4/10.0
- Rent growth +3.4/5.0
- 1% rule +2.6/10.0
- Condition / age +2.5/5.0
- Schools +1.0/10.0
- Appreciation +0.0/10.0
$369,900
🖨 Deal sheet (PDF) 📄 Offer letter ✓ Due diligence
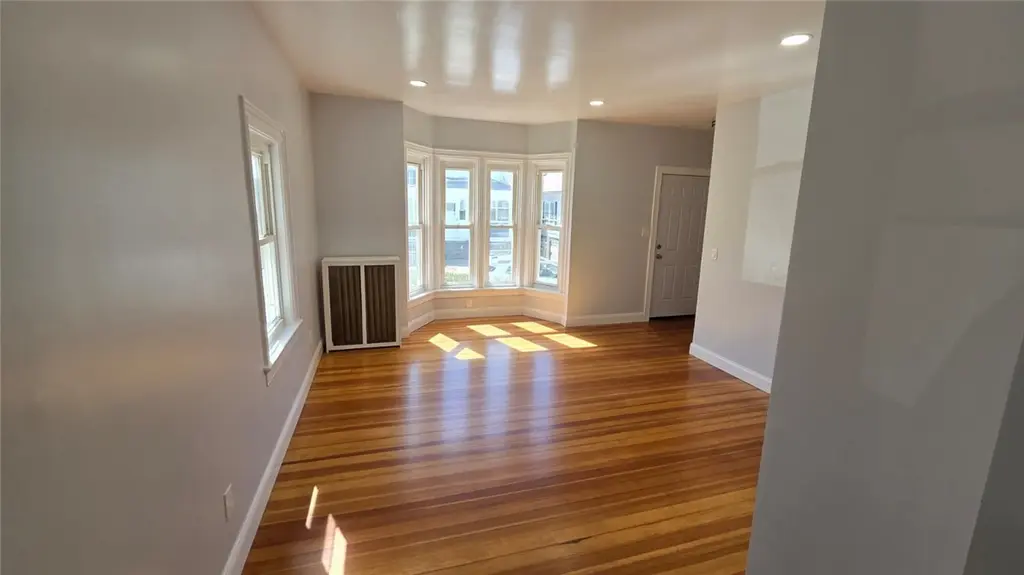
Listing remarks
Welcome to this beautifully updated single-family home offering the perfect blend of modern finishes and functional living. Completely renovated from top to bottom, this turnkey property features a brand new kitchen with modern cabinetry, quartz countertops, and stainless steel appliances, an updated bathroom with stylish tile finishes, new flooring throughout, fresh interior and exterior updates, and a new roof. Enjoy a spacious 4-bedroom layout with bright, open living spaces filled with natural light, plus a new asphalt driveway to be completed this month. Perfect for first-time buyers, growing families, or anyone seeking a low-maintenance, move-in ready home. Conveniently located near h
Key facts
- Quartz countertops
- New flooring
- Updated kitchen
Tags
Property features AI
Finance
- HOA & community: Quarterly association fees
Exterior
- Parking: Five covered parking spaces; No garage
- Utilities: 200+ amp electrical service; Public water; Public sewer
- Home design: 2-story property; Above-grade finished living area plus additional finished space below grade
- Construction: Drywall interior; Aluminum siding; Vinyl siding
- Exterior features: Located near highways, schools, and recreation areas
Interior
- Flooring: Ceramic tile; Laminate
- Bathrooms: 1 full bathroom
- Heating & cooling: Gas heating with baseboard units; Window cooling units
- Interior features: Full, unfinished basement with both interior and exterior entry
- Laundry & utility: Gas water heater
Neighborhood map
What this means for you Summary
Snapshot
- This is a 4-bed/1.0-bath single-family listed at $370k.
Deal economics
- At list price, monthly cash flow is $-112 ($-1k/yr) — negative.
- To cash-flow at today's rent, offer at most $350k (5.3% below list).
- To meet the 1% rule (rent ≥ 1% of price), the offer needs to be $280k (24.4% below list).
- Recommended offer: $280k (24.4% below list) — sets the bar for 1% rule.
- Cap rate 5.9% vs local median 4.0% in Providence — top-decile yield for the area; either an underpriced asset or a hidden risk that comps aren't pricing in. Stress-test before assuming the spread holds.
Location & tenants
- Location reads 84/100 on livability (#2 in RI, #794 nationally) — a professional / high-income tenant draw. Strengths: amenities A+, commute A+, housing A+; Watch: employment C-.
- Providence (urban): math 8% / reading 16% proficiency, ranked #34 of 39 in RI (top 87%) — low school quality limits family demand, transient renter base, plan for 1-2y turnover; 79% free/reduced lunch — lower-income household profile, screen leases tightly.
- Zoned schools: George J. West El. School (math 7% / reading 13%, grade F, #148 of 167 statewide, top 90%, 601 students, 84% FRL); Nathanael Greene Middle (math 10% / reading 23%, grade F, #37 of 57 statewide, top 64%, 808 students, 85% FRL); Central High School (math 2% / reading 12%, grade F, #53 of 58 statewide, top 96%, 1,302 students, 87% FRL).
- Market conditions: Rents rising (+3.7%/yr); 133 active listings in the ZIP; 5 comparable units currently listed for rent nearby; rentals at typical pace (median 26d on market — plan ~3-4 weeks tenant-placement turnaround); 776 units permitted in Providence County in 2024 (229 in 5+ unit buildings).
- At $2,796/mo this rent would consume 52% of the median local household income ($65k/yr) (locally 2000% of renters already pay >50% of income on rent) — very limited rent-growth headroom before tenants either downsize or default.
Forward outlook
- Local home prices are declining (-3.0%/yr); year-one equity from $3k of loan paydown is wiped out by about $11k of value loss. Plan a longer hold.
- Providence County population projected at +5% by 2050 — modest demand growth; plan on rents tracking national, not racing it.
Negotiation context
- It's been on market 25 days — a 2% lower offer ($364k) is reasonable based on typical stale-listing flexibility.
- Current owner paid $260k; 42% above their basis — modest negotiation headroom, anchor on the comps not their cost.
Risks & watch-outs
- Watch-outs: built in 1930 — expect roof / HVAC / electrical / plumbing capex.
- Climate carrying-cost: major wind risk, 71% chance of damaging wind over 30y; extreme-heat days projected 7→15/yr by 2055 (HVAC capex compounding) — expect insurance premiums to compound above CPI over the hold.
Questions for the listing agent
- What do current leases actually rent for vs. the listed asking? Can we see a recent rent roll and the last 12 months of T-12 income?
- Built in 1930 — when were the roof, HVAC, electrical panel, plumbing, and water heater last replaced?
- Is there a deadline driving the sale (1031 exchange, divorce, estate, relocation)? That informs how much negotiation room exists.
- Schools are F-rated, which usually means shorter tenancies and higher turnover. Who's the typical renter profile here, and what's been the actual vacancy rate?
- The area grade is low — what's the realistic commute time and amenity access for the typical tenant pool here? Any planned neighborhood developments (good or bad) we should know about?
- What's the average days-on-market for RENTAL listings here right now (not sales)? A rising rental-DOM trend means longer vacancies and softer asking-rent achievability than the comps imply.
- What's the recent tenant-quality profile in this submarket — average credit score on applications, eviction rate, late-payment / NSF rate, and stable-employment percentage? A property-management company in the area should have these aggregated.
- How much new for-sale + rental construction is in the pipeline within 1–3 miles? Heavy new supply typically softens prices + rents 12–24 months out; constrained supply supports both.
Investment metrics
- 1% rule
- 0.76% ✗
- Cap rate
- 5.93%
- Cash-on-cash
- -1.29%
- DSCR
- 0.94
- GRM
- 11.0
CMA / ARV
- ARV (median comp)
- $453,193
- List price
- $369,900
- Delta
- -18.38%
- Verdict
- UNDERPRICED
- Comps
- 20 within 1.0 mi
Show comp detail 1 sale within ~0.75 mi
| Address | Dist | Beds/Ba | Sqft | Sold | Price | $/sf | Match |
|---|---|---|---|---|---|---|---|
| 55 Paolino St | 0.64mi | 3/1.5 (-1) | 1,528 (+13%) | 22mo | $425,000 | $278 | 23 |
Match score weights: distance 35% · size 25% · config 20% · recency 20%. Top-matched comps best support the ARV.
Projected returns pro-forma
-3.0% appreciation · 3.68% rent growth · sell at horizon
- IRR
- -17.8%
- Equity multiple
- 0.37×
- Total profit
- $-65,220
- Equity at exit
- $55,153
- IRR
- -8.8%
- Equity multiple
- 0.44×
- Total profit
- $-58,344
- Equity at exit
- $31,982
Cash invested: $103,572 (down + closing). Projections, not guarantees.
Landlord ↔ Tenant lean methodology
- Overall (STATE)
- 31 Tenant-Leaning
- State Rhode Island
- 31 Tenant-Leaning · D+8
- County
- — inherits STATE
- City
- — inherits STATE
ZIP-level market 02909
- Home prices YoY
- -13.3%
- Rents YoY
- 3.7%
- Active inventory
- 133
- Price-to-rent
- 11.0×
Monthly cashflow live
- Estimated rent
- $2,796 high interval (Pro) →
- Mortgage (P&I)
- −$1,940
- Tax from tax record
- −$226 /mo · $2,718/yr
- Insurance
- −$154
- HOA
- −$0
- Vacancy / Maint / Mgmt
- −$587
- Net cashflow
- $-112
Break-even live
Sensitivity live
| Price | -10% $98 | -5% $-7 | +0% $-112 | +5% $-216 | +10% $-321 |
|---|---|---|---|---|---|
| Rent | -10% $-332 | -5% $-222 | +0% $-112 | +5% $-1 | +10% $109 |
| Rate | -1.0pp $75 | -0.5pp $-17 | base $-112 | +0.5pp $-207 | +1.0pp $-305 |
UW: 25.0% down · 7.5% · 30yr · 1.5% tax · 5.0% vac · 8.0% maint · 8.0% mgmt
Financing live
Cash to close
- Down payment
- $92,475
- Closing costs
- $11,097
- Reserves months
- —
- Total cash needed
- —
Loan-product check · same deal, 3 products live
Conventional
25% down · 7.5% · 30yr
- Down + closing
- —
- Monthly P&I
- —
- Monthly cashflow
- —
- DSCR
- —
- Eligible?
- —
Personal DTI + credit; lowest rate.
DSCR
20% down · 8.5% · 30yr
- Down + closing
- —
- Monthly P&I
- —
- Monthly cashflow
- —
- DSCR
- —
- Eligible?
- —
No personal income docs; deal must DSCR.
Hard money
10% down · 12.0% · 12mo
- Down + closing
- —
- Monthly P&I
- —
- Monthly cashflow
- —
- DSCR
- —
- Eligible?
- —
Short-term bridge; refi at stabilization.
Rent comps 5 comps
| Address | Beds | Baths | Sqft | Rent | $/sqft | DOM | Units | Dist |
|---|---|---|---|---|---|---|---|---|
| 29 Dunford St Unit 2 Providence, RI | 3.0 | 2.0 | 1116 | $2,400 | $2.15 | 25d | 1 | 0.50mi |
| 1035 Atwells Ave Unit 2 Providence, RI | 4.0 | 2.0 | 1300 | $2,950 | $2.27 | 25d | 1 | 0.80mi |
| 216 Maplewood Ave Cranston, RI | 3.0 | 1.5 | 1850 | $2,200 | $1.19 | 45d | 1 | 0.95mi |
| 610 Killingly St #1 Johnston, RI | 4.0 | 2.0 | 1800 | $2,850 | $1.58 | 16d | 1 | 1.13mi |
| 8 Anthony Ave Unit 1 Providence, RI | 3.0 | 2.0 | 1400 | $2,800 | $2.00 | 16d | 1 | 1.47mi |
Listing history 9 events
-
2026-06-08statusdays on market $369,900 Pending 25 DOM
-
2026-06-07days on market $369,900 Active 24 DOM
-
2026-06-05days on market $369,900 Active 21 DOM
-
2026-06-03days on market $369,900 Active 20 DOM
-
2026-06-02days on market $369,900 Active 19 DOM
-
2026-06-01days on market $369,900 Active 18 DOM
-
2026-05-31days on market $369,900 Active 17 DOM
-
2026-05-14$369,900 Active 804-char remark
-
2026-02-20soldstatus $260,000
ⓘ Source: listings_history table (triggers on properties + properties_extension) + one-shot
backfill from property_details.listing_events for pre-trigger history.
Tax reassessment forecast RI · Partial reset (capped growth)
- Current annual tax
- $2,718 · $226/mo
- Projected year-2 tax
- $4,374 · $364/mo
- Expected delta
- +$1,656/yr (+$138/mo · 60.9%)
ⓘ Screening estimate from a state-policy table — verify with the county assessor before closing.
Climate risk First Street
- Flood 1/10 Low FEMA zone X (unshaded) · 0% chance over 30 yrs
- Wildfire 1/10 Low
- Heat 5/10 Major 7 d/yr ≥96°F today · 15 d/yr by 30 yrs out
- Wind 6/10 Major 71% chance of damaging wind over 30 yrs
- Air quality 2/10 Low 1 unhealthy d/yr today · 2 by 30 yrs out
Nearby sold comps map
Loading sold comps map…
Walkable amenities ~0.75 mi
Loading nearby amenities…
Taxation est. · year 1
- Rental income
- $33,553
- − Mortgage interest
- −$20,720
- − Property taxes
- −$2,718
- − Insurance
- −$1,850
- − Repairs & maintenance
- −$2,684
- − Management
- −$2,684
- − Depreciation
- −$10,761
- Taxable loss
- −$7,864
- Est. tax savings @ 24.0%
- +$1,887
- After-tax cash flow
- $549/yr
For passive investors: Depreciation is non-cash, so a rental often shows a tax loss while cash-flowing — sheltering income. Rental losses are passive: they offset passive income freely, and up to $25,000/yr can offset ordinary (W-2) income if you actively participate and your MAGI is under $100k (phasing out to $0 by $150k); unused losses carry forward. On sale, claimed depreciation is recaptured at up to 25%, and gains may owe capital-gains tax (a 1031 exchange can defer both). Figures are a year-1 estimate at your 24.0% rate — not tax advice; consult a CPA.
Schools (NCES district)
- District
- Providence
- NCES district ID
- 4400900
- Math proficiency
- 8% ▼ -4.00%
- Reading proficiency
- 16% ▼ -2.00%
- Median HH income
- $38,197
- Composite
- 10.12/100
- National rank
- #9803
- State rank
- #34 of 39 in RI
Livability — Providence
- Score
- 84/100
- State rank
- #2
- US rank
- #794
Category grades
Schools grade is shown separately in the Schools card above.
Census & demographics
- Census place
- Providence, RI
- County
- Providence County · 548,917 people
- City population
- 212,734
- Metro
- Providence-Warwick, RI-MA
- Population (ZIP)
- 46,014
- Household income
- $64,649
- Rent vs Own
- Severe rent burden
- 2000.0
Population outlook (Providence County) Hauer SSP2
- Today (2025)
- 653,469 people
- By 2030
- 660,819 · +1.1%
- By 2040
- 672,747 · +3.0%
- By 2050
- 683,741 · +4.6%
- By 2075
- 720,435 · +10.2%
- By 2100
- 741,582 · +13.5%
Race, ethnicity, and origin ACS 2023
- Neighborhood character
- Diverse neighborhood (Simpson 0.57)
- Race & ethnicity
- Hispanic / Latino 60% Two or more races 23% White 22% Black 12% Asian 2% Native American 2%
- Hispanic origin (detail)
- Puerto Rican 12% Dominican 23%
- Common ancestry
- Lithuanian 2% Russian 1% Romanian 1%
- Foreign-born
- 35% · Canada, Jamaica
- Languages at home
- 43% English-only · Spanish 50% Other Indo-European 2% Other Asian/Pacific 1%
Political lean MEDSL · Providence
- 2024 margin
- D (+14.4) · D 56.1% · R 41.7% · Other 2.2%
- 2008→2024 swing
- -20.0pp toward R · 2008: 34.4pp · 2024: 14.4pp
- All cycles
- 2024: D+14.4 2020: D+22.9 2016: D+21.2 2012: D+34.9 2008: D+34.4
Not yet ingested
- Civics
- —
Market trends
- HPI YoY
- ▼ -72.78%
- Current HPI
- 474.9956
- Rent YoY
- ▲ 3.68%
- Metro
- Providence-Warwick, RI-MA
- State GDP YoY
- ▲ 2.25%
- F500 in state
- 10
Industry mix (Fortune 500 HQ in RI)
| Industry | F500 HQs | Revenue |
|---|---|---|
| Healthcare | 1 | $373B |
|
||
| Food Distribution | 1 | $31B |
|
||
| Aerospace / Defense | 1 | $14B |
|
||
| Financial Services | 1 | $8B |
|
||
| Consumer Goods | 1 | $4B |
|
||
Price history
+42.3% since first listed3 events — show timeline
- 2026-06-08 Pending — RIS
- 2026-05-14 Listed $369,900 RIS
- 2026-02-20 Sold (Public Records) $260,000 Public Records
Property tax history
-2.3%/yrLatest (2025): $2,718 · -33.9% YoY. Source: county tax records.
Cash-flow waterfall
monthlySold comps — $/sqft
last 12 mo · ≤1 miLoading sold comps…