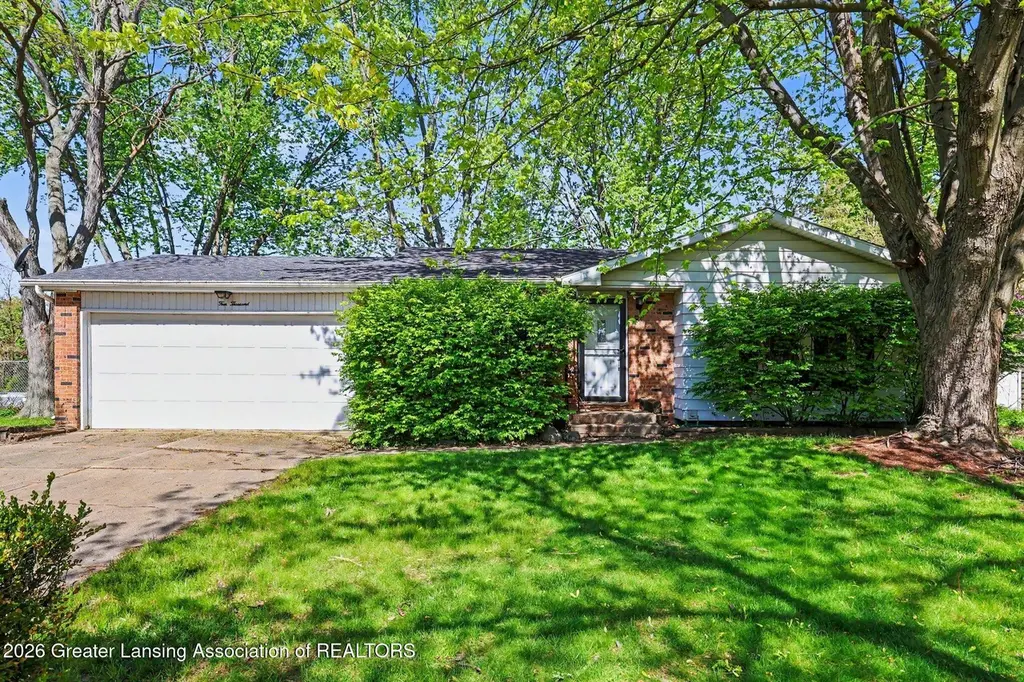
4000 Seaway Dr · Lansing, MI
Flood risk 1/10 · Minimal
- FEMA flood zone
- X (unshaded)
- Chance of flooding over 30 yrs
- 0.0%
- Est. flood insurance / yr
- $473 – $860
Fire risk 1/10 · Minimal
- Est. fire insurance / yr
- $784 – $1,456
Heat risk 2/10 · Minimal
- Hot days now (above 97°F)
- 7 days/yr
- Hot days in 30 yrs
- 16 days/yr
Wind risk 2/10 · Minimal
- Chance of severe wind over 30 yrs
- —
Air-quality risk 2/10 · Minimal
- Unhealthy air days now
- 1 days/yr
- Unhealthy air days in 30 yrs
- 2 days/yr
Risk factors via First Street. Map © Google.
Why this score? — see what drove the F grade
The composite is a weighted blend of 9 inputs, each scored 0–100. Each bar is that input's sub-score; the figure is the points it added to the 100-point composite (weight × sub-score).
- Cash flow +9.5/30.0
- ARV discount +5.9/15.0
- Rent growth +5.0/5.0
- Livability +4.0/5.0
- DSCR +2.7/10.0
- Condition / age +2.5/5.0
- Schools +1.9/10.0
- 1% rule +1.8/10.0
- Appreciation +0.0/10.0
$194,000
🖨 Deal sheet 📄 Offer letter ✓ Due diligence
Listing remarks MLS
Welcome to 4000 Seaway! This updated 2 bed, 2 bath ranch offers comfort and style near Fulton Park. Major updates include a new roof (2021), furnace (2023), and deck (2022)--perfect for relaxing or entertaining outdoors. Inside, enjoy a spacious kitchen with passthrough to the dining and living areas, highlighted by a cathedral ceiling. Hardwood floors run through the living room, dining room, and bedrooms, and the main living spaces feature fresh paint. Originally a 3-bedroom, the layout was reconfigured to create a large primary bedroom. The finished lower level adds valuable living space with a rec room, full bath, and a bonus room ideal for an office or den. Move-in ready with great indoor and outdoor living! Seller is a licensed real estate agent in the state of Michigan.
Key facts
- New furnace
- Spacious kitchen
- New deck
Tags
Property features AI
Exterior
- Parking: Attached 2-car garage
- Utilities: Natural gas connected
- Home design: Ranch-style single-family residence; Built in 1975
- Construction: Brick and vinyl siding exterior; Shingle roof
- Exterior features: Sidewalk; Paved road access; Public water
Interior
- Kitchen: Dishwasher; Microwave; Oven; Refrigerator
- Bathrooms: Two full bathrooms
- Heating & cooling: Forced air heating
- Interior features: Six total rooms; Full basement
Neighborhood map
What this means for you Summary
Snapshot
- This is a 3-bed/1.0-bath single-family listed at $194k.
Deal economics
- At list price, monthly cash flow is $-134 ($-2k/yr) — negative.
- To cash-flow at today's rent, offer at most $170k (12.2% below list).
- To meet the 1% rule (rent ≥ 1% of price), the offer needs to be $131k (32.4% below list).
- Recommended offer: $131k (32.4% below list) — sets the bar for 1% rule.
Location & tenants
- Location reads 79/100 on livability (#94 in MI, #2,182 nationally) — a middle-class / working-renter tenant base. Strengths: amenities A+, commute A+, cost of living A+; Watch: employment D, schools F, crime F.
- Lansing Public School District (urban): math 14% / reading 23% proficiency, ranked #650 of 760 in MI (top 86%) — low school quality limits family demand, transient renter base, plan for 1-2y turnover; 68% free/reduced lunch — lower-income household profile, screen leases tightly.
- Market conditions: Rents rising fast (+9.9%/yr); 143 active listings in the ZIP; 11 comparable units currently listed for rent nearby; rentals at typical pace (median 21d on market — plan ~3-4 weeks tenant-placement turnaround); 98 units permitted in Eaton County in 2024 (0 in 5+ unit buildings).
Forward outlook
- Local home prices are declining (-3.0%/yr); year-one equity from $1k of loan paydown is wiped out by about $6k of value loss. Plan a longer hold.
- Eaton County population projected to shrink 5% by 2050 — rents likely to lag national; underwrite the cash flow, not the appreciation.
Negotiation context
- It's been on market 26 days — a 2% lower offer ($191k) is reasonable based on typical stale-listing flexibility.
- 9 sale attempts since 16y ago with the ask held roughly flat each time — persistent listings suggest the price (not the market) is what's stuck; bring a comps-based counter.
- Current owner paid $145k; 34% above their basis — modest negotiation headroom, anchor on the comps not their cost.
Questions for the listing agent
- What do current leases actually rent for vs. the listed asking? Can we see a recent rent roll and the last 12 months of T-12 income?
- Built in 1975 — when were the roof, HVAC, electrical panel, plumbing, and water heater last replaced?
- Is there a deadline driving the sale (1031 exchange, divorce, estate, relocation)? That informs how much negotiation room exists.
- Schools are F-rated, which usually means shorter tenancies and higher turnover. Who's the typical renter profile here, and what's been the actual vacancy rate?
- Crime grade is F in this area — have there been break-ins, vandalism, or insurance claims at this property in the last 3 years? What carrier currently insures it and at what premium?
- The area grade is low — what's the realistic commute time and amenity access for the typical tenant pool here? Any planned neighborhood developments (good or bad) we should know about?
- What's the average days-on-market for RENTAL listings here right now (not sales)? A rising rental-DOM trend means longer vacancies and softer asking-rent achievability than the comps imply.
- What's the recent tenant-quality profile in this submarket — average credit score on applications, eviction rate, late-payment / NSF rate, and stable-employment percentage? A property-management company in the area should have these aggregated.
- How much new for-sale + rental construction is in the pipeline within 1–3 miles? Heavy new supply typically softens prices + rents 12–24 months out; constrained supply supports both.
Investment metrics
- 1% rule
- 0.68% ✗
- Cap rate
- 5.46%
- Cash-on-cash
- -2.96%
- DSCR
- 0.87
- GRM
- 12.3
CMA / ARV
- ARV (median comp)
- $187,279
- List price
- $194,000
- Delta
- 3.59%
- Verdict
- FAIR
- Comps
- 20 within 1.0 mi
Show comp detail 12 sales within ~0.75 mi
| Address | Dist | Beds/Ba | Sqft | Sold | Price | $/sf | Match |
|---|---|---|---|---|---|---|---|
| 4009 Heathgate Dr | 0.37mi | 3/1.0 | 1,071 (+0%) | 5mo | $145,000 | $135 | 78 |
| 4304 Dumfries Cir | 0.17mi | 3/2.0 | 1,112 (+4%) | 5mo | $135,000 | $121 | 77 |
| 4205 Glenburne Blvd | 0.27mi | 3/1.5 | 1,098 (+3%) | 7mo | $178,000 | $162 | 75 |
| 4104 Glenburne Blvd | 0.29mi | 3/1.0 | 1,008 (-6%) | 8mo | $157,000 | $156 | 70 |
| 4305 Old Castle Cir | 0.24mi | 3/1.0 | 1,136 (+6%) | 10mo | $139,000 | $122 | 70 |
| 4328 Chadburne Dr | 0.41mi | 3/2.0 | 1,046 (-2%) | 5mo | $179,000 | $171 | 69 |
| 3629 Alpine Dr | 0.62mi | 3/1.0 | 1,080 (+1%) | 10mo | $135,000 | $125 | 61 |
| 4123 Balmoral Dr | 0.20mi | 3/2.0 | 1,224 (+15%) | 5mo | $150,000 | $123 | 58 |
| 3526 Berwick Dr | 0.73mi | 3/1.0 | 1,028 (-4%) | 6mo | $109,000 | $106 | 55 |
| 3800 Ronald St | 0.65mi | 3/1.5 | 1,011 (-5%) | 9mo | $150,000 | $148 | 51 |
| 4119 Thackin Dr | 0.35mi | 3/3.0 | 1,213 (+14%) | 10mo | $160,000 | $132 | 45 |
| 3701 Sumpter St | 0.65mi | 3/2.0 | 966 (-10%) | 11mo | $171,000 | $177 | 41 |
Match score weights: distance 35% · size 25% · config 20% · recency 20%. Top-matched comps best support the ARV.
Projected returns pro-forma
-3.0% appreciation · 8.0% rent growth · sell at horizon
- IRR
- -16.6%
- Equity multiple
- 0.39×
- Total profit
- $-33,123
- Equity at exit
- $28,926
- IRR
- -2.0%
- Equity multiple
- 0.84×
- Total profit
- $-8,638
- Equity at exit
- $16,774
Cash invested: $54,320 (down + closing). Projections, not guarantees.
Landlord ↔ Tenant lean methodology
- Overall (STATE)
- 62 Landlord-Friendly
- State Michigan
- 62 Landlord-Friendly · EVEN
- County
- — inherits STATE
- City
- — inherits STATE
ZIP-level market 48911
- Rents YoY
- 9.9%
- Active inventory
- 143
- Price-to-rent
- 12.3×
Monthly cashflow live
- Estimated rent
- $1,311 high interval (Pro) →
- Mortgage (P&I)
- −$1,017
- Tax from tax record
- −$71 /mo · $858/yr
- Insurance
- −$81
- HOA
- −$0
- Vacancy / Maint / Mgmt
- −$275
- Net cashflow
- $-134
Break-even live
UW: 25.0% down · 7.5% · 30yr · 1.5% tax · 5.0% vac · 8.0% maint · 8.0% mgmt
Financing live
Cash to close
- Down payment
- $48,500
- Closing costs
- $5,820
- Reserves months
- —
- Total cash needed
- —
Loan-product check · same deal, 3 products live
Conventional
25% down · 7.5% · 30yr
- Down + closing
- —
- Monthly P&I
- —
- Monthly cashflow
- —
- DSCR
- —
- Eligible?
- —
Personal DTI + credit; lowest rate.
DSCR
20% down · 8.5% · 30yr
- Down + closing
- —
- Monthly P&I
- —
- Monthly cashflow
- —
- DSCR
- —
- Eligible?
- —
No personal income docs; deal must DSCR.
Hard money
10% down · 12.0% · 12mo
- Down + closing
- —
- Monthly P&I
- —
- Monthly cashflow
- —
- DSCR
- —
- Eligible?
- —
Short-term bridge; refi at stabilization.
Rent comps 11 comps
| Address | Beds | Baths | Sqft | Rent | $/sqft | DOM | Units | Dist |
|---|---|---|---|---|---|---|---|---|
| 4106 Stillwell Ave Lansing, MI | 3.0 | 1.5 | 1127 | $2,100 | $1.86 | 21d | 1 | 0.83mi |
| 4030 Hartford Rd Lansing, MI | 1.0–2.0 | 1.0 | 640 | $1,094 | $1.71 | 13d | 42 | 0.93mi |
| 2815 Mersey Ln Lansing, MI | 2.0–3.0 | 2.0 | 1050 | $1,325 | $1.26 | 13d | 2 | 0.96mi |
| 4245 W Jolly Rd Lansing, MI | 3.0 | 2.0 | 1216 | $1,199 | $0.99 | 13d | 1 | 0.96mi |
| 3530 W Jolly Rd Unit 6 Lansing, MI | 2.0 | 1.0 | 1049 | $1,100 | $1.05 | 21d | 1 | 1.00mi |
| 2920 Hillcrest St Lansing, MI | 3.0 | 1.0 | 1040 | $1,225 | $1.18 | 43d | 1 | 1.15mi |
| 2823 Hillcrest St Lansing, MI | 3.0 | 1.0 | 925 | $1,245 | $1.35 | 21d | 1 | 1.21mi |
| 4125 Ingham St Lansing, MI | 3.0 | 1.0 | 933 | $1,300 | $1.39 | 43d | 1 | 1.30mi |
| 2612 Fielding Dr Lansing, MI | 2.0 | 1.0 | 1100 | $1,095 | $1.00 | 43d | 1 | 1.32mi |
| 2711 Dunlap St Lansing, MI | 3.0 | 1.0 | 1020 | $1,350 | $1.32 | 44d | 1 | 1.42mi |
| 3407 W Mount Hope Ave Lansing, MI | 2.0 | 2.0 | 1000 | $995 | $0.99 | 13d | 1 | 1.47mi |
Listing history 22 events
-
2026-06-05statusdays on market $194,000 Pending 26 DOM
Show marketing remark (788 chars)
Welcome to 4000 Seaway! This updated 2 bed, 2 bath ranch offers comfort and style near Fulton Park. Major updates include a new roof (2021), furnace (2023), and deck (2022)--perfect for relaxing or entertaining outdoors. Inside, enjoy a spacious kitchen with passthrough to the dining and living areas, highlighted by a cathedral ceiling. Hardwood floors run through the living room, dining room, and bedrooms, and the main living spaces feature fresh paint. Originally a 3-bedroom, the layout was reconfigured to create a large primary bedroom. The finished lower level adds valuable living space with a rec room, full bath, and a bonus room ideal for an office or den. Move-in ready with great indoor and outdoor living! Seller is a licensed real estate agent in the state of Michigan.
-
2026-06-03days on market $194,000 Active 25 DOM
-
2026-06-02days on market $194,000 Active 24 DOM
-
2026-06-01days on market $194,000 Active 23 DOM
Show marketing remark (788 chars)
Welcome to 4000 Seaway! This updated 2 bed, 2 bath ranch offers comfort and style near Fulton Park. Major updates include a new roof (2021), furnace (2023), and deck (2022)--perfect for relaxing or entertaining outdoors. Inside, enjoy a spacious kitchen with passthrough to the dining and living areas, highlighted by a cathedral ceiling. Hardwood floors run through the living room, dining room, and bedrooms, and the main living spaces feature fresh paint. Originally a 3-bedroom, the layout was reconfigured to create a large primary bedroom. The finished lower level adds valuable living space with a rec room, full bath, and a bonus room ideal for an office or den. Move-in ready with great indoor and outdoor living! Seller is a licensed real estate agent in the state of Michigan.
-
2026-05-31days on market $194,000 Active 22 DOM
-
2026-05-30pricedays on market $194,000 Active 21 DOM
-
2026-05-12$204,000 Active 788-char remark
Show marketing remark (788 chars)
Welcome to 4000 Seaway! This updated 2 bed, 2 bath ranch offers comfort and style near Fulton Park. Major updates include a new roof (2021), furnace (2023), and deck (2022)--perfect for relaxing or entertaining outdoors. Inside, enjoy a spacious kitchen with passthrough to the dining and living areas, highlighted by a cathedral ceiling. Hardwood floors run through the living room, dining room, and bedrooms, and the main living spaces feature fresh paint. Originally a 3-bedroom, the layout was reconfigured to create a large primary bedroom. The finished lower level adds valuable living space with a rec room, full bath, and a bonus room ideal for an office or den. Move-in ready with great indoor and outdoor living! Seller is a licensed real estate agent in the state of Michigan.
-
2026-05-09$204,000 Active
-
2026-05-09$204,000 Active
-
2026-05-09$204,000 Active
-
2024-03-27soldstatus $145,000
-
2024-03-21soldstatus $145,000 Closed
-
2024-03-21soldstatus $145,000
-
2024-02-12status Pending
-
2024-02-08$149,900 Active
-
2024-02-08$149,900
-
2013-11-04soldstatus $65,000
-
2013-10-29soldstatus $65,000
-
2013-07-19$68,500
-
2010-07-30soldstatus $40,000
-
2010-07-07$45,000
ⓘ Source: listings_history table (triggers on properties + properties_extension) + one-shot
backfill from property_details.listing_events for pre-trigger history.
Tax reassessment forecast MI · Partial reset (capped growth)
- Current annual tax
- $858 · $71/mo
- Projected year-2 tax
- $1,923 · $160/mo
- Expected delta
- +$1,065/yr (+$89/mo · 124.1%)
ⓘ Screening estimate from a state-policy table — verify with the county assessor before closing.
Climate risk First Street
- Flood 1/10 Low FEMA zone X (unshaded) · 0% chance over 30 yrs
- Wildfire 1/10 Low
- Heat 2/10 Low 7 d/yr ≥97°F today · 16 d/yr by 30 yrs out
- Wind 2/10 Low
- Air quality 2/10 Low 1 unhealthy d/yr today · 2 by 30 yrs out
Nearby sold comps map
Loading sold comps map…
Walkable amenities ~0.75 mi
Loading nearby amenities…
Taxation est. · year 1
- Rental income
- $15,733
- − Mortgage interest
- −$10,867
- − Property taxes
- −$858
- − Insurance
- −$970
- − Repairs & maintenance
- −$1,259
- − Management
- −$1,259
- − Depreciation
- −$5,644
- Taxable loss
- −$5,123
- Est. tax savings @ 24.0%
- +$1,229
- After-tax cash flow
- $-378/yr
For passive investors: Depreciation is non-cash, so a rental often shows a tax loss while cash-flowing — sheltering income. Rental losses are passive: they offset passive income freely, and up to $25,000/yr can offset ordinary (W-2) income if you actively participate and your MAGI is under $100k (phasing out to $0 by $150k); unused losses carry forward. On sale, claimed depreciation is recaptured at up to 25%, and gains may owe capital-gains tax (a 1031 exchange can defer both). Figures are a year-1 estimate at your 24.0% rate — not tax advice; consult a CPA.
Schools (NCES district)
- District
- Lansing Public School District
- NCES district ID
- 2621150
- Math proficiency
- 14% ▲ 1.00%
- Reading proficiency
- 23% ▲ 3.00%
- Median HH income
- $37,453
- Composite
- 18.76/100
- National rank
- #14002
- State rank
- #650 of 760 in MI
Livability — Lansing
- Score
- 79/100
- State rank
- #94
- US rank
- #2182
Category grades
Schools grade is shown separately in the Schools card above.
Census & demographics
- Census place
- Lansing, MI
- County
- Ingham County · 237,052 people
- City population
- 161,269
- Metro
- Lansing-East Lansing, MI
- Population (ZIP)
- 39,876
- Household income
- $56,631
- Rent vs Own
- Severe rent burden
- 2255.0
Population outlook (Eaton County) Hauer SSP2
- Today (2025)
- 110,811 people
- By 2030
- 110,598 · -0.2%
- By 2040
- 108,304 · -2.3%
- By 2050
- 104,961 · -5.3%
- By 2075
- 97,197 · -12.3%
- By 2100
- 85,150 · -23.2%
Race, ethnicity, and origin ACS 2023
- Neighborhood character
- Diverse neighborhood (Simpson 0.70)
- Race & ethnicity
- White 46% Black 26% Hispanic / Latino 14% Two or more races 10% Asian 8%
- Hispanic origin (detail)
- Mexican 10% Puerto Rican 1%
- Common ancestry
- Romanian 3% Slovak 2% Iranian 2%
- Foreign-born
- 12% · Canada, Vietnam, Philippines
- Languages at home
- 83% English-only · Spanish 5% Other Indo-European 3% Other Asian/Pacific 2%
Political lean MEDSL · Eaton
- 2024 margin
- Toss-up / Even · D 47.6% · R 50.8% · Other 1.6%
- 2008→2024 swing
- -11.6pp toward R · 2008: 8.4pp · 2024: -3.1pp
- All cycles
- 2024: R+3.1 2020: R+0.8 2016: R+5.5 2012: D+3.1 2008: D+8.4
Not yet ingested
- Civics
- —
Market trends
- HPI YoY
- ▼ -179.62%
- Current HPI
- 176.0632
- Rent YoY
- ▲ 9.90%
- Metro
- Lansing-East Lansing, MI
- State GDP YoY
- ▲ 1.37%
- F500 in state
- 28
Industry mix (Fortune 500 HQ in MI)
| Industry | F500 HQs | Revenue |
|---|---|---|
| Automotive Parts | 3 | $48B |
|
||
| Automotive | 2 | $372B |
|
||
| Chemicals | 1 | $45B |
|
||
| Automotive Retail | 1 | $29B |
|
||
| Healthcare / Medical Devices | 1 | $23B |
|
||
| Automotive Technology | 1 | $20B |
|
||
Price history
+331.1% since first listed26 events — show timeline
- 2026-06-05 Pending — REALCOMP
- 2026-06-05 Pending — Greater Lansing AoR
- 2026-06-04 Pending — REALCOMP
- 2026-06-04 Pending — MiRealSource-MiMLS
- 2026-06-04 Pending — SW Michigan MLS
- 2026-06-01 Price Changed $194,000 REALCOMP
- 2026-06-01 Price Changed $194,000 Greater Lansing AoR
- 2026-05-30 Price Changed $194,000 MiRealSource-MiMLS
- 2026-05-29 Price Changed $194,000 REALCOMP
- 2026-05-29 Price Changed $194,000 SW Michigan MLS
- 2026-05-12 Listed $204,000 Greater Lansing AoR
- 2026-05-12 Listed $204,000 REALCOMP
- 2026-05-09 Listed $204,000 SW Michigan MLS
- 2026-05-09 Listed $204,000 MiRealSource-MiMLS
- 2026-05-09 Listed $204,000 REALCOMP
- 2024-03-27 Sold (Public Records) $145,000 Public Records
- 2024-03-21 Sold (MLS) $145,000 Greater Lansing AoR
- 2024-03-21 Sold (MLS) $145,000 REALCOMP
- 2024-02-12 Pending — Greater Lansing AoR
- 2024-02-08 Listed $149,900 Greater Lansing AoR
- 2024-02-08 Listed $149,900 REALCOMP
- 2013-11-04 Sold (Public Records) $65,000 Public Records
- 2013-10-29 Sold (MLS) $65,000 Greater Lansing AoR
- 2013-07-19 Listed $68,500 Greater Lansing AoR
- 2010-07-30 Sold (MLS) $40,000 Greater Lansing AoR
- 2010-07-07 Listed $45,000 Greater Lansing AoR
Property tax history
-7.5%/yrLatest (2025): $858 · +53.5% YoY. Source: county tax records.
Cash-flow waterfall
monthlySold comps — $/sqft
last 12 mo · ≤1 miLoading sold comps…