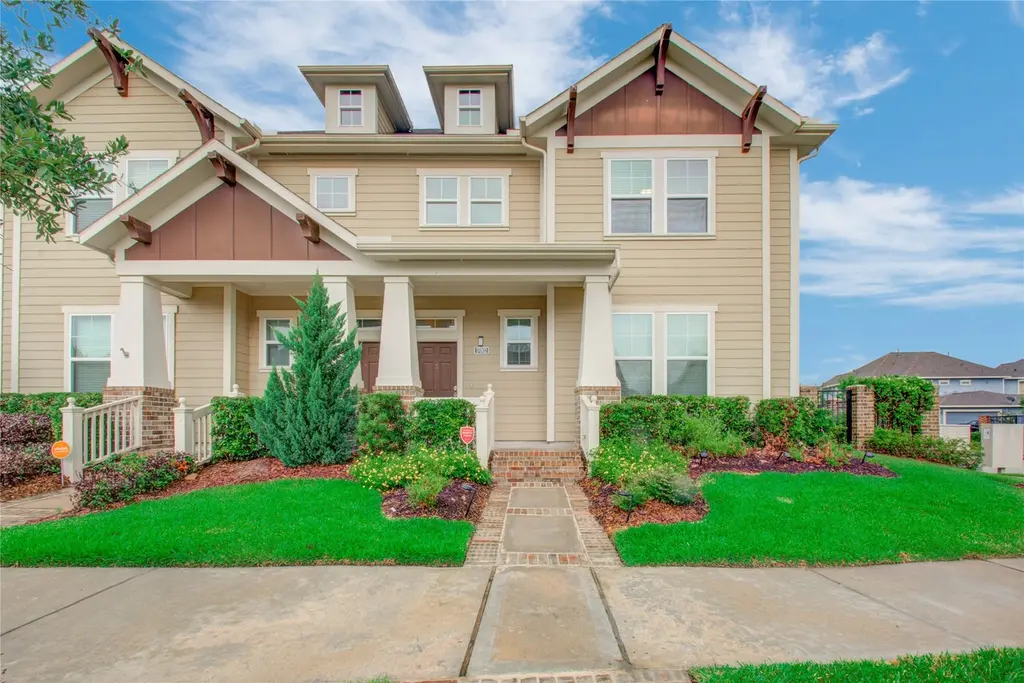
17002 Makanda Dr · Houston, TX
Flood risk 7/10 · Major
- FEMA flood zone
- X (unshaded)
- Chance of flooding over 30 yrs
- 0.95%
- Est. flood insurance / yr
- $507 – $1,088
Fire risk 4/10 · Minor
- Est. fire insurance / yr
- $1,222 – $2,270
Heat risk 9/10 · Severe
- Hot days now (above 110°F)
- 7 days/yr
- Hot days in 30 yrs
- 23 days/yr
Wind risk 8/10 · Major
- Chance of severe wind over 30 yrs
- 99.0%
Air-quality risk 2/10 · Minimal
- Unhealthy air days now
- 2 days/yr
- Unhealthy air days in 30 yrs
- 2 days/yr
Risk factors via First Street. Map © Google.
Why this score? — see what drove the D- grade
The composite is a weighted blend of 9 inputs, each scored 0–100. Each bar is that input's sub-score; the figure is the points it added to the 100-point composite (weight × sub-score).
- ARV discount +15.0/15.0
- Cash flow +5.7/30.0
- 1% rule +4.4/10.0
- Schools +4.4/10.0
- Livability +3.7/5.0
- Condition / age +2.5/5.0
- Rent growth +2.2/5.0
- DSCR +0.1/10.0
- Appreciation +0.0/10.0
$299,000
🖨 Deal sheet (PDF) 📄 Offer letter ✓ Due diligence
Listing remarks
Gorgeous townhome on a corner lot with a welcoming front porch and a large yard. Upon entering the home you are greeted with a two-story entry that has 20-foot ceilings, which leads you into the family room. The family room features a wall of windows. The kitchen's granite island has built-in seating space providing plenty of room to cook and entertain. The primary suite is on the first floor and the en-suite bath has dual vanities, a large glass-enclosed shower and walk-in closet. The secondary bedrooms upstairs are generous in size. There is a loft area at the top of the stairs, that could be a study nook. Also upstairs is as a game room. The backyard has a covered patio area and an overs
Key facts
- Two-story entry
- Large yard
- 20-foot ceilings
Tags
Property features AI
Finance
- Other: Disclosures: Municipal Utility District Disclosure, Seller Disclosure
- Financial info: Lease considered
- HOA & community: Community managed by Inframark; Annual association fee; Association fee covers common areas, grounds maintenance, and structure maintenance; Community pool; Curbs and gutters
Exterior
- Parking: Detached garage; 2 garage spaces
- Security: Smoke detector(s)
- Utilities: Public water; Public sewer
- Home design: Residential property; 2 stories; Faces west; Full ownership
- Construction: Cement siding; Composition roof; Slab foundation; Built in 2017
- Exterior features: Sprinkler/irrigation system; Private yard; Side yard; Concrete road access
Interior
- Kitchen: Dishwasher; Disposal; Gas oven; Gas range; Microwave; Oven; Refrigerator
- Bedrooms: 3 bedrooms
- Flooring: Carpet; Tile
- Bathrooms: 2 full bathrooms; 1 half bathroom
- Heating & cooling: Central heating (gas); Central air; Electric cooling; Attic fan
- Interior features: Breakfast bar; Double vanity; Entrance foyer; High ceilings; Kitchen island; Kitchen/family room combo; Primary bedroom with private bath; Pantry; Tub with shower; Window treatments; Ceiling fan(s); Kitchen/dining combo; Living/dining room; Programmable thermostat; Insulated doors; Low emissivity windows; Window coverings; Ventilation for improved indoor air quality
Neighborhood map
What this means for you Summary
Snapshot
- This is a 3-bed/2.5-bath single-family listed at $299k.
Deal economics
- At list price, monthly cash flow is $-672 ($-8k/yr) — negative.
- To cash-flow at today's rent, offer at most $199k (33.4% below list).
- To meet the 1% rule (rent ≥ 1% of price), the offer needs to be $280k (6.4% below list).
- Recommended offer: $199k (33.4% below list) — sets the bar for cash-flow.
- Cap rate 3.9% vs local median 3.2% in Houston — meaningfully above typical; check what's discounted (condition, days-on-market, listing class) to confirm the premium yield is real.
Location & tenants
- Location reads 74/100 on livability (#184 in TX, #4,771 nationally) — a middle-class / working-renter tenant base. Strengths: amenities A+, cost of living A+, housing A+; Watch: crime F.
- Cypress-Fairbanks ISD (suburban): math 45% / reading 52% proficiency, ranked #161 of 826 in TX (top 20%) — families likely to look elsewhere, expect single-tenant / working-renter base with shorter leases.
- Zoned schools: Mcgown El (1,103 students, 11% FRL); Smith Middle (math 79% / reading 78%, grade A+, #19 of 1,662 statewide, top 1%, 2,057 students, 14% FRL); Cypress-Fairbanks J J A E P (12 students, 0% FRL) — zoned schools average 8% FRL vs 43% district-wide (35 pts lower); this property's tenant base skews higher-income than the district average.
- Zoned-school proficiency averages 78% at this address vs 48% district-wide (+30 pts) — the actual schools serving this property are materially stronger than the Cypress-Fairbanks ISD average implies; a family-tenant draw the district grade alone would hide.
- Market conditions: Rents soft (-1.3%/yr); 2065 active listings in the ZIP; 5 comparable units currently listed for rent nearby; rentals at typical pace (median 26d on market — plan ~3-4 weeks tenant-placement turnaround); 40% of comp listings sitting > 30 days — soft ceiling on asking rent; high-income renter base; 29,883 units permitted in Harris County in 2024 (8,621 in 5+ unit buildings).
Forward outlook
- Local home prices are declining (-3.0%/yr); year-one equity from $2k of loan paydown is wiped out by about $9k of value loss. Plan a longer hold.
- Harris County population projected at +47% by 2050 — long-run rental-demand tailwind backs the buy-and-hold thesis.
Negotiation context
- It's been on market 16 days — a 2% lower offer ($295k) is reasonable based on typical stale-listing flexibility.
- 9 sale attempts since 9y ago with the ask held roughly flat each time — persistent listings suggest the price (not the market) is what's stuck; bring a comps-based counter.
Risks & watch-outs
- Watch-outs: property tax is 3.3% of price; flood insurance adds $66/mo.
- Climate carrying-cost: major flood risk; severe wind risk, 99% chance of damaging wind over 30y; extreme-heat days projected 7→23/yr by 2055 (HVAC capex compounding) — expect insurance premiums to compound above CPI over the hold.
Questions for the listing agent
- What do current leases actually rent for vs. the listed asking? Can we see a recent rent roll and the last 12 months of T-12 income?
- Property tax is high relative to price — has the assessment been appealed recently, and will the sale trigger a re-assessment?
- What's the actual annual flood-insurance premium (NFIP or private), and is the property in a SFHA with mandatory coverage?
- What does the HOA fee cover, when was the last increase, and are there any pending special assessments or reserve-fund shortfalls?
- Is there a deadline driving the sale (1031 exchange, divorce, estate, relocation)? That informs how much negotiation room exists.
- Schools are D-rated, which usually means shorter tenancies and higher turnover. Who's the typical renter profile here, and what's been the actual vacancy rate?
- Crime grade is F in this area — have there been break-ins, vandalism, or insurance claims at this property in the last 3 years? What carrier currently insures it and at what premium?
- The area grade is low — what's the realistic commute time and amenity access for the typical tenant pool here? Any planned neighborhood developments (good or bad) we should know about?
- What's the average days-on-market for RENTAL listings here right now (not sales)? A rising rental-DOM trend means longer vacancies and softer asking-rent achievability than the comps imply.
- What's the recent tenant-quality profile in this submarket — average credit score on applications, eviction rate, late-payment / NSF rate, and stable-employment percentage? A property-management company in the area should have these aggregated.
- How much new for-sale + rental construction is in the pipeline within 1–3 miles? Heavy new supply typically softens prices + rents 12–24 months out; constrained supply supports both.
Investment metrics
- 1% rule
- 0.94% ✗
- Cap rate
- 3.86%
- Cash-on-cash
- -8.68%
- DSCR
- 0.61
- GRM
- 8.9
CMA / ARV
- ARV (median comp)
- $383,778
- List price
- $299,000
- Delta
- -22.09%
- Verdict
- UNDERPRICED
- Comps
- 20 within 1.0 mi
Show comp detail 12 sales within ~0.75 mi
| Address | Dist | Beds/Ba | Sqft | Sold | Price | $/sf | Match |
|---|---|---|---|---|---|---|---|
| 16835 Amelia Island Dr | 0.25mi | 3/2.0 | 2,164 (+6%) | 1mo | $465,000 | $215 | 76 |
| 18423 Blue Hollow Heights Dr | 0.24mi | 3/2.0 | 1,861 (-9%) | 2mo | $379,000 | $204 | 70 |
| 18506 Gunda Heights Dr | 0.06mi | 3/2.0 | 1,751 (-14%) | 2mo | $360,000 | $206 | 69 |
| 16730 Poplar Branch Way | 0.33mi | 3/2.5 | 2,278 (+11%) | 0mo | $415,000 | $182 | 66 |
| 17202 Williams Pine Dr | 0.51mi | 3/2.0 | 2,174 (+6%) | 2mo | $384,900 | $177 | 62 |
| 16706 Blackland Prairie Dr | 0.37mi | 4/2.0 (+1) | 2,178 (+6%) | 5mo | $435,400 | $200 | 61 |
| 18114 Golden Legion Ln | 0.29mi | 3/2.0 | 1,750 (-15%) | 2mo | $375,000 | $214 | 58 |
| 11623 Columbia Pines Ln | 0.65mi | 3/2.0 | 2,181 (+6%) | 0mo | $362,000 | $166 | 56 |
| 16707 Seminole Ridge Dr | 0.36mi | 3/3.0 | 2,331 (+14%) | 3mo | $499,900 | $214 | 56 |
| 11602 Columbia Pines Ln | 0.68mi | 3/2.0 | 2,244 (+10%) | 1mo | $359,900 | $160 | 49 |
| 11546 Staffordale Ct | 0.73mi | 4/2.0 (+1) | 2,181 (+6%) | 1mo | $385,000 | $177 | 48 |
| 10935 Sarah Bluff Ln | 0.69mi | 3/3.0 | 2,240 (+9%) | 6mo | $439,000 | $196 | 46 |
Match score weights: distance 35% · size 25% · config 20% · recency 20%. Top-matched comps best support the ARV.
Projected returns pro-forma
-3.0% appreciation · 0.0% rent growth · sell at horizon
- IRR
- -38.6%
- Equity multiple
- -0.18×
- Total profit
- $-98,899
- Equity at exit
- $44,582
- IRR
- -94.8%
- Equity multiple
- -1.04×
- Total profit
- $-170,701
- Equity at exit
- $25,852
Cash invested: $83,720 (down + closing). Projections, not guarantees.
Landlord ↔ Tenant lean methodology
- Overall (STATE)
- 87 Strongly Landlord-Friendly
- State Texas
- 87 Strongly Landlord-Friendly · R+5
- County
- — inherits STATE
- City
- — inherits STATE
ZIP-level market 77433
- Home prices YoY
- -28.5%
- Rents YoY
- -1.3%
- Active inventory
- 2065
- Price-to-rent
- 8.9×
Monthly cashflow live
- Estimated rent
- $2,798 high interval (Pro) →
- Mortgage (P&I)
- −$1,568
- Tax from tax record
- −$829 /mo · $9,950/yr
- Insurance
- −$125
- Flood insurance flood zone
- −$66 /mo · $798/yr
- HOA
- −$294
- Vacancy / Maint / Mgmt
- −$588
- Net cashflow
- $-672
Break-even live
Sensitivity live
| Price | -10% $-503 | -5% $-587 | +0% $-672 | +5% $-757 | +10% $-841 |
|---|---|---|---|---|---|
| Rent | -10% $-893 | -5% $-782 | +0% $-672 | +5% $-561 | +10% $-451 |
| Rate | -1.0pp $-521 | -0.5pp $-596 | base $-672 | +0.5pp $-749 | +1.0pp $-828 |
UW: 25.0% down · 7.5% · 30yr · 1.5% tax · 5.0% vac · 8.0% maint · 8.0% mgmt
Financing live
Cash to close
- Down payment
- $74,750
- Closing costs
- $8,970
- Reserves months
- —
- Total cash needed
- —
Loan-product check · same deal, 3 products live
Conventional
25% down · 7.5% · 30yr
- Down + closing
- —
- Monthly P&I
- —
- Monthly cashflow
- —
- DSCR
- —
- Eligible?
- —
Personal DTI + credit; lowest rate.
DSCR
20% down · 8.5% · 30yr
- Down + closing
- —
- Monthly P&I
- —
- Monthly cashflow
- —
- DSCR
- —
- Eligible?
- —
No personal income docs; deal must DSCR.
Hard money
10% down · 12.0% · 12mo
- Down + closing
- —
- Monthly P&I
- —
- Monthly cashflow
- —
- DSCR
- —
- Eligible?
- —
Short-term bridge; refi at stabilization.
Rent comps 5 comps
| Address | Beds | Baths | Sqft | Rent | $/sqft | DOM | Units | Dist |
|---|---|---|---|---|---|---|---|---|
| 18515 Bridgeland Creek Pkwy Cypress, TX | 3.0 | 1.0–2.5 | 1251 | $3,015 | $2.41 | 1d | 50 | 0.58mi |
| 18727 Penn Farm Dr Cypress, TX | 4.0 | 3.5 | 2952 | $3,649 | $1.24 | 26d | 1 | 1.01mi |
| 18514 Gratification Ln Cypress, TX | 3.0 | 2.5 | 2270 | $2,995 | $1.32 | 45d | 1 | 1.01mi |
| 20510 Cypress Plaza Pkwy Cypress, TX | 1.0–3.0 | 1.0–2.0 | 1227 | $2,440 | $1.99 | 1d | 34 | 1.24mi |
| 16110 Swift Fox Ct Cypress, TX | 4.0 | 3.0 | 2601 | $2,600 | $1.00 | 45d | 1 | 1.26mi |
HOA detail
- Monthly dues
- $294 · $3,528/yr
Listing history 31 events
-
2026-05-17status Pending 992-char remark
-
2026-05-11status Pending 992-char remark
-
2026-05-04price $299,000 992-char remark
-
2026-04-30$309,000 Active 992-char remark
-
2026-04-30historical
-
2026-04-19price $319,000
-
2026-04-13price $324,000
-
2026-04-04$335,000 Active
-
2025-08-04historical $2,400
-
2025-06-13$2,400
-
2023-10-12historical $2,550
-
2023-10-12historical
-
2023-09-26price $2,550
-
2023-09-26$350,000 Active
-
2023-09-26historical
-
2023-09-19price $350,000
-
2023-09-12$2,600
-
2023-09-11$355,000 Active
-
2023-09-11historical
-
2023-09-02$360,000 Active
-
2021-06-15soldstatus Sold
-
2021-05-26status Pending
-
2021-05-16status Option Pending
-
2021-05-13$280,000 Active
-
2017-08-08soldstatus Sold
-
2017-07-10status Pending
-
2017-06-06price $249,900
-
2017-04-28price $259,900
-
2017-03-28price $275,900
-
2017-03-13price $294,900
-
2017-03-08$290,900 Active
ⓘ Source: listings_history table (triggers on properties + properties_extension) + one-shot
backfill from property_details.listing_events for pre-trigger history.
Tax reassessment forecast TX · Resets to sale price
- Current annual tax
- $9,950 · $829/mo
- Projected year-2 tax
- $9,950 · $829/mo
- Expected delta
- $0/yr ($0/mo · 0.0%)
ⓘ Screening estimate from a state-policy table — verify with the county assessor before closing.
Climate risk First Street
- Flood 7/10 Severe FEMA zone X (unshaded) · 95% chance over 30 yrs
- Wildfire 4/10 Moderate
- Heat 9/10 Extreme 7 d/yr ≥110°F today · 23 d/yr by 30 yrs out
- Wind 8/10 Severe 99% chance of damaging wind over 30 yrs
- Air quality 2/10 Low 2 unhealthy d/yr today · 2 by 30 yrs out
Nearby sold comps map
Loading sold comps map…
Walkable amenities ~0.75 mi
Loading nearby amenities…
Taxation est. · year 1
- Rental income
- $33,575
- − Mortgage interest
- −$16,749
- − Property taxes
- −$9,950
- − Insurance
- −$2,292
- − Repairs & maintenance
- −$2,686
- − Management
- −$2,686
- − HOA
- −$3,528
- − Depreciation
- −$8,698
- Taxable loss
- −$13,015
- Est. tax savings @ 24.0%
- +$3,124
- After-tax cash flow
- $-4,939/yr
For passive investors: Depreciation is non-cash, so a rental often shows a tax loss while cash-flowing — sheltering income. Rental losses are passive: they offset passive income freely, and up to $25,000/yr can offset ordinary (W-2) income if you actively participate and your MAGI is under $100k (phasing out to $0 by $150k); unused losses carry forward. On sale, claimed depreciation is recaptured at up to 25%, and gains may owe capital-gains tax (a 1031 exchange can defer both). Figures are a year-1 estimate at your 24.0% rate — not tax advice; consult a CPA.
Schools (NCES district)
- District
- Cypress-Fairbanks ISD
- NCES district ID
- 4816110
- Math proficiency
- 45% ▼ -12.00%
- Reading proficiency
- 52% ▼ -2.00%
- Median HH income
- $72,025
- Composite
- 43.63/100
- National rank
- #2968
- State rank
- #161 of 826 in TX
Livability — Houston
- Score
- 74/100
- State rank
- #184
- US rank
- #4771
Category grades
Schools grade is shown separately in the Schools card above.
Census & demographics
- County
- Harris County · 4,702,590 people
- City population
- 3,226,434
- Metro
- Houston-The Woodlands-Sugar Land, TX
- Population (ZIP)
- 116,550
- Household income
- $143,934
- Rent vs Own
- Severe rent burden
- 1700.0
Population outlook (Harris County) Hauer SSP2
- Today (2025)
- 5,571,493 people
- By 2030
- 6,089,821 · +9.3%
- By 2040
- 7,142,806 · +28.2%
- By 2050
- 8,185,864 · +46.9%
- By 2075
- 10,574,329 · +89.8%
- By 2100
- 12,109,958 · +117.4%
Race, ethnicity, and origin ACS 2023
- Neighborhood character
- Highly diverse neighborhood (Simpson 0.73)
- Race & ethnicity
- White 39% Hispanic / Latino 27% Black 17% Two or more races 14% Asian 13%
- Hispanic origin (detail)
- Mexican 16%
- Common ancestry
- Lithuanian 2% Romanian 1% Italian 1%
- Foreign-born
- 21% · Canada, Vietnam, China
- Languages at home
- 66% English-only · Spanish 19% Other Indo-European 4% Vietnamese 4%
Political lean MEDSL · Harris
- 2024 margin
- Lean D (+5.5) · D 52.0% · R 46.4% · Other 1.6%
- 2008→2024 swing
- +3.9pp toward D · 2008: 1.6pp · 2024: 5.5pp
- All cycles
- 2024: D+5.5 2020: D+13.3 2016: D+12.4 2012: D+0.1 2008: D+1.6
Not yet ingested
- Civics
- —
Market trends
- HPI YoY
- ▼ -87.83%
- Current HPI
- 220.2136
- Rent YoY
- ▼ -1.27%
- Metro
- Houston-The Woodlands-Sugar Land, TX
- State GDP YoY
- ▲ 3.95%
- F500 in state
- 110
Industry mix (Fortune 500 HQ in TX)
| Industry | F500 HQs | Revenue |
|---|---|---|
| Energy | 16 | $1,198B |
|
||
| Technology | 5 | $198B |
|
||
| Engineering / Construction | 4 | $72B |
|
||
| Energy Services | 3 | $60B |
|
||
| Utilities | 3 | $41B |
|
||
| Healthcare | 2 | $330B |
|
||
Price history
+2.8% since first listed33 events — show timeline
- 2026-06-08 Sold (Public Records) — Public Records
- 2026-06-05 Sold (MLS) — HARMLS
- 2026-05-17 Pending — HARMLS
- 2026-05-11 Pending — HARMLS
- 2026-05-04 Price Changed $299,000 HARMLS
- 2026-04-30 Listing Removed — HARMLS
- 2026-04-30 Listed $309,000 HARMLS
- 2026-04-19 Price Changed $319,000 HARMLS
- 2026-04-13 Price Changed $324,000 HARMLS
- 2026-04-04 Listed $335,000 HARMLS
- 2025-08-04 Rental Removed $2,400 SHOWMOJO
- 2025-06-13 Listed for Rent $2,400 SHOWMOJO
- 2023-10-12 Rental Removed $2,550 HARMLS
- 2023-10-12 Listing Removed — HARMLS
- 2023-09-26 Price Changed $2,550 HARMLS
- 2023-09-26 Listing Removed — HARMLS
- 2023-09-26 Listed $350,000 HARMLS
- 2023-09-19 Price Changed $350,000 HARMLS
- 2023-09-12 Listed for Rent $2,600 HARMLS
- 2023-09-11 Listing Removed — HARMLS
- 2023-09-11 Listed $355,000 HARMLS
- 2023-09-02 Listed $360,000 HARMLS
- 2021-06-15 Sold (MLS) — HARMLS
- 2021-05-26 Pending — HARMLS
- 2021-05-16 Pending — HARMLS
- 2021-05-13 Listed $280,000 HARMLS
- 2017-08-08 Sold (MLS) — HARMLS
- 2017-07-10 Pending — HARMLS
- 2017-06-06 Price Changed $249,900 HARMLS
- 2017-04-28 Price Changed $259,900 HARMLS
- 2017-03-28 Price Changed $275,900 HARMLS
- 2017-03-13 Price Changed $294,900 HARMLS
- 2017-03-08 Listed $290,900 HARMLS
Property tax history
+25.6%/yrLatest (2025): $9,950 · -4.8% YoY. Source: county tax records.
Cash-flow waterfall
monthlySold comps — $/sqft
last 12 mo · ≤1 miLoading sold comps…