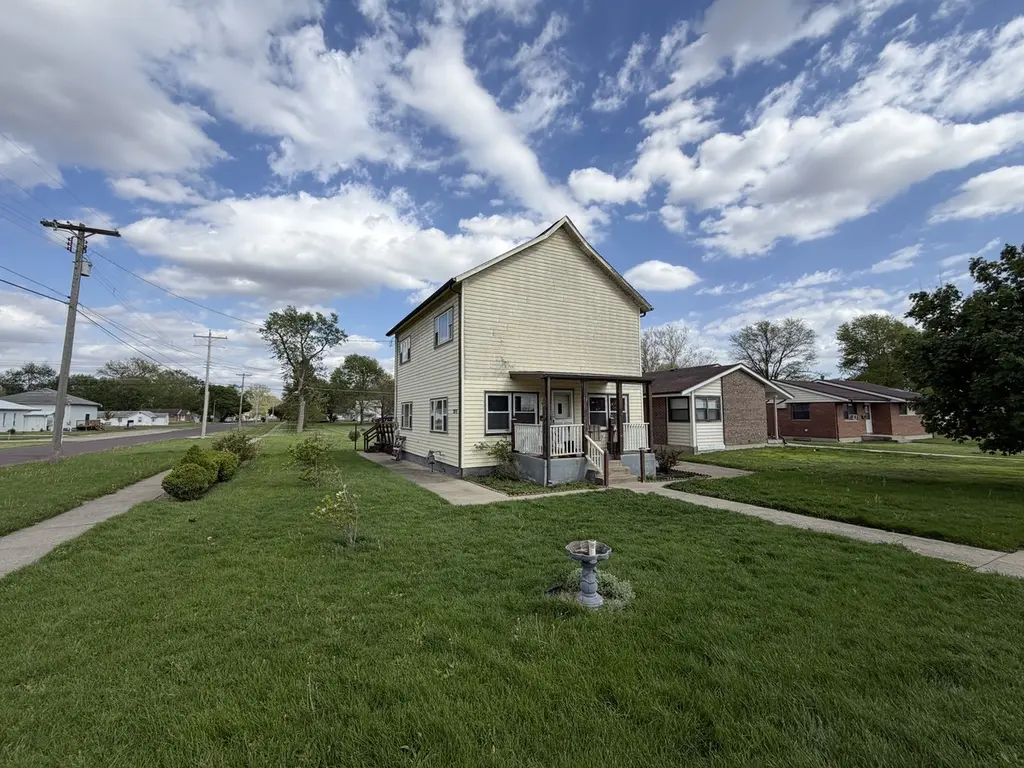
523 W 9th St · Gibson City, IL
Flood risk 6/10 · Moderate
- FEMA flood zone
- X (unshaded)
- Chance of flooding over 30 yrs
- 0.75%
- Est. flood insurance / yr
- $473 – $860
Fire risk 2/10 · Minimal
- Est. fire insurance / yr
- $804 – $1,492
Heat risk 3/10 · Minor
- Hot days now (above 104°F)
- 7 days/yr
- Hot days in 30 yrs
- 18 days/yr
Wind risk 2/10 · Minimal
- Chance of severe wind over 30 yrs
- 1.0%
Air-quality risk 2/10 · Minimal
- Unhealthy air days now
- 1 days/yr
- Unhealthy air days in 30 yrs
- 1 days/yr
Risk factors via First Street. Map © Google.
Why this score? — see what drove the D grade
The composite is a weighted blend of 9 inputs, each scored 0–100. Each bar is that input's sub-score; the figure is the points it added to the 100-point composite (weight × sub-score).
- Cash flow +13.0/30.0
- ARV discount +10.6/15.0
- DSCR +3.9/10.0
- 1% rule +3.4/10.0
- Livability +3.2/5.0
- Schools +2.7/10.0
- Rent growth +2.5/5.0
- Condition / age +2.5/5.0
- Appreciation +0.0/10.0
$130,000
🖨 Deal sheet 📄 Offer letter ✓ Due diligence
Listing remarks MLS
Charming two-story home offering 3 bedrooms and 2 full baths, perfectly situated on a large corner lot near a park in Gibson City! Inside, you'll find a spacious living room, a separate dining room ideal for gatherings, and a bonus family room that provides extra space to relax or entertain. Enjoy outdoor living with a large patio area and a backyard deck featuring built-in benches-perfect for hosting or unwinding. Major updates include a furnace and water heater, both replaced in 2021, adding peace of mind for years to come. A wonderful opportunity to enjoy space, comfort, and a great location all in one! Sold as is.
Key facts
- 7,840 sq ft lot
- 2 parking spots
- Built 1892
Neighborhood map
What this means for you Summary
Snapshot
- This is a 3-bed/2.0-bath single-family listed at $130k.
Deal economics
- At list price, monthly cash flow is $-7 ($-79/yr) — negative.
- To cash-flow at today's rent, offer at most $129k (0.9% below list).
- To meet the 1% rule (rent ≥ 1% of price), the offer needs to be $109k (16.1% below list).
- Recommended offer: $109k (16.1% below list) — sets the bar for 1% rule.
Location & tenants
- Location reads 63/100 on livability (#777 in IL) — a middle-class / working-renter tenant base. Strengths: cost of living A+, crime A-, housing A-; Watch: schools D, amenities F, commute F.
- Gibson City-Melvin-Sibley CUSD 5 (town): math 26% / reading 36% proficiency, ranked #242 of 620 in IL (top 39%) — families likely to look elsewhere, expect single-tenant / working-renter base with shorter leases.
- Market conditions: 17 active listings in the ZIP; 10 units permitted in Ford County in 2024 (0 in 5+ unit buildings).
Forward outlook
- Local home prices are declining (-3.0%/yr); year-one equity from $899 of loan paydown is wiped out by about $4k of value loss. Plan a longer hold.
- Ford County population projected at -17% by 2050 — secular population decline; favor cash flow + early exit over multi-decade hold.
Negotiation context
- Only 11 days on market — expect competitive offers; lowballing is unlikely to land.
- 3 sale attempts since 11y ago with the ask held roughly flat each time — persistent listings suggest the price (not the market) is what's stuck; bring a comps-based counter.
- Current owner paid $70k; list at $130k implies a 86% gain — meaningful room to come down on a strong offer.
Risks & watch-outs
- Watch-outs: built in 1892 — expect roof / HVAC / electrical / plumbing capex.
- Climate carrying-cost: major flood risk — expect insurance premiums to compound above CPI over the hold.
Questions for the listing agent
- What do current leases actually rent for vs. the listed asking? Can we see a recent rent roll and the last 12 months of T-12 income?
- Built in 1892 — when were the roof, HVAC, electrical panel, plumbing, and water heater last replaced?
- Is there a deadline driving the sale (1031 exchange, divorce, estate, relocation)? That informs how much negotiation room exists.
- Schools are D-rated, which usually means shorter tenancies and higher turnover. Who's the typical renter profile here, and what's been the actual vacancy rate?
- The area grade is low — what's the realistic commute time and amenity access for the typical tenant pool here? Any planned neighborhood developments (good or bad) we should know about?
- What's the average days-on-market for RENTAL listings here right now (not sales)? A rising rental-DOM trend means longer vacancies and softer asking-rent achievability than the comps imply.
- What's the recent tenant-quality profile in this submarket — average credit score on applications, eviction rate, late-payment / NSF rate, and stable-employment percentage? A property-management company in the area should have these aggregated.
- How much new for-sale + rental construction is in the pipeline within 1–3 miles? Heavy new supply typically softens prices + rents 12–24 months out; constrained supply supports both.
Investment metrics
- 1% rule
- 0.84% ✗
- Cap rate
- 6.23%
- Cash-on-cash
- -0.22%
- DSCR
- 0.99
- GRM
- 9.9
CMA / ARV
- ARV (median comp)
- $139,597
- List price
- $130,000
- Delta
- -6.87%
- Verdict
- FAIR
- Comps
- 20 within 1.0 mi
Show comp detail 12 sales within ~0.75 mi
| Address | Dist | Beds/Ba | Sqft | Sold | Price | $/sf | Match |
|---|---|---|---|---|---|---|---|
| 523 W 9th St | 0.00mi | 3/2.0 | 1,440 (0%) | 0mo | $82,500 | $57 | 100 |
| 324 W 6th St | 0.29mi | 3/2.0 | 1,374 (-5%) | 6mo | $160,000 | $116 | 74 |
| 211 N Lott Blvd | 0.55mi | 3/1.0 | 1,410 (-2%) | 7mo | $106,000 | $75 | 61 |
| 406 S Church St | 0.60mi | 4/2.0 (+1) | 1,505 (+4%) | 5mo | $115,000 | $76 | 55 |
| 203 W 10th St | 0.31mi | 3/2.0 | 1,301 (-10%) | 23mo | $125,000 | $96 | 50 |
| 622 S Church St | 0.74mi | 3/2.0 | 1,500 (+4%) | 18mo | $97,000 | $65 | 44 |
| 111 N Wood St | 0.70mi | 3/1.5 | 1,468 (+2%) | 24mo | $120,000 | $82 | 42 |
| 602 S Church St | 0.70mi | 3/1.0 | 1,588 (+10%) | 16mo | $109,000 | $69 | 33 |
| 416 N Melvin St | 0.70mi | 4/2.0 (+1) | 1,594 (+11%) | 21mo | $134,000 | $84 | 27 |
| 315 N Melvin St | 0.64mi | 3/2.5 | 1,629 (+13%) | 23mo | $121,000 | $74 | 27 |
| 416 N Lott Blvd | 0.62mi | 3/1.0 | 1,238 (-14%) | 21mo | $139,000 | $112 | 26 |
| 609 S Sangamon Ave | 0.64mi | 2/1.0 (-1) | 1,271 (-12%) | 23mo | $148,600 | $117 | 22 |
Match score weights: distance 35% · size 25% · config 20% · recency 20%. Top-matched comps best support the ARV.
Projected returns pro-forma
-3.0% appreciation · 3.0% rent growth · sell at horizon
- IRR
- -16.7%
- Equity multiple
- 0.41×
- Total profit
- $-21,486
- Equity at exit
- $19,383
- IRR
- -8.5%
- Equity multiple
- 0.47×
- Total profit
- $-19,255
- Equity at exit
- $11,240
Cash invested: $36,400 (down + closing). Projections, not guarantees.
Landlord ↔ Tenant lean methodology
- Overall (STATE)
- 43 Moderately Tenant-Leaning
- State Illinois
- 43 Moderately Tenant-Leaning · D+7
- County
- — inherits STATE
- City
- — inherits STATE
ZIP-level market 60936
- Home prices YoY
- -26.7%
- Active inventory
- 17
- Price-to-rent
- 9.9×
Monthly cashflow live
- Estimated rent
- $1,091 medium interval (Pro) →
- Mortgage (P&I)
- −$682
- Tax from tax record
- −$133 /mo · $1,593/yr
- Insurance
- −$54
- HOA
- −$0
- Vacancy / Maint / Mgmt
- −$229
- Net cashflow
- $-7
Break-even live
UW: 25.0% down · 7.5% · 30yr · 1.5% tax · 5.0% vac · 8.0% maint · 8.0% mgmt
Financing live
Cash to close
- Down payment
- $32,500
- Closing costs
- $3,900
- Reserves months
- —
- Total cash needed
- —
Loan-product check · same deal, 3 products live
Conventional
25% down · 7.5% · 30yr
- Down + closing
- —
- Monthly P&I
- —
- Monthly cashflow
- —
- DSCR
- —
- Eligible?
- —
Personal DTI + credit; lowest rate.
DSCR
20% down · 8.5% · 30yr
- Down + closing
- —
- Monthly P&I
- —
- Monthly cashflow
- —
- DSCR
- —
- Eligible?
- —
No personal income docs; deal must DSCR.
Hard money
10% down · 12.0% · 12mo
- Down + closing
- —
- Monthly P&I
- —
- Monthly cashflow
- —
- DSCR
- —
- Eligible?
- —
Short-term bridge; refi at stabilization.
Listing history 9 events
-
2026-05-05status Pending 625-char remark
Show marketing remark (625 chars)
Charming two-story home offering 3 bedrooms and 2 full baths, perfectly situated on a large corner lot near a park in Gibson City! Inside, you'll find a spacious living room, a separate dining room ideal for gatherings, and a bonus family room that provides extra space to relax or entertain. Enjoy outdoor living with a large patio area and a backyard deck featuring built-in benches-perfect for hosting or unwinding. Major updates include a furnace and water heater, both replaced in 2021, adding peace of mind for years to come. A wonderful opportunity to enjoy space, comfort, and a great location all in one! Sold as is.
-
2026-04-24$130,000 Active 625-char remark
Show marketing remark (625 chars)
Charming two-story home offering 3 bedrooms and 2 full baths, perfectly situated on a large corner lot near a park in Gibson City! Inside, you'll find a spacious living room, a separate dining room ideal for gatherings, and a bonus family room that provides extra space to relax or entertain. Enjoy outdoor living with a large patio area and a backyard deck featuring built-in benches-perfect for hosting or unwinding. Major updates include a furnace and water heater, both replaced in 2021, adding peace of mind for years to come. A wonderful opportunity to enjoy space, comfort, and a great location all in one! Sold as is.
-
2026-04-09historical 625-char remark
Show marketing remark (625 chars)
Charming two-story home offering 3 bedrooms and 2 full baths, perfectly situated on a large corner lot near a park in Gibson City! Inside, you'll find a spacious living room, a separate dining room ideal for gatherings, and a bonus family room that provides extra space to relax or entertain. Enjoy outdoor living with a large patio area and a backyard deck featuring built-in benches-perfect for hosting or unwinding. Major updates include a furnace and water heater, both replaced in 2021, adding peace of mind for years to come. A wonderful opportunity to enjoy space, comfort, and a great location all in one! Sold as is.
-
2019-04-22soldstatus $70,000
-
2017-01-19historical
-
2016-01-12
-
2015-11-20historical
-
2015-07-23
-
1988-04-29soldstatus $13,000
ⓘ Source: listings_history table (triggers on properties + properties_extension) + one-shot
backfill from property_details.listing_events for pre-trigger history.
Tax reassessment forecast IL · Partial reset (capped growth)
- Current annual tax
- $1,593 · $133/mo
- Projected year-2 tax
- $2,272 · $189/mo
- Expected delta
- +$679/yr (+$57/mo · 42.6%)
ⓘ Screening estimate from a state-policy table — verify with the county assessor before closing.
Climate risk First Street
- Flood 6/10 Major FEMA zone X (unshaded) · 75% chance over 30 yrs
- Wildfire 2/10 Low
- Heat 3/10 Moderate 7 d/yr ≥104°F today · 18 d/yr by 30 yrs out
- Wind 2/10 Low 100% chance of damaging wind over 30 yrs
- Air quality 2/10 Low 1 unhealthy d/yr today · 1 by 30 yrs out
Nearby sold comps map
Loading sold comps map…
Walkable amenities ~0.75 mi
Loading nearby amenities…
Taxation est. · year 1
- Rental income
- $13,095
- − Mortgage interest
- −$7,282
- − Property taxes
- −$1,593
- − Insurance
- −$650
- − Repairs & maintenance
- −$1,048
- − Management
- −$1,048
- − Depreciation
- −$3,782
- Taxable loss
- −$2,307
- Est. tax savings @ 24.0%
- +$554
- After-tax cash flow
- $475/yr
For passive investors: Depreciation is non-cash, so a rental often shows a tax loss while cash-flowing — sheltering income. Rental losses are passive: they offset passive income freely, and up to $25,000/yr can offset ordinary (W-2) income if you actively participate and your MAGI is under $100k (phasing out to $0 by $150k); unused losses carry forward. On sale, claimed depreciation is recaptured at up to 25%, and gains may owe capital-gains tax (a 1031 exchange can defer both). Figures are a year-1 estimate at your 24.0% rate — not tax advice; consult a CPA.
Schools (NCES district)
- District
- Gibson City-Melvin-Sibley CUSD 5
- NCES district ID
- 1700041
- Math proficiency
- 26% ▼ -14.00%
- Reading proficiency
- 36% ▼ -12.00%
- Median HH income
- $46,998
- Composite
- 26.71/100
- National rank
- #7150
- State rank
- #242 of 620 in IL
Livability — Gibson City
- Score
- 63/100
- State rank
- #777
- US rank
- #15522
Category grades
Schools grade is shown separately in the Schools card above.
Census & demographics
- Census place
- Gibson City, IL
- Population (ZIP)
- 4,260
Population outlook (Ford County) Hauer SSP2
- Today (2025)
- 13,044 people
- By 2030
- 12,607 · -3.4%
- By 2040
- 11,716 · -10.2%
- By 2050
- 10,836 · -16.9%
- By 2075
- 9,328 · -28.5%
- By 2100
- 7,803 · -40.2%
Race, ethnicity, and origin ACS 2023
- Neighborhood character
- Predominantly White (83%)
- Race & ethnicity
- White 83% Hispanic / Latino 9% Two or more races 8% Asian 2% Black 1%
- Hispanic origin (detail)
- Mexican 4%
- Common ancestry
- Lithuanian 4% Scandinavian 3% Romanian 2%
- Foreign-born
- 5% · Canada, Philippines, Guatemala
- Languages at home
- 93% English-only · Spanish 5% Other Asian/Pacific 1% French/Haitian/Cajun 1%
Political lean MEDSL · Ford
- 2024 margin
- Solid R (+47.9) · D 25.1% · R 73.0% · Other 1.9%
- 2008→2024 swing
- -18.9pp toward R · 2008: -29.0pp · 2024: -47.9pp
- All cycles
- 2024: R+47.9 2020: R+47.3 2016: R+48.7 2012: R+42.9 2008: R+29.0
Not yet ingested
- Civics
- —
Market trends
- HPI YoY
- ▼ -65.66%
- Current HPI
- 180.223
- Rent YoY
- —
- Metro
- —
- State GDP YoY
- ▲ 1.59%
- F500 in state
- 60
Industry mix (Fortune 500 HQ in IL)
| Industry | F500 HQs | Revenue |
|---|---|---|
| Insurance | 4 | $201B |
|
||
| Consumer Goods | 4 | $87B |
|
||
| Industrial Machinery | 3 | $64B |
|
||
| Healthcare | 2 | $55B |
|
||
| Retail / Pharmacy | 1 | $148B |
|
||
| Agriculture / Food | 1 | $86B |
|
||
Price history
+900.0% since first listed9 events — show timeline
- 2026-05-05 Pending — MRED as Distributed by MLS Grid
- 2026-04-24 Listed $130,000 MRED as Distributed by MLS Grid
- 2026-04-09 Listing Removed — MRED as Distributed by MLS Grid
- 2019-04-22 Sold (Public Records) $70,000 Public Records
- 2017-01-19 Listing Removed — MRED as Distributed by MLS Grid
- 2016-01-12 Listed — MRED as Distributed by MLS Grid
- 2015-11-20 Listing Removed — MRED as Distributed by MLS Grid
- 2015-07-23 Listed — MRED as Distributed by MLS Grid
- 1988-04-29 Sold (Public Records) $13,000 Public Records
Property tax history
+11.5%/yrLatest (2024): $1,593 · +15.5% YoY. Source: county tax records.
Cash-flow waterfall
monthlySold comps — $/sqft
last 12 mo · ≤1 miLoading sold comps…