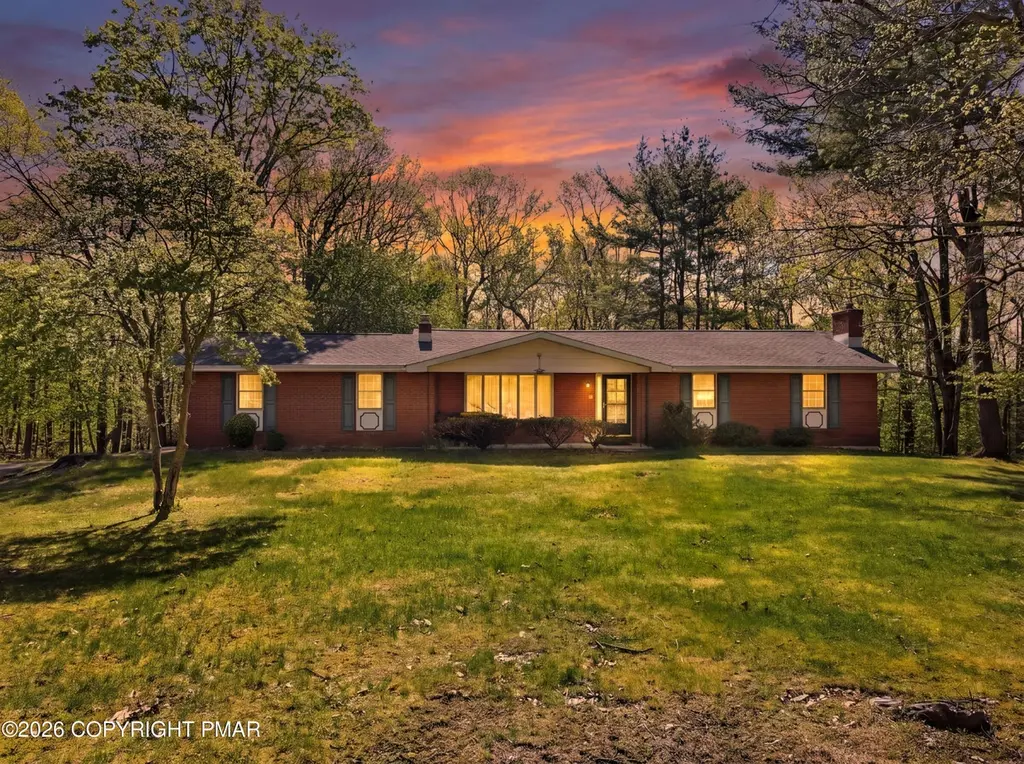
110 Powell Rd · Penn Estates, PA
Flood risk 1/10 · Minimal
- FEMA flood zone
- X (unshaded)
- Chance of flooding over 30 yrs
- 0.0%
- Est. flood insurance / yr
- $507 – $1,088
Fire risk 4/10 · Minor
- Est. fire insurance / yr
- $511 – $949
Heat risk 2/10 · Minimal
- Hot days now (above 95°F)
- 7 days/yr
- Hot days in 30 yrs
- 14 days/yr
Wind risk 4/10 · Minor
- Chance of severe wind over 30 yrs
- 11.0%
Air-quality risk 2/10 · Minimal
- Unhealthy air days now
- 1 days/yr
- Unhealthy air days in 30 yrs
- 2 days/yr
Risk factors via First Street. Map © Google.
Why this score? — see what drove the F grade
The composite is a weighted blend of 9 inputs, each scored 0–100. Each bar is that input's sub-score; the figure is the points it added to the 100-point composite (weight × sub-score).
- ARV discount +15.0/15.0
- Appreciation +5.0/10.0
- Schools +4.0/10.0
- Livability +3.4/5.0
- Rent growth +2.5/5.0
- Condition / age +2.5/5.0
- Cash flow +2.4/30.0
- 1% rule +0.0/10.0
- DSCR +0.0/10.0
$359,000
🖨 Deal sheet 📄 Offer letter ✓ Due diligence
Listing remarks
Charming old brick home situated on 2 private acres in a prime location! This spacious property features 3 bedrooms and 3 full baths, with a finished lower level offering excellent potential for extend living quatres or a mother/daughter setup. With some updating, this home can truly shine while maintaining its character and charm. Enjoy the peaceful, private setting while being just minutes from major attractions, and convenient commuter routes. A rare opportunity with endless possibilities in a highly desirable location!
Key facts
- Private acres
- Peaceful setting
- Prime location
Tags
Property features AI
Exterior
- Parking: Eight total parking spaces (includes a 2-car attached garage and six open parking spaces); Driveway; Garage door opener; Garage faces side; Paved; RV access/parking
- Utilities: Well water; Septic tank; 200+ amp electric service
- Home design: Single-family house; No common walls
- Construction: Brick construction; Asphalt roof; Full finished basement
- Exterior features: Deck; Sliding doors; Storm doors; Level, cleared and landscaped lot with front and back yard; Wooded areas; Paved surfaces; Private maintained road
Interior
- Kitchen: Range; Refrigerator; Dishwasher
- Flooring: Carpet; Hardwood; Vinyl
- Bathrooms: Three full bathrooms
- Heating & cooling: Baseboard heating; Electric heating; Propane heating; Ceiling fans
- Interior features: Eat-in kitchen; Wet bar; In-law floorplan; Basement is finished with daylight, interior and exterior entry and walk-out access; One fireplace (basement, free-standing, wood burning with propane hookup)
- Laundry & utility: Washer; Dryer; Laundry on lower level
Neighborhood map
What this means for you Summary
Snapshot
- This is a 3-bed/2.0-bath single-family listed at $359k.
Deal economics
- At list price, monthly cash flow is $-1k ($-15k/yr) — negative.
- To cash-flow at today's rent, offer at most $135k (62.3% below list).
- To meet the 1% rule (rent ≥ 1% of price), the offer needs to be $165k (54.0% below list).
- Recommended offer: $135k (62.3% below list) — sets the bar for cash-flow.
- Cap rate 2.1% vs local median 3.8% in Penn Estates — below-typical yield; the buyer is paying a premium for something (appreciation thesis, condition, location) that the cap rate doesn't capture.
Location & tenants
- Location reads 68/100 on livability (#915 in PA) — a middle-class / working-renter tenant base. Strengths: employment A+, cost of living A+, housing A+; Watch: health & safety D, schools D-, amenities F.
- Pocono Mountain SD (rural): math 37% / reading 55% proficiency, ranked #245 of 539 in PA (top 46%) — families likely to look elsewhere, expect single-tenant / working-renter base with shorter leases.
- Market conditions: 93 active listings in the ZIP; 1 comparable units currently listed for rent nearby; 278 units permitted in Monroe County in 2024 (52 in 5+ unit buildings).
Forward outlook
- In year one you build about $2k of equity ($2k loan paydown + $-62 appreciation (-0.0% local appreciation)).
- Monroe County population projected at -11% by 2050 — secular population decline; favor cash flow + early exit over multi-decade hold.
- By year 9, paydown + projected appreciation supports a ~$30k cash-out refi (75% LTV) — recoverable capital for the next deal without selling this one.
Negotiation context
- It's been on market 29 days — a 2% lower offer ($354k) is reasonable based on typical stale-listing flexibility.
Questions for the listing agent
- What do current leases actually rent for vs. the listed asking? Can we see a recent rent roll and the last 12 months of T-12 income?
- Built in 1973 — when were the roof, HVAC, electrical panel, plumbing, and water heater last replaced?
- Is there a deadline driving the sale (1031 exchange, divorce, estate, relocation)? That informs how much negotiation room exists.
- Schools are D-rated, which usually means shorter tenancies and higher turnover. Who's the typical renter profile here, and what's been the actual vacancy rate?
- The area grade is low — what's the realistic commute time and amenity access for the typical tenant pool here? Any planned neighborhood developments (good or bad) we should know about?
- What's the average days-on-market for RENTAL listings here right now (not sales)? A rising rental-DOM trend means longer vacancies and softer asking-rent achievability than the comps imply.
- What's the recent tenant-quality profile in this submarket — average credit score on applications, eviction rate, late-payment / NSF rate, and stable-employment percentage? A property-management company in the area should have these aggregated.
- How much new for-sale + rental construction is in the pipeline within 1–3 miles? Heavy new supply typically softens prices + rents 12–24 months out; constrained supply supports both.
Investment metrics
- 1% rule
- 0.46% ✗
- Cap rate
- 2.06%
- Cash-on-cash
- -15.12%
- DSCR
- 0.33
- GRM
- 18.1
CMA / ARV
- ARV (median comp)
- $443,871
- List price
- $359,000
- Delta
- -19.12%
- Verdict
- UNDERPRICED
- Comps
- 20 within 1.0 mi
Show comp detail 4 sales within ~0.75 mi
| Address | Dist | Beds/Ba | Sqft | Sold | Price | $/sf | Match |
|---|---|---|---|---|---|---|---|
| 153 Chestnut Oak Drive Dr | 0.63mi | 3/2.5 | 1,350 (-5%) | 11mo | $436,000 | $323 | 51 |
| 1108 Sylvan Ln | 0.27mi | 3/2.0 | 1,586 (+12%) | 20mo | $343,000 | $216 | 50 |
| 137 Hemlock Rd | 0.21mi | 3/3.0 | 1,248 (-12%) | 20mo | $345,000 | $276 | 50 |
| 511 Cedar Ln | 0.31mi | 4/3.0 (+1) | 1,600 (+13%) | 17mo | $301,000 | $188 | 41 |
Match score weights: distance 35% · size 25% · config 20% · recency 20%. Top-matched comps best support the ARV.
Projected returns pro-forma
-0.02% appreciation · 3.0% rent growth · sell at horizon
- IRR
- -19.8%
- Equity multiple
- 0.09×
- Total profit
- $-91,357
- Equity at exit
- $103,934
- IRR
- -13.0%
- Equity multiple
- -0.36×
- Total profit
- $-136,303
- Equity at exit
- $124,687
Cash invested: $100,520 (down + closing). Projections, not guarantees.
Landlord ↔ Tenant lean methodology
- Overall (STATE)
- 62 Landlord-Friendly
- State Pennsylvania
- 62 Landlord-Friendly · EVEN
- County
- — inherits STATE
- City
- — inherits STATE
ZIP-level market 18372
- Home prices YoY
- -0.0%
- Active inventory
- 93
- Price-to-rent
- 18.1×
Monthly cashflow live
- Estimated rent
- $1,650 medium interval (Pro) →
- Mortgage (P&I)
- −$1,883
- Tax from tax record
- −$537 /mo · $6,450/yr
- Insurance
- −$150
- HOA
- −$0
- Vacancy / Maint / Mgmt
- −$346
- Net cashflow
- $-1,266
Break-even live
UW: 25.0% down · 7.5% · 30yr · 1.5% tax · 5.0% vac · 8.0% maint · 8.0% mgmt
Financing live
Cash to close
- Down payment
- $89,750
- Closing costs
- $10,770
- Reserves months
- —
- Total cash needed
- —
Loan-product check · same deal, 3 products live
Conventional
25% down · 7.5% · 30yr
- Down + closing
- —
- Monthly P&I
- —
- Monthly cashflow
- —
- DSCR
- —
- Eligible?
- —
Personal DTI + credit; lowest rate.
DSCR
20% down · 8.5% · 30yr
- Down + closing
- —
- Monthly P&I
- —
- Monthly cashflow
- —
- DSCR
- —
- Eligible?
- —
No personal income docs; deal must DSCR.
Hard money
10% down · 12.0% · 12mo
- Down + closing
- —
- Monthly P&I
- —
- Monthly cashflow
- —
- DSCR
- —
- Eligible?
- —
Short-term bridge; refi at stabilization.
Rent comps 1 comps
| Address | Beds | Baths | Sqft | Rent | $/sqft | DOM | Units | Dist |
|---|---|---|---|---|---|---|---|---|
| 349 Shine Hill Rd Henryville, PA | 2.0 | 1.0 | 940 | $1,650 | $1.76 | 44d | 1 | 1.11mi |
Listing history 11 events
-
2026-06-14statusdays on market $359,000 Pending 29 DOM
-
2026-06-13days on market $359,000 Active 28 DOM
-
2026-06-10days on market $359,000 Active 26 DOM
-
2026-06-09days on market $359,000 Active 25 DOM
-
2026-06-08days on market $359,000 Active 24 DOM
-
2026-06-07pricedays on market $359,000 Active 23 DOM
-
2026-06-02days on market $371,500 Active 18 DOM
-
2026-06-01days on market $371,500 Active 17 DOM
-
2026-05-31days on market $371,500 Active 16 DOM
-
2026-05-30days on market $371,500 Active 15 DOM
-
2026-05-15$371,500 Active 529-char remark
ⓘ Source: listings_history table (triggers on properties + properties_extension) + one-shot
backfill from property_details.listing_events for pre-trigger history.
Tax reassessment forecast PA · Partial reset (capped growth)
- Current annual tax
- $6,450 · $537/mo
- Projected year-2 tax
- $6,450 · $537/mo
- Expected delta
- $0/yr ($0/mo · 0.0%)
ⓘ Screening estimate from a state-policy table — verify with the county assessor before closing.
Climate risk First Street
- Flood 1/10 Low FEMA zone X (unshaded) · 0% chance over 30 yrs
- Wildfire 4/10 Moderate
- Heat 2/10 Low 7 d/yr ≥95°F today · 14 d/yr by 30 yrs out
- Wind 4/10 Moderate 11% chance of damaging wind over 30 yrs
- Air quality 2/10 Low 1 unhealthy d/yr today · 2 by 30 yrs out
Nearby sold comps map
Loading sold comps map…
Walkable amenities ~0.75 mi
Loading nearby amenities…
Taxation est. · year 1
- Rental income
- $19,800
- − Mortgage interest
- −$20,110
- − Property taxes
- −$6,450
- − Insurance
- −$1,795
- − Repairs & maintenance
- −$1,584
- − Management
- −$1,584
- − Depreciation
- −$10,444
- Taxable loss
- −$22,166
- Est. tax savings @ 24.0%
- +$5,320
- After-tax cash flow
- $-9,875/yr
For passive investors: Depreciation is non-cash, so a rental often shows a tax loss while cash-flowing — sheltering income. Rental losses are passive: they offset passive income freely, and up to $25,000/yr can offset ordinary (W-2) income if you actively participate and your MAGI is under $100k (phasing out to $0 by $150k); unused losses carry forward. On sale, claimed depreciation is recaptured at up to 25%, and gains may owe capital-gains tax (a 1031 exchange can defer both). Figures are a year-1 estimate at your 24.0% rate — not tax advice; consult a CPA.
Schools (NCES district)
- District
- Pocono Mountain SD
- NCES district ID
- 4219500
- Math proficiency
- 37% ▼ -5.00%
- Reading proficiency
- 55% ▲ 1.00%
- Median HH income
- $55,317
- Composite
- 39.91/100
- National rank
- #3856
- State rank
- #245 of 539 in PA
Livability — Penn Estates
- Score
- 68/100
- State rank
- #915
- US rank
- #9917
Category grades
Schools grade is shown separately in the Schools card above.
Census & demographics
- Population (ZIP)
- 3,397
Population outlook (Monroe County) Hauer SSP2
- Today (2025)
- 164,099 people
- By 2030
- 161,412 · -1.6%
- By 2040
- 154,616 · -5.8%
- By 2050
- 146,710 · -10.6%
- By 2075
- 140,830 · -14.2%
- By 2100
- 138,472 · -15.6%
Race, ethnicity, and origin ACS 2023
- Neighborhood character
- Diverse neighborhood (Simpson 0.61)
- Race & ethnicity
- White 60% Black 11% Hispanic / Latino 10% Two or more races 8% Asian 5%
- Hispanic origin (detail)
- Puerto Rican 9%
- Common ancestry
- Romanian 7% Russian 3% Slovak 2%
- Foreign-born
- 9% · Canada
- Languages at home
- 78% English-only · Other Indo-European 12% Chinese 7% Spanish 3%
Political lean MEDSL · Monroe
- 2024 margin
- Toss-up / Even · D 49.1% · R 49.9%
- 2008→2024 swing
- -17.1pp toward R · 2008: 16.3pp · 2024: -0.8pp
- All cycles
- 2024: R+0.8 2020: D+6.4 2016: D+0.3 2012: D+14.0 2008: D+16.3
Not yet ingested
- Civics
- —
Market trends
- HPI YoY
- ▬ -0.02%
- Current HPI
- 147.7957
- Rent YoY
- —
- Metro
- —
- State GDP YoY
- ▲ 1.68%
- F500 in state
- 34
Industry mix (Fortune 500 HQ in PA)
| Industry | F500 HQs | Revenue |
|---|---|---|
| Healthcare | 2 | $309B |
|
||
| Insurance | 2 | $27B |
|
||
| Telecommunications / Media | 1 | $124B |
|
||
| Industrial Distribution | 1 | $22B |
|
||
| Financial Services | 1 | $20B |
|
||
| Chemicals / Materials | 1 | $18B |
|
||
Price history
-3.4% since first listed3 events — show timeline
- 2026-06-14 Pending — PMAR
- 2026-06-03 Price Changed $359,000 PMAR
- 2026-05-15 Listed $371,500 PMAR
Property tax history
+2.4%/yrLatest (2026): $6,450 · +2.1% YoY. Source: county tax records.
Cash-flow waterfall
monthlySold comps — $/sqft
last 12 mo · ≤1 miLoading sold comps…