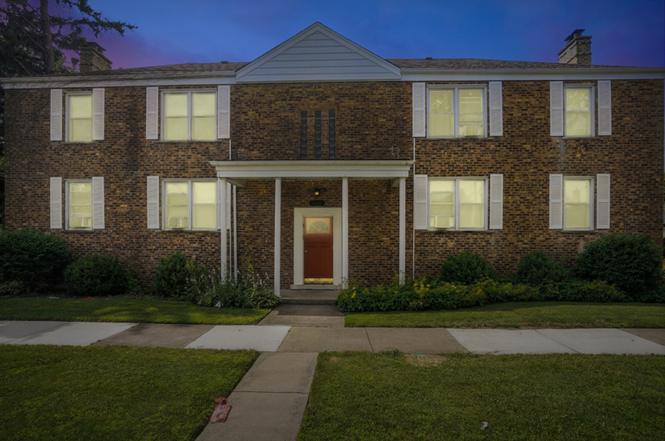
 Fourplex
3608 Jackson St · Bellwood, IL
Flood risk 3/10 · Minor
- FEMA flood zone
- X (shaded)
- Chance of flooding over 30 yrs
- 0.2%
- Est. flood insurance / yr
- $507 – $1,088
Fire risk 1/10 · Minimal
- Est. fire insurance / yr
- $804 – $1,492
Heat risk 3/10 · Minor
- Hot days now (above 101°F)
- 7 days/yr
- Hot days in 30 yrs
- 14 days/yr
Wind risk 2/10 · Minimal
- Chance of severe wind over 30 yrs
- 1.0%
Air-quality risk 4/10 · Minor
- Unhealthy air days now
- 6 days/yr
- Unhealthy air days in 30 yrs
- 7 days/yr
Risk factors via First Street. Map © Google.
Why this score? — see what drove the B- grade
The composite is a weighted blend of 9 inputs, each scored 0–100. Each bar is that input's sub-score; the figure is the points it added to the 100-point composite (weight × sub-score).
- Cash flow +30.0/30.0
- 1% rule +10.0/10.0
- DSCR +10.0/10.0
- ARV discount +7.5/15.0
- Livability +3.9/5.0
- Rent growth +2.5/5.0
- Condition / age +2.5/5.0
- Schools +1.4/10.0
- Appreciation +0.0/10.0
$499,999
🖨 Deal sheet 📄 Offer letter ✓ Due diligence
Multi-family units
County records classify this as Multi-Family (2-4 Unit). Listing-text estimate: 4 units. confirmed
Listing remarks
Beautifully maintained brick 4unit building in a prime, commuter friendly location-ideal for investors or owner occupants seeking HOME PLUS INCOME. Each apartment offers a bright, spacious layout with freshly painted interiors and refinished natural wood floors that bring warmth and character throughout. Generous sized rooms natural light fills every inch of the unit. The charming eat in kitchens are functional and inviting, making them a standout feature for tenants. The property includes onsite parking, washer and dryer hook-ups and basement storage lockers, adding convenience and rental appeal. Recent Improvements: * Tuckpointing (2025) * New asphalt parking lot (2025) * N
Key facts
- Eat in kitchens
- 4 parking spots
- Built 1951
Tags
Property features AI
Finance
- Other: 4 units in the building; Some photos are virtually staged
- Financial info: Gross income reported at $75,000; Water/sewer expense $3,600; Electric expense $300; Trash expense $2,400; Insurance expense $1,100
Exterior
- Parking: 4 parking spaces total; Assigned off-street parking with alley access; Direct access parking and parking lot; owned spaces
- Utilities: Public water; Public sewer
- Home design: Two- to four-unit property; Condo ownership; Rehab completed in 2025; Built 71–80 years ago; Built before 1978
- Construction: Brick construction; Asphalt roof; Concrete perimeter foundation
- Exterior features: Corner lot; Lot less than 0.25 acre; Commuter bus access and interstate access nearby; School bus service
Interior
- Kitchen: Each unit includes a stove and refrigerator
- Bedrooms: 8 bedrooms total; Each unit is a 2-bedroom layout
- Bathrooms: 4 full bathrooms total (1 per unit)
- Heating & cooling: Natural gas and electric heating
- Interior features: 16 total rooms; Unfinished full basement; Sidewalks and street lights in the community
- Laundry & utility: Tenants pay electric and gas (utilities paid by tenants)
Neighborhood map
What this means for you Summary
Snapshot
- This is a 4 × 2-bed/1.0-bath units multifamily listed at $500k.
Deal economics
- At list price, monthly cash flow is $3k ($30k/yr) — positive. Per door: $627/mo.
- The deal already cash-flows at list — no discount required.
- Meets the 1% rule at list price ($8k rent vs $500k).
- Recommended offer: $440k (12.0% below list) — sets the bar for market timing.
- Cap rate 12.3% vs local median 5.3% in Bellwood — top-decile yield for the area; either an underpriced asset or a hidden risk that comps aren't pricing in. Stress-test before assuming the spread holds.
Location & tenants
- Location reads 77/100 on livability (#155 in IL, #2,847 nationally) — a middle-class / working-renter tenant base. Strengths: commute A+, cost of living A+, housing A+; Watch: health & safety D+, amenities F.
- Proviso Twp Hsd 209 (suburban): math 12% / reading 17% proficiency, ranked #507 of 620 in IL (top 82%) — low school quality limits family demand, transient renter base, plan for 1-2y turnover.
- Zoned schools: Proviso West High School (math 6% / reading 11%, grade F, #584 of 693 statewide, top 85%, 1,868 students, 0% FRL).
- Market conditions: 41 active listings in the ZIP; 6,272 units permitted in Cook County in 2024 (4,658 in 5+ unit buildings).
Forward outlook
- Local home prices are declining (-3.0%/yr); year-one equity from $3k of loan paydown is wiped out by about $15k of value loss. Plan a longer hold.
- At projected returns (-3.0% appreciation + 3.0% rent growth), your $140k cash investment doubles in ~6 years — after that, you're playing with house money.
Negotiation context
- It's been on market 135 days — a 12% lower offer ($440k) is reasonable based on typical stale-listing flexibility.
- 6 sale attempts with the ask held roughly flat each time — persistent listings suggest the price (not the market) is what's stuck; bring a comps-based counter.
Risks & watch-outs
- Watch-outs: built in 1951 — expect roof / HVAC / electrical / plumbing capex.
Questions for the listing agent
- It's been on market 135 days. Have you received any prior offers? Is the seller open to a 12% concession, seller financing, or rate buy-down credit?
- Can we see the unit-by-unit rent roll, current vacancy, and any below-market leases? What's the average tenancy length?
- What capital expenditures (roof, boiler, parking lot, exteriors) have been made in the last 5 years, and what's planned in the next 2?
- Built in 1951 — when were the roof, HVAC, electrical panel, plumbing, and water heater last replaced?
- Why hasn't it sold? Are there any deal-killer items the seller is aware of (foundation, flood, title, zoning, code violations)?
- Is there a deadline driving the sale (1031 exchange, divorce, estate, relocation)? That informs how much negotiation room exists.
- Schools are F-rated, which usually means shorter tenancies and higher turnover. Who's the typical renter profile here, and what's been the actual vacancy rate?
- What's the average days-on-market for RENTAL listings here right now (not sales)? A rising rental-DOM trend means longer vacancies and softer asking-rent achievability than the comps imply.
- What's the recent tenant-quality profile in this submarket — average credit score on applications, eviction rate, late-payment / NSF rate, and stable-employment percentage? A property-management company in the area should have these aggregated.
- How much new apartment / multifamily construction is in the pipeline within 1–3 miles? Heavy new supply (>2% of stock underway) typically softens rents 12–24 months out; light construction supports rent growth.
Investment metrics
- 1% rule
- 1.51% ✓
- Cap rate
- 12.31%
- Cash-on-cash
- 21.50%
- DSCR
- 1.96
- GRM
- 5.5
CMA / ARV
No comps found within radius.
Show comp detail 3 sales within ~0.75 mi
| Address | Dist | Beds/Ba | Sqft | Sold | Price | $/sf | Match |
|---|---|---|---|---|---|---|---|
| 1013 Bellwood Ave | 0.04mi | 9/5.0 (+1) | 3,700 | 1mo | $475,000 | $128 | 76 |
| 3508 Jackson St | 0.03mi | 8/4.0 | — | 22mo | $275,000 | — | 68 |
| 633 Bellwood Ave | 0.44mi | 7/4.0 (-1) | — | 13mo | $330,000 | — | 51 |
Match score weights: distance 35% · size 25% · config 20% · recency 20%. Top-matched comps best support the ARV.
Projected returns pro-forma
-3.0% appreciation · 3.0% rent growth · sell at horizon
- IRR
- 14.1%
- Equity multiple
- 1.56×
- Total profit
- $78,849
- Equity at exit
- $74,551
- IRR
- 22.9%
- Equity multiple
- 2.96×
- Total profit
- $274,836
- Equity at exit
- $43,231
Cash invested: $140,000 (down + closing). Projections, not guarantees.
Landlord ↔ Tenant lean methodology
- Overall (STATE)
- 43 Moderately Tenant-Leaning
- State Illinois
- 43 Moderately Tenant-Leaning · D+7
- County
- — inherits STATE
- City
- — inherits STATE
ZIP-level market 60104
- Active inventory
- 41
- Price-to-rent
- 22.1×
Monthly cashflow live
- Estimated rent
- $7,549 high interval (Pro) →
- Mortgage (P&I)
- −$2,622
- Tax est. 1.5%
- −$625 /mo · $7,500/yr
- Insurance
- −$208
- HOA
- −$0
- Vacancy / Maint / Mgmt
- −$1,585
- Net cashflow
- $2,508
Break-even live
4-unit breakdown (identical units grouped — click to expand)
| Units | Beds | Baths | Est. rent |
|---|---|---|---|
| 4× units | 2 | 1 | $7,548 |
| #1 | 2 | 1 | $1,887 |
| #2 | 2 | 1 | $1,887 |
| #3 | 2 | 1 | $1,887 |
| #4 | 2 | 1 | $1,887 |
| Total (4 units) | $7,549 | ||
UW: 25.0% down · 7.5% · 30yr · 1.5% tax · 5.0% vac · 8.0% maint · 8.0% mgmt
Financing live
Cash to close
- Down payment
- $125,000
- Closing costs
- $15,000
- Reserves months
- —
- Total cash needed
- —
Loan-product check · same deal, 3 products live
Conventional
25% down · 7.5% · 30yr
- Down + closing
- —
- Monthly P&I
- —
- Monthly cashflow
- —
- DSCR
- —
- Eligible?
- —
Personal DTI + credit; lowest rate.
DSCR
20% down · 8.5% · 30yr
- Down + closing
- —
- Monthly P&I
- —
- Monthly cashflow
- —
- DSCR
- —
- Eligible?
- —
No personal income docs; deal must DSCR.
Hard money
10% down · 12.0% · 12mo
- Down + closing
- —
- Monthly P&I
- —
- Monthly cashflow
- —
- DSCR
- —
- Eligible?
- —
Short-term bridge; refi at stabilization.
Listing history 12 events
-
2026-04-16historical Contingent - Continue to Show
-
2026-04-07status Active
-
2026-04-04historical Contingent - Continue to Show
-
2026-03-21status Temporarily No Showings
-
2026-01-22historical Contingent - Continue to Show
-
2026-01-11$499,999 Active
-
2025-07-30historical
-
2025-07-06status Active
-
2025-06-28historical
-
2025-06-24status Temporarily No Showings
-
2025-06-19historical
-
2025-05-14Active
ⓘ Source: listings_history table (triggers on properties + properties_extension) + one-shot
backfill from property_details.listing_events for pre-trigger history.
Climate risk First Street
- Flood 3/10 Moderate FEMA zone X (shaded) · 20% chance over 30 yrs
- Wildfire 1/10 Low
- Heat 3/10 Moderate 7 d/yr ≥101°F today · 14 d/yr by 30 yrs out
- Wind 2/10 Low 100% chance of damaging wind over 30 yrs
- Air quality 4/10 Moderate 6 unhealthy d/yr today · 7 by 30 yrs out
Nearby sold comps map
Loading sold comps map…
Walkable amenities ~0.75 mi
Loading nearby amenities…
Taxation est. · year 1
- Rental income
- $90,588
- − Mortgage interest
- −$28,008
- − Property taxes
- −$7,500
- − Insurance
- −$2,500
- − Repairs & maintenance
- −$7,247
- − Management
- −$7,247
- − Depreciation
- −$14,545
- Taxable income
- $23,541
- Est. tax owed @ 24.0%
- −$5,650
- After-tax cash flow
- $24,450/yr
For passive investors: Depreciation is non-cash, so a rental often shows a tax loss while cash-flowing — sheltering income. Rental losses are passive: they offset passive income freely, and up to $25,000/yr can offset ordinary (W-2) income if you actively participate and your MAGI is under $100k (phasing out to $0 by $150k); unused losses carry forward. On sale, claimed depreciation is recaptured at up to 25%, and gains may owe capital-gains tax (a 1031 exchange can defer both). Figures are a year-1 estimate at your 24.0% rate — not tax advice; consult a CPA.
Schools (NCES district)
- District
- Proviso Twp Hsd 209
- NCES district ID
- 1732910
- Math proficiency
- 12% ▼ -4.00%
- Reading proficiency
- 17% ▼ -3.00%
- Median HH income
- $51,744
- Composite
- 13.5/100
- National rank
- #9518
- State rank
- #507 of 620 in IL
Livability — Bellwood
- Score
- 77/100
- State rank
- #155
- US rank
- #2847
Category grades
Schools grade is shown separately in the Schools card above.
Census & demographics
- Census place
- Bellwood, IL
- City population
- 18,390
- Population (ZIP)
- 18,390
Population outlook (Cook County) Hauer SSP2
- Today (2025)
- 5,347,519 people
- By 2030
- 5,357,703 · +0.2%
- By 2040
- 5,324,924 · -0.4%
- By 2050
- 5,230,762 · -2.2%
- By 2075
- 4,785,735 · -10.5%
- By 2100
- 4,188,836 · -21.7%
Race, ethnicity, and origin ACS 2023
- Neighborhood character
- Predominantly Black (70%)
- Race & ethnicity
- Black 70% Hispanic / Latino 23% Two or more races 7% White 4% Asian 1%
- Hispanic origin (detail)
- Mexican 18% Puerto Rican 4%
- Common ancestry
- Romanian 1%
- Foreign-born
- 10% · Canada
- Languages at home
- 78% English-only · Spanish 20% Other Indo-European 1%
Political lean MEDSL · Cook
- 2024 margin
- Solid D (+42.0) · D 70.4% · R 28.4% · Other 1.2%
- 2008→2024 swing
- -11.4pp toward R · 2008: 53.4pp · 2024: 42.0pp
- All cycles
- 2024: D+42.0 2020: D+50.3 2016: D+53.0 2012: D+49.4 2008: D+53.4
Not yet ingested
- Civics
- —
Market trends
- HPI YoY
- ▼ -212.49%
- Current HPI
- 290.8215
- Rent YoY
- —
- Metro
- —
- State GDP YoY
- ▲ 1.59%
- F500 in state
- 60
Industry mix (Fortune 500 HQ in IL)
| Industry | F500 HQs | Revenue |
|---|---|---|
| Insurance | 4 | $201B |
|
||
| Consumer Goods | 4 | $87B |
|
||
| Industrial Machinery | 3 | $64B |
|
||
| Healthcare | 2 | $55B |
|
||
| Retail / Pharmacy | 1 | $148B |
|
||
| Agriculture / Food | 1 | $86B |
|
||
Price history
12 events — show timeline
- 2026-04-16 Contingent — MRED as Distributed by MLS Grid
- 2026-04-07 Relisted — MRED as Distributed by MLS Grid
- 2026-04-04 Contingent — MRED as Distributed by MLS Grid
- 2026-03-21 Relisted — MRED as Distributed by MLS Grid
- 2026-01-22 Contingent — MRED as Distributed by MLS Grid
- 2026-01-11 Listed $499,999 MRED as Distributed by MLS Grid
- 2025-07-30 Listing Removed — MRED as Distributed by MLS Grid
- 2025-07-06 Relisted — MRED as Distributed by MLS Grid
- 2025-06-28 Listing Removed — MRED as Distributed by MLS Grid
- 2025-06-24 Relisted — MRED as Distributed by MLS Grid
- 2025-06-19 Listing Removed — MRED as Distributed by MLS Grid
- 2025-05-14 Listed — MRED as Distributed by MLS Grid
Cash-flow waterfall
monthlySold comps — $/sqft
last 12 mo · ≤1 miLoading sold comps…