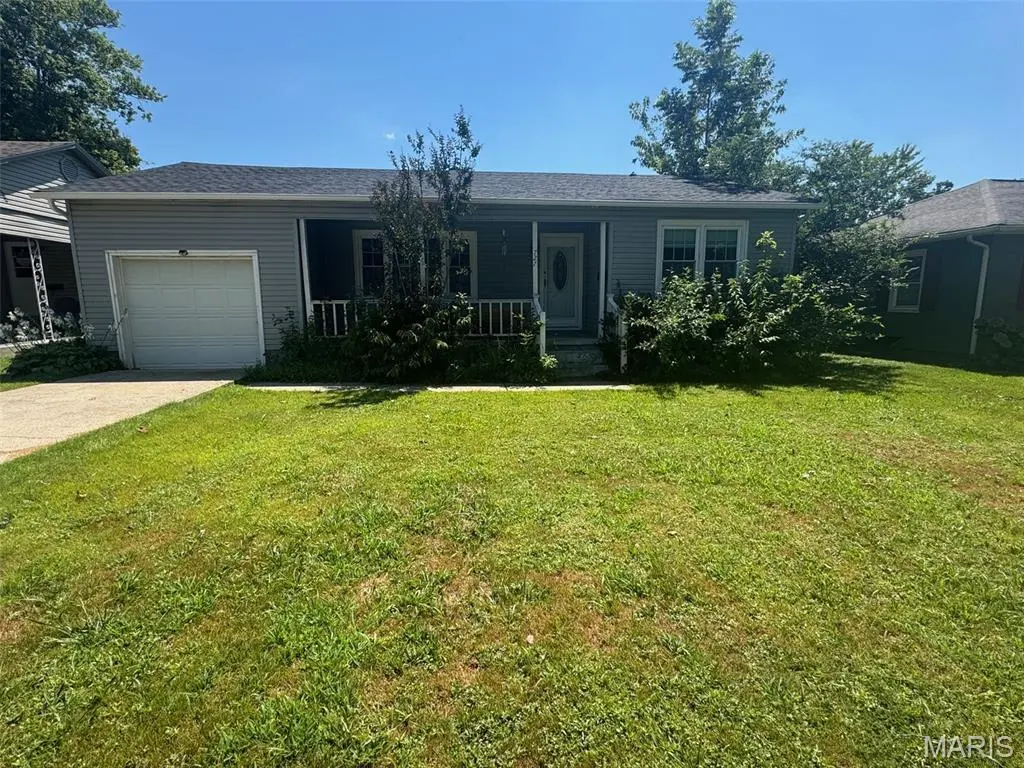
727 W Fannetta St · Dexter, MO
Flood risk 1/10 · Minimal
- FEMA flood zone
- —
- Chance of flooding over 30 yrs
- 0.0%
- Est. flood insurance / yr
- —
Fire risk 1/10 · Minimal
- Est. fire insurance / yr
- $1,054 – $1,958
Heat risk 6/10 · Moderate
- Hot days now (above 110°F)
- 7 days/yr
- Hot days in 30 yrs
- 21 days/yr
Wind risk 3/10 · Minor
- Chance of severe wind over 30 yrs
- 5.0%
Air-quality risk 1/10 · Minimal
- Unhealthy air days now
- 0 days/yr
- Unhealthy air days in 30 yrs
- 0 days/yr
Risk factors via First Street. Map © Google.
Why this score? — see what drove the D- grade
The composite is a weighted blend of 9 inputs, each scored 0–100. Each bar is that input's sub-score; the figure is the points it added to the 100-point composite (weight × sub-score).
- Cash flow +12.9/30.0
- ARV discount +7.5/15.0
- DSCR +3.9/10.0
- Schools +3.6/10.0
- Livability +3.4/5.0
- 1% rule +2.7/10.0
- Rent growth +2.5/5.0
- Condition / age +2.5/5.0
- Appreciation +0.0/10.0
$105,000
🖨 Deal sheet (PDF) 📄 Offer letter ✓ Due diligence
Listing remarks MLS
Cute 2 bedroom and 1 bath home located 3 blocks from schools. Original hardwood floors in living room and bedroom rooms. Recently up dated. 1 car garage, shop/shed also has overhead door. Great starter home or one to downsize in.
Key facts
- 1 car garage
- Shop shed
- Hardwood floors
Tags
Neighborhood map
What this means for you Summary
Snapshot
- This is a 2-bed/1.0-bath other listed at $105k.
Deal economics
- At list price, monthly cash flow is $-8 ($-92/yr) — negative.
- To cash-flow at today's rent, offer at most $104k (1.3% below list).
- To meet the 1% rule (rent ≥ 1% of price), the offer needs to be $81k (23.2% below list).
- Recommended offer: $81k (23.2% below list) — sets the bar for 1% rule.
- Cap rate 6.2% vs local median 3.7% in Dexter — top-decile yield for the area; either an underpriced asset or a hidden risk that comps aren't pricing in. Stress-test before assuming the spread holds.
Location & tenants
- Location reads 67/100 on livability (#221 in MO) — a middle-class / working-renter tenant base. Strengths: cost of living A+, housing A; Watch: health & safety C-, crime D+, employment D.
- Dexter R-XI (town): math 41% / reading 45% proficiency, ranked #120 of 324 in MO (top 37%) — families likely to look elsewhere, expect single-tenant / working-renter base with shorter leases.
- Zoned schools: Southwest Elem. (473 students, 55% FRL); T. S. Hill Middle (math 44% / reading 36%, grade F, #185 of 391 statewide, top 48%, 443 students, 48% FRL); Dexter High (math 32% / reading 62%, grade D-, #155 of 521 statewide, top 32%, 587 students, 44% FRL).
- Market conditions: 87 active listings in the ZIP; 4 comparable units currently listed for rent nearby; rentals lingering (median 46d on market — plan ~5-8 weeks vacancy on turnover, expect pricing pressure); 100% of comp listings sitting > 30 days — soft ceiling on asking rent; 17 units permitted in Stoddard County in 2024 (0 in 5+ unit buildings).
Forward outlook
- Local home prices are declining (-3.0%/yr); year-one equity from $726 of loan paydown is wiped out by about $3k of value loss. Plan a longer hold.
- Stoddard County population projected at -12% by 2050 — secular population decline; favor cash flow + early exit over multi-decade hold.
Negotiation context
- It's been on market 236 days — a 12% lower offer ($92k) is reasonable based on typical stale-listing flexibility.
- 3 sale attempts since 9y ago with the ask held roughly flat each time — persistent listings suggest the price (not the market) is what's stuck; bring a comps-based counter.
- Current owner paid $75k; 40% above their basis — modest negotiation headroom, anchor on the comps not their cost.
Risks & watch-outs
- Climate carrying-cost: extreme-heat days projected 7→21/yr by 2055 (HVAC capex compounding) — expect insurance premiums to compound above CPI over the hold.
Questions for the listing agent
- What do current leases actually rent for vs. the listed asking? Can we see a recent rent roll and the last 12 months of T-12 income?
- It's been on market 236 days. Have you received any prior offers? Is the seller open to a 23% concession, seller financing, or rate buy-down credit?
- Built in 1960 — when were the roof, HVAC, electrical panel, plumbing, and water heater last replaced?
- Why hasn't it sold? Are there any deal-killer items the seller is aware of (foundation, flood, title, zoning, code violations)?
- Is there a deadline driving the sale (1031 exchange, divorce, estate, relocation)? That informs how much negotiation room exists.
- Schools are D-rated, which usually means shorter tenancies and higher turnover. Who's the typical renter profile here, and what's been the actual vacancy rate?
- Crime grade is D in this area — have there been break-ins, vandalism, or insurance claims at this property in the last 3 years? What carrier currently insures it and at what premium?
- The area grade is low — what's the realistic commute time and amenity access for the typical tenant pool here? Any planned neighborhood developments (good or bad) we should know about?
- What's the average days-on-market for RENTAL listings here right now (not sales)? A rising rental-DOM trend means longer vacancies and softer asking-rent achievability than the comps imply.
- What's the recent tenant-quality profile in this submarket — average credit score on applications, eviction rate, late-payment / NSF rate, and stable-employment percentage? A property-management company in the area should have these aggregated.
- How much new for-sale + rental construction is in the pipeline within 1–3 miles? Heavy new supply typically softens prices + rents 12–24 months out; constrained supply supports both.
Investment metrics
- 1% rule
- 0.77% ✗
- Cap rate
- 6.21%
- Cash-on-cash
- -0.31%
- DSCR
- 0.99
- GRM
- 10.8
CMA / ARV
No comps found within radius.
Projected returns pro-forma
-3.0% appreciation · 3.0% rent growth · sell at horizon
- IRR
- -16.9%
- Equity multiple
- 0.40×
- Total profit
- $-17,542
- Equity at exit
- $15,656
- IRR
- -8.8%
- Equity multiple
- 0.45×
- Total profit
- $-16,059
- Equity at exit
- $9,078
Cash invested: $29,400 (down + closing). Projections, not guarantees.
Landlord ↔ Tenant lean methodology
- Overall (STATE)
- 81 Strongly Landlord-Friendly
- State Missouri
- 81 Strongly Landlord-Friendly · R+10
- County
- — inherits STATE
- City
- — inherits STATE
ZIP-level market 63841
- Home prices YoY
- -25.6%
- Active inventory
- 87
- Price-to-rent
- 10.8×
Monthly cashflow live
- Estimated rent
- $806 medium interval (Pro) →
- Mortgage (P&I)
- −$551
- Tax from tax record
- −$50 /mo · $605/yr
- Insurance
- −$44
- HOA
- −$0
- Vacancy / Maint / Mgmt
- −$169
- Net cashflow
- $-8
Break-even live
Sensitivity live
| Price | -10% $52 | -5% $22 | +0% $-8 | +5% $-37 | +10% $-67 |
|---|---|---|---|---|---|
| Rent | -10% $-71 | -5% $-40 | +0% $-8 | +5% $24 | +10% $56 |
| Rate | -1.0pp $45 | -0.5pp $19 | base $-8 | +0.5pp $-35 | +1.0pp $-63 |
UW: 25.0% down · 7.5% · 30yr · 1.5% tax · 5.0% vac · 8.0% maint · 8.0% mgmt
Financing live
Cash to close
- Down payment
- $26,250
- Closing costs
- $3,150
- Reserves months
- —
- Total cash needed
- —
Loan-product check · same deal, 3 products live
Conventional
25% down · 7.5% · 30yr
- Down + closing
- —
- Monthly P&I
- —
- Monthly cashflow
- —
- DSCR
- —
- Eligible?
- —
Personal DTI + credit; lowest rate.
DSCR
20% down · 8.5% · 30yr
- Down + closing
- —
- Monthly P&I
- —
- Monthly cashflow
- —
- DSCR
- —
- Eligible?
- —
No personal income docs; deal must DSCR.
Hard money
10% down · 12.0% · 12mo
- Down + closing
- —
- Monthly P&I
- —
- Monthly cashflow
- —
- DSCR
- —
- Eligible?
- —
Short-term bridge; refi at stabilization.
Rent comps 4 comps
| Address | Beds | Baths | Sqft | Rent | $/sqft | DOM | Units | Dist |
|---|---|---|---|---|---|---|---|---|
| 501 W Fannetta St Apt 12 Dexter, MO | 2.0 | 1.5 | 950 | $795 | $0.84 | 45d | 1 | 0.20mi |
| 1501 Lyndel Ct Dexter, MO | 1.0–3.0 | 1.5 | 1300 | $892 | $0.69 | 45d | 3 | 1.05mi |
| Lyndel Ct Dexter, MO | 2.0–3.0 | 1.5 | 1150 | $850 | $0.74 | 45d | 8 | 1.10mi |
| 102 N 1st St Dexter, MO | 2.0 | 1.0 | 1000 | $760 | $0.76 | 45d | 2 | 1.24mi |
Listing history 13 events
-
2026-06-04days on market $105,000 Active 236 DOM
-
2026-06-02days on market $105,000 Active 235 DOM
-
2026-06-01days on market $105,000 Active 234 DOM
-
2026-05-31days on market $105,000 Active 233 DOM
-
2026-01-23price $105,000 229-char remark
Show marketing remark (229 chars)
Cute 2 bedroom and 1 bath home located 3 blocks from schools. Original hardwood floors in living room and bedroom rooms. Recently up dated. 1 car garage, shop/shed also has overhead door. Great starter home or one to downsize in.
-
2025-10-10$110,000 Active 229-char remark
Show marketing remark (229 chars)
Cute 2 bedroom and 1 bath home located 3 blocks from schools. Original hardwood floors in living room and bedroom rooms. Recently up dated. 1 car garage, shop/shed also has overhead door. Great starter home or one to downsize in.
-
2025-08-21soldstatus
-
2025-08-18soldstatus Closed
-
2025-08-01status Pending
-
2025-07-29$79,900 Active
-
2017-06-06soldstatus
-
2017-06-05soldstatus $75,000
-
2017-04-05$72,900
ⓘ Source: listings_history table (triggers on properties + properties_extension) + one-shot
backfill from property_details.listing_events for pre-trigger history.
Tax reassessment forecast MO · Resets to sale price
- Current annual tax
- $605 · $50/mo
- Projected year-2 tax
- $1,018 · $85/mo
- Expected delta
- +$413/yr (+$34/mo · 68.3%)
ⓘ Screening estimate from a state-policy table — verify with the county assessor before closing.
Climate risk First Street
- Flood 1/10 Low 0% chance over 30 yrs
- Wildfire 1/10 Low
- Heat 6/10 Major 7 d/yr ≥110°F today · 21 d/yr by 30 yrs out
- Wind 3/10 Moderate 5% chance of damaging wind over 30 yrs
- Air quality 1/10 Low 0 unhealthy d/yr today · 0 by 30 yrs out
Nearby sold comps map
Loading sold comps map…
Walkable amenities ~0.75 mi
Loading nearby amenities…
Taxation est. · year 1
- Rental income
- $9,678
- − Mortgage interest
- −$5,882
- − Property taxes
- −$605
- − Insurance
- −$525
- − Repairs & maintenance
- −$774
- − Management
- −$774
- − Depreciation
- −$3,055
- Taxable loss
- −$1,937
- Est. tax savings @ 24.0%
- +$465
- After-tax cash flow
- $373/yr
For passive investors: Depreciation is non-cash, so a rental often shows a tax loss while cash-flowing — sheltering income. Rental losses are passive: they offset passive income freely, and up to $25,000/yr can offset ordinary (W-2) income if you actively participate and your MAGI is under $100k (phasing out to $0 by $150k); unused losses carry forward. On sale, claimed depreciation is recaptured at up to 25%, and gains may owe capital-gains tax (a 1031 exchange can defer both). Figures are a year-1 estimate at your 24.0% rate — not tax advice; consult a CPA.
Schools (NCES district)
- District
- Dexter R-XI
- NCES district ID
- 2910770
- Math proficiency
- 41% ▲ 5.00%
- Reading proficiency
- 45% ▼ -3.00%
- Median HH income
- $37,349
- Composite
- 35.76/100
- National rank
- #4846
- State rank
- #120 of 324 in MO
Livability — Dexter
- Score
- 67/100
- State rank
- #221
- US rank
- #10879
Category grades
Schools grade is shown separately in the Schools card above.
Census & demographics
- Census place
- Dexter, MO
- Population (ZIP)
- 13,319
Population outlook (Stoddard County) Hauer SSP2
- Today (2025)
- 29,096 people
- By 2030
- 28,478 · -2.1%
- By 2040
- 27,073 · -7.0%
- By 2050
- 25,512 · -12.3%
- By 2075
- 21,740 · -25.3%
- By 2100
- 17,841 · -38.7%
Race, ethnicity, and origin ACS 2023
- Neighborhood character
- Predominantly White (92%)
- Race & ethnicity
- White 92% Two or more races 4% Hispanic / Latino 3%
- Common ancestry
- Iranian 5% Serbian 1% Slovak 1%
- Foreign-born
- 1% · China
- Languages at home
- 99% English-only · Spanish 1%
Political lean MEDSL · Stoddard
- 2024 margin
- Solid R (+73.9) · D 12.8% · R 86.7%
- 2008→2024 swing
- -34.1pp toward R · 2008: -39.8pp · 2024: -73.9pp
- All cycles
- 2024: R+73.9 2020: R+72.0 2016: R+69.3 2012: R+49.3 2008: R+39.8
Not yet ingested
- Civics
- —
Market trends
- HPI YoY
- ▼ -49.94%
- Current HPI
- 145.4225
- Rent YoY
- —
- Metro
- —
- State GDP YoY
- ▲ 1.84%
- F500 in state
- 20
Industry mix (Fortune 500 HQ in MO)
| Industry | F500 HQs | Revenue |
|---|---|---|
| Healthcare | 1 | $163B |
|
||
| Insurance | 1 | $21B |
|
||
| Industrial Technology | 1 | $17B |
|
||
| Retail | 1 | $16B |
|
||
| Industrial Distribution | 1 | $10B |
|
||
| Utilities | 1 | $9B |
|
||
Price history
+44.0% since first listed9 events — show timeline
- 2026-01-23 Price Changed $105,000 MARIS as Distributed by MLS Grid
- 2025-10-10 Listed $110,000 MARIS as Distributed by MLS Grid
- 2025-08-21 Sold (Public Records) — Public Records
- 2025-08-18 Sold (MLS) — MARIS as Distributed by MLS Grid
- 2025-08-01 Pending — MARIS as Distributed by MLS Grid
- 2025-07-29 Listed $79,900 MARIS as Distributed by MLS Grid
- 2017-06-06 Sold (Public Records) — Public Records
- 2017-06-05 Sold (MLS) $75,000 CARMLS
- 2017-04-05 Listed $72,900 CARMLS
Property tax history
+4.7%/yrLatest (2025): $605 · +23.8% YoY. Source: county tax records.
Cash-flow waterfall
monthlySold comps — $/sqft
last 12 mo · ≤1 miLoading sold comps…