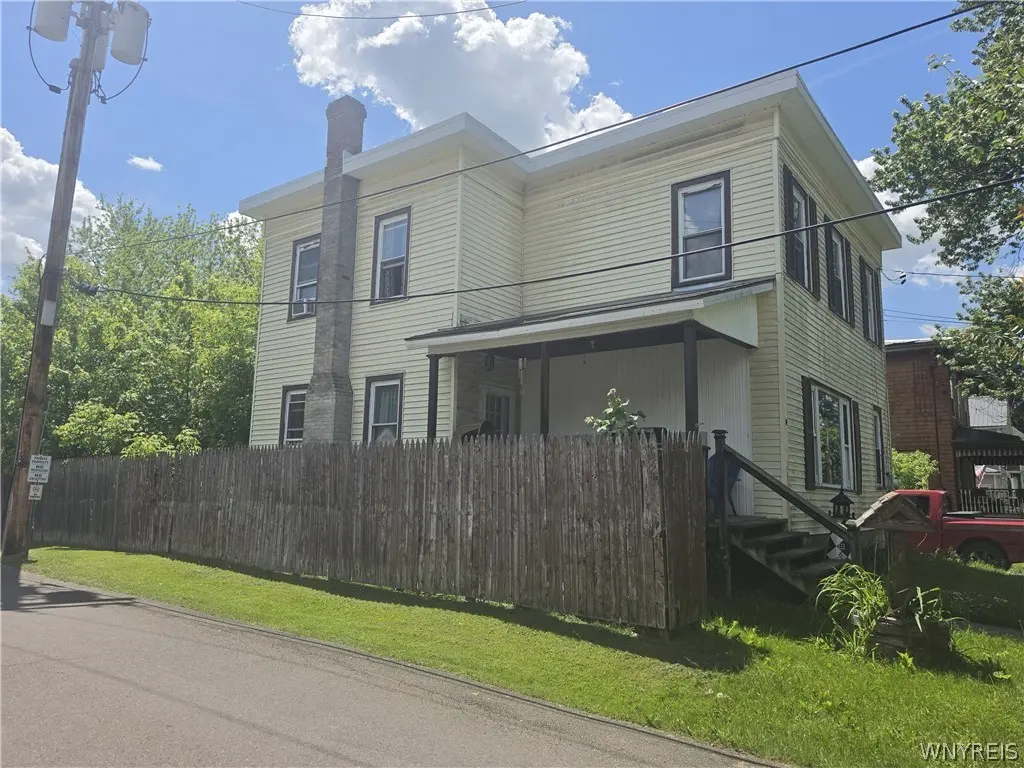
9 Keeler Ave · Moravia, NY
Flood risk 1/10 · Minimal
- FEMA flood zone
- AE
- Chance of flooding over 30 yrs
- 0.0%
- Est. flood insurance / yr
- $2,026 – $9,024
Fire risk 1/10 · Minimal
- Est. fire insurance / yr
- $691 – $1,283
Heat risk 3/10 · Minor
- Hot days now (above 92°F)
- 8 days/yr
- Hot days in 30 yrs
- 17 days/yr
Wind risk 1/10 · Minimal
- Chance of severe wind over 30 yrs
- 1.0%
Air-quality risk 2/10 · Minimal
- Unhealthy air days now
- 0 days/yr
- Unhealthy air days in 30 yrs
- 1 days/yr
Risk factors via First Street. Map © Google.
Why this score? — see what drove the A grade
The composite is a weighted blend of 9 inputs, each scored 0–100. Each bar is that input's sub-score; the figure is the points it added to the 100-point composite (weight × sub-score).
- Cash flow +30.0/30.0
- ARV discount +15.0/15.0
- 1% rule +10.0/10.0
- DSCR +10.0/10.0
- Appreciation +10.0/10.0
- Schools +4.2/10.0
- Livability +3.6/5.0
- Rent growth +2.5/5.0
- Condition / age +2.5/5.0
$154,900
🖨 Deal sheet 📄 Offer letter ✓ Due diligence
Listing remarks MLS
Newly updated four bedroom, two bath home located on a quiet side street in the village of Moravia. The tall ceilings and large windows combined with spacious rooms make this home feel light open and airy. Beautiful hardwood floors, updated kitchen, covered porch, privacy fence, low maintenance yard, sun deck, high efficiency furnace, newer windows and water heater, wine chiller fridge, pellet stove, formal dinning room and eat in kitchen are just some of the perks of this beautiful home. Call for a viewing appointment so you can see for yourself.
Key facts
- Formal dining room
- Newer roof
- Eat-in kitchen
Tags
Property features AI
Exterior
- Parking: No garage
- Utilities: Public water (connected/available); Public sewer (connected/available); Electric service with circuit breakers
- Home design: Two-story house; Resale property; Rectangular residential lot; Road frontage on a city street
- Construction: Frame construction with vinyl siding; Copper plumbing; Asphalt shingle roof; Block and stone foundation; Originally existing (year built: existing)
- Exterior features: Deck; Fence (partial); Blacktop driveway; Gravel driveway
Interior
- Kitchen: Built-in range; Built-in oven; Refrigerator; Eat-in kitchen layout
- Bedrooms: Main-level bedroom (1 on main level); Second-floor bedrooms (2 listed on second floor); Basement bedroom (1 in basement)
- Flooring: Hardwood; Vinyl; Varies
- Bathrooms: Two full bathrooms total; One full bathroom on the main level
- Heating & cooling: Central air conditioning; Forced air heating; Wood heating; Electric heating
- Interior features: Ceiling fans; Separate/formal dining room; Entrance foyer; Eat-in kitchen; Separate/formal living room; Natural woodwork; Thermal windows; Has full basement
- Laundry & utility: Electric water heater
Neighborhood map
What this means for you Summary
Snapshot
- This is a 4-bed/2.5-bath single-family listed at $155k.
Deal economics
- At list price, monthly cash flow is $276 ($3k/yr) — positive.
- The deal already cash-flows at list — no discount required.
- Meets the 1% rule at list price ($3k rent vs $155k).
- Cap rate 12.0% vs local median 5.7% in Moravia — top-decile yield for the area; either an underpriced asset or a hidden risk that comps aren't pricing in. Stress-test before assuming the spread holds.
Location & tenants
- Location reads 72/100 on livability (#357 in NY) — a middle-class / working-renter tenant base. Strengths: cost of living A+, housing A+, health & safety A+; Watch: schools D+, amenities F, commute F.
- Moravia Central School District (rural): math 42% / reading 56% proficiency, ranked #391 of 590 in NY (top 66%) — families likely to look elsewhere, expect single-tenant / working-renter base with shorter leases.
- Market conditions: 28 active listings in the ZIP; 161 units permitted in Cayuga County in 2024 (65 in 5+ unit buildings).
Forward outlook
- In year one you build about $17k of equity ($1k loan paydown + $15k appreciation (10.0% local appreciation)).
- Cayuga County population projected at -18% by 2050 — secular population decline; favor cash flow + early exit over multi-decade hold.
- At projected returns (10.0% appreciation + 3.0% rent growth), your $43k cash investment doubles in ~3 years — after that, you're playing with house money.
- By year 3, paydown + projected appreciation supports a ~$42k cash-out refi (75% LTV) — recoverable capital for the next deal without selling this one.
Negotiation context
- Only 10 days on market — expect competitive offers; lowballing is unlikely to land.
- 6 sale attempts since 17y ago with the ask held roughly flat each time — persistent listings suggest the price (not the market) is what's stuck; bring a comps-based counter.
- Current owner paid $106k; 46% above their basis — modest negotiation headroom, anchor on the comps not their cost.
Risks & watch-outs
- Watch-outs: property tax is 3.3% of price; flood insurance adds $460/mo; built in 1900 — expect roof / HVAC / electrical / plumbing capex.
- Climate carrying-cost: in FEMA flood zone AE (mandatory federal flood insurance) — expect insurance premiums to compound above CPI over the hold.
Questions for the listing agent
- Built in 1900 — when were the roof, HVAC, electrical panel, plumbing, and water heater last replaced?
- Property tax is high relative to price — has the assessment been appealed recently, and will the sale trigger a re-assessment?
- What's the actual annual flood-insurance premium (NFIP or private), and is the property in a SFHA with mandatory coverage?
- Is there a deadline driving the sale (1031 exchange, divorce, estate, relocation)? That informs how much negotiation room exists.
- Schools are D-rated, which usually means shorter tenancies and higher turnover. Who's the typical renter profile here, and what's been the actual vacancy rate?
- What's the average days-on-market for RENTAL listings here right now (not sales)? A rising rental-DOM trend means longer vacancies and softer asking-rent achievability than the comps imply.
- What's the recent tenant-quality profile in this submarket — average credit score on applications, eviction rate, late-payment / NSF rate, and stable-employment percentage? A property-management company in the area should have these aggregated.
- How much new for-sale + rental construction is in the pipeline within 1–3 miles? Heavy new supply typically softens prices + rents 12–24 months out; constrained supply supports both.
Investment metrics
- 1% rule
- 1.66% ✓
- Cap rate
- 12.00%
- Cash-on-cash
- 20.38%
- DSCR
- 1.91
- GRM
- 5.0
CMA / ARV
- ARV (on-the-fly)
- $213,542
- Comps found
- 6
Show comp detail 6 sales within ~0.75 mi
| Address | Dist | Beds/Ba | Sqft | Sold | Price | $/sf | Match |
|---|---|---|---|---|---|---|---|
| 25 Smith St | 0.32mi | 4/1.0 | 2,214 (+2%) | 8mo | $165,000 | $75 | 70 |
| 194 N Main St | 0.14mi | 4/1.0 | 2,094 (-4%) | 16mo | $91,350 | $44 | 68 |
| 50 Church St | 0.52mi | 4/2.0 | 2,184 (+0%) | 7mo | $215,000 | $98 | 68 |
| 23 W Cayuga St | 0.10mi | 3/2.0 (-1) | 1,860 (-15%) | 4mo | $177,319 | $95 | 60 |
| 17 Church St | 0.32mi | 4/2.0 | 2,368 (+9%) | 23mo | $249,900 | $106 | 49 |
| 1888 State Route 38a | 0.49mi | 3/2.0 (-1) | 1,863 (-14%) | 5mo | $255,000 | $137 | 42 |
Match score weights: distance 35% · size 25% · config 20% · recency 20%. Top-matched comps best support the ARV.
Projected returns pro-forma
10.0% appreciation · 3.0% rent growth · sell at horizon
- IRR
- 30.0%
- Equity multiple
- 3.36×
- Total profit
- $102,421
- Equity at exit
- $139,546
- IRR
- 26.0%
- Equity multiple
- 7.66×
- Total profit
- $288,695
- Equity at exit
- $300,937
Cash invested: $43,372 (down + closing). Projections, not guarantees.
Landlord ↔ Tenant lean methodology
- Overall (STATE)
- 15 Strongly Tenant-Friendly
- State New York
- 15 Strongly Tenant-Friendly · D+10
- County
- — inherits STATE
- City
- — inherits STATE
ZIP-level market 13118
- Home prices YoY
- 29.3%
- Active inventory
- 28
- Price-to-rent
- 5.0×
Monthly cashflow live
- Estimated rent
- $2,577 medium interval (Pro) →
- Mortgage (P&I)
- −$812
- Tax from tax record
- −$422 /mo · $5,068/yr
- Insurance
- −$65
- Flood insurance flood zone
- −$460 /mo · $5,525/yr
- HOA
- −$0
- Vacancy / Maint / Mgmt
- −$541
- Net cashflow
- $276
Break-even live
UW: 25.0% down · 7.5% · 30yr · 1.5% tax · 5.0% vac · 8.0% maint · 8.0% mgmt
Financing live
Cash to close
- Down payment
- $38,725
- Closing costs
- $4,647
- Reserves months
- —
- Total cash needed
- —
Loan-product check · same deal, 3 products live
Conventional
25% down · 7.5% · 30yr
- Down + closing
- —
- Monthly P&I
- —
- Monthly cashflow
- —
- DSCR
- —
- Eligible?
- —
Personal DTI + credit; lowest rate.
DSCR
20% down · 8.5% · 30yr
- Down + closing
- —
- Monthly P&I
- —
- Monthly cashflow
- —
- DSCR
- —
- Eligible?
- —
No personal income docs; deal must DSCR.
Hard money
10% down · 12.0% · 12mo
- Down + closing
- —
- Monthly P&I
- —
- Monthly cashflow
- —
- DSCR
- —
- Eligible?
- —
Short-term bridge; refi at stabilization.
Listing history 8 events
-
2026-06-19days on market $154,900 Active 10 DOM
-
2026-06-18days on market $154,900 Active 9 DOM
-
2026-06-17days on market $154,900 Active 8 DOM
-
2026-06-16days on market $154,900 Active 7 DOM
-
2026-06-15days on market $154,900 Active 6 DOM
-
2026-06-14days on market $154,900 Active 4 DOM
-
2026-06-12remarks 699-char remark
-
2026-06-12$154,900 Active 3 DOM
ⓘ Source: listings_history table (triggers on properties + properties_extension) + one-shot
backfill from property_details.listing_events for pre-trigger history.
Tax reassessment forecast NY · Partial reset (capped growth)
- Current annual tax
- $5,068 · $422/mo
- Projected year-2 tax
- $5,068 · $422/mo
- Expected delta
- $0/yr ($0/mo · 0.0%)
ⓘ Screening estimate from a state-policy table — verify with the county assessor before closing.
Climate risk First Street
- Flood 1/10 Low FEMA zone AE · 0% chance over 30 yrs
- Wildfire 1/10 Low
- Heat 3/10 Moderate 8 d/yr ≥92°F today · 17 d/yr by 30 yrs out
- Wind 1/10 Low 100% chance of damaging wind over 30 yrs
- Air quality 2/10 Low 0 unhealthy d/yr today · 1 by 30 yrs out
Nearby sold comps map
Loading sold comps map…
Walkable amenities ~0.75 mi
Loading nearby amenities…
Taxation est. · year 1
- Rental income
- $30,925
- − Mortgage interest
- −$8,677
- − Property taxes
- −$5,068
- − Insurance
- −$6,300
- − Repairs & maintenance
- −$2,474
- − Management
- −$2,474
- − Depreciation
- −$4,506
- Taxable income
- $1,426
- Est. tax owed @ 24.0%
- −$342
- After-tax cash flow
- $2,973/yr
For passive investors: Depreciation is non-cash, so a rental often shows a tax loss while cash-flowing — sheltering income. Rental losses are passive: they offset passive income freely, and up to $25,000/yr can offset ordinary (W-2) income if you actively participate and your MAGI is under $100k (phasing out to $0 by $150k); unused losses carry forward. On sale, claimed depreciation is recaptured at up to 25%, and gains may owe capital-gains tax (a 1031 exchange can defer both). Figures are a year-1 estimate at your 24.0% rate — not tax advice; consult a CPA.
Schools (NCES district)
- District
- Moravia Central School District
- NCES district ID
- 3619800
- Math proficiency
- 42% ▼ -2.00%
- Reading proficiency
- 56% ▲ 9.00%
- Median HH income
- $55,991
- Composite
- 42.47/100
- National rank
- #3215
- State rank
- #391 of 590 in NY
Livability — Moravia
- Score
- 72/100
- State rank
- #357
- US rank
- #6025
Category grades
Schools grade is shown separately in the Schools card above.
Census & demographics
- Census place
- Moravia, NY
- Population (ZIP)
- 5,514
Population outlook (Cayuga County) Hauer SSP2
- Today (2025)
- 74,820 people
- By 2030
- 72,402 · -3.2%
- By 2040
- 66,917 · -10.6%
- By 2050
- 61,007 · -18.5%
- By 2075
- 48,047 · -35.8%
- By 2100
- 34,512 · -53.9%
Race, ethnicity, and origin ACS 2023
- Neighborhood character
- Predominantly White (87%)
- Race & ethnicity
- White 87% Black 6% Two or more races 4% Hispanic / Latino 3%
- Common ancestry
- Romanian 3% Iranian 3% Lithuanian 2%
- Foreign-born
- 1%
- Languages at home
- 98% English-only · Spanish 1%
Political lean MEDSL · Cayuga
- 2024 margin
- R (+13.0) · D 43.5% · R 56.5%
- 2008→2024 swing
- -21.5pp toward R · 2008: 8.5pp · 2024: -13.0pp
- All cycles
- 2024: R+13.0 2020: R+9.2 2016: R+13.2 2012: D+10.8 2008: D+8.5
Not yet ingested
- Civics
- —
Market trends
- HPI YoY
- ▲ 82.97%
- Current HPI
- 366.5746
- Rent YoY
- —
- Metro
- —
- State GDP YoY
- ▲ 2.60%
- F500 in state
- 92
Industry mix (Fortune 500 HQ in NY)
| Industry | F500 HQs | Revenue |
|---|---|---|
| Financial Services | 10 | $950B |
|
||
| Consumer Goods | 9 | $162B |
|
||
| Insurance | 4 | $225B |
|
||
| Telecommunications | 2 | $144B |
|
||
| Pharmaceuticals | 2 | $112B |
|
||
| Media / Entertainment | 2 | $69B |
|
||
Price history
+434.1% since first listed16 events — show timeline
- 2026-06-09 Listed $154,900 WNYREIS
- 2017-10-10 Sold (Public Records) $106,000 Public Records
- 2017-10-09 Sold (MLS) $106,000 UNYREIS
- 2017-08-14 Sold (MLS) $106,000 IBRMLS
- 2017-06-30 Pending — UNYREIS
- 2017-06-16 Contingent — UNYREIS
- 2017-04-06 Price Changed $106,000 UNYREIS
- 2017-01-18 Listed $110,000 IBRMLS
- 2017-01-03 Listed $110,000 UNYREIS
- 2016-08-16 Listing Removed — CNYIS
- 2016-07-14 Listed $129,000 CNYIS
- 2016-05-14 Price Changed $129,000 WNYREIS
- 2016-01-06 Listed $129,000 IBRMLS
- 2009-12-03 Listed $124,900 IBRMLS
- 2005-05-06 Sold (Public Records) $97,900 Public Records
- 2004-06-15 Sold (Public Records) $29,000 Public Records
Property tax history
+5.2%/yrLatest (2025): $5,068 · +5.7% YoY. Source: county tax records.
Cash-flow waterfall
monthlySold comps — $/sqft
last 12 mo · ≤1 miLoading sold comps…