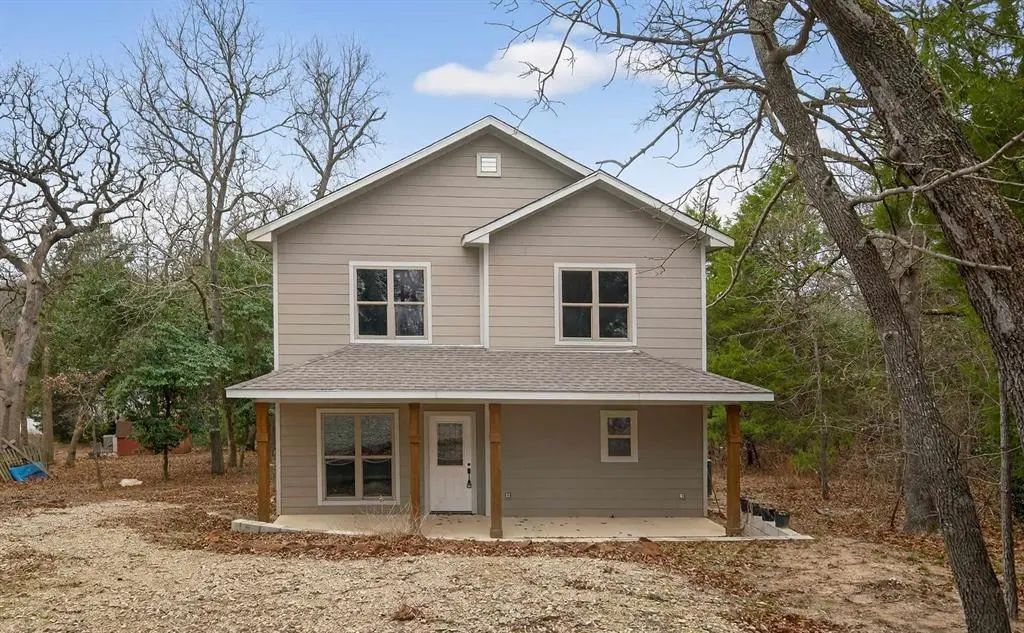
469 Holly Gln · Callender Lake, TX
Flood risk 1/10 · Minimal
- FEMA flood zone
- X (unshaded)
- Chance of flooding over 30 yrs
- 0.0%
- Est. flood insurance / yr
- $507 – $1,088
Fire risk 4/10 · Minor
- Est. fire insurance / yr
- $1,222 – $2,270
Heat risk 7/10 · Major
- Hot days now (above 109°F)
- 7 days/yr
- Hot days in 30 yrs
- 26 days/yr
Wind risk 6/10 · Moderate
- Chance of severe wind over 30 yrs
- 60.0%
Air-quality risk 2/10 · Minimal
- Unhealthy air days now
- 0 days/yr
- Unhealthy air days in 30 yrs
- 1 days/yr
Risk factors via First Street. Map © Google.
Why this score? — see what drove the D- grade
The composite is a weighted blend of 9 inputs, each scored 0–100. Each bar is that input's sub-score; the figure is the points it added to the 100-point composite (weight × sub-score).
- ARV discount +15.0/15.0
- Appreciation +7.3/10.0
- Cash flow +5.1/30.0
- Schools +3.5/10.0
- Livability +2.6/5.0
- Rent growth +2.5/5.0
- Condition / age +2.5/5.0
- 1% rule +1.1/10.0
- DSCR +0.0/10.0
$215,900
🖨 Deal sheet (PDF) 📄 Offer letter ✓ Due diligence
Listing remarks MLS
Welcome to this beautiful newly built two-story home nestled in the peaceful Callender Lake community. Featuring 3bedrooms and 2 full bathrooms, this thoughtfully designed upstairs/downstairs layout offers both comfort and functionality. This home sits on a spacious . 22-acre lot providing plenty of room for outdoor enjoyment or future additions. This move inready new construction is perfect for homeowners ADDITIONAL PICTURES
Key facts
- New construction
- Spacious lot
- Outdoor enjoyment
Tags
Neighborhood map
What this means for you Summary
Snapshot
- This is a 3-bed/2.0-bath single-family listed at $216k.
Deal economics
- At list price, monthly cash flow is $-495 ($-6k/yr) — negative.
- To cash-flow at today's rent, offer at most $144k (33.2% below list).
- To meet the 1% rule (rent ≥ 1% of price), the offer needs to be $131k (39.3% below list).
- Recommended offer: $131k (39.3% below list) — sets the bar for 1% rule.
Location & tenants
- Location reads 52/100 on livability (#1,447 in TX) — a working-class tenant base; expect higher turnover. Strengths: cost of living A+, crime A; Watch: amenities F, commute F, housing F.
- Van ISD (rural): math 40% / reading 42% proficiency, ranked #390 of 826 in TX (top 47%) — families likely to look elsewhere, expect single-tenant / working-renter base with shorter leases.
- Zoned schools: Van H S (math 47% / reading 47%, grade D-, #591 of 1,632 statewide, top 38%, 793 students, 52% FRL) — zoned schools at 52% FRL track the district average.
- Market conditions: 110 active listings in the ZIP; 54 units permitted in Van Zandt County in 2024 (0 in 5+ unit buildings).
Forward outlook
- In year one you build about $11k of equity ($1k loan paydown + $10k appreciation (4.6% local appreciation)).
- Van Zandt County population projected at +4% by 2050 — modest demand growth; plan on rents tracking national, not racing it.
- By year 4, paydown + projected appreciation supports a ~$39k cash-out refi (75% LTV) — recoverable capital for the next deal without selling this one.
Negotiation context
- It's been on market 123 days — a 12% lower offer ($190k) is reasonable based on typical stale-listing flexibility.
- 7 sale attempts since 2y ago with the ask held roughly flat each time — persistent listings suggest the price (not the market) is what's stuck; bring a comps-based counter.
Risks & watch-outs
- Climate carrying-cost: major wind risk, 60% chance of damaging wind over 30y; extreme-heat days projected 7→26/yr by 2055 (HVAC capex compounding) — expect insurance premiums to compound above CPI over the hold.
Questions for the listing agent
- What do current leases actually rent for vs. the listed asking? Can we see a recent rent roll and the last 12 months of T-12 income?
- It's been on market 123 days. Have you received any prior offers? Is the seller open to a 39% concession, seller financing, or rate buy-down credit?
- What does the HOA fee cover, when was the last increase, and are there any pending special assessments or reserve-fund shortfalls?
- Why hasn't it sold? Are there any deal-killer items the seller is aware of (foundation, flood, title, zoning, code violations)?
- Is there a deadline driving the sale (1031 exchange, divorce, estate, relocation)? That informs how much negotiation room exists.
- Schools are F-rated, which usually means shorter tenancies and higher turnover. Who's the typical renter profile here, and what's been the actual vacancy rate?
- The area grade is low — what's the realistic commute time and amenity access for the typical tenant pool here? Any planned neighborhood developments (good or bad) we should know about?
- What's the average days-on-market for RENTAL listings here right now (not sales)? A rising rental-DOM trend means longer vacancies and softer asking-rent achievability than the comps imply.
- What's the recent tenant-quality profile in this submarket — average credit score on applications, eviction rate, late-payment / NSF rate, and stable-employment percentage? A property-management company in the area should have these aggregated.
- How much new for-sale + rental construction is in the pipeline within 1–3 miles? Heavy new supply typically softens prices + rents 12–24 months out; constrained supply supports both.
Investment metrics
- 1% rule
- 0.61% ✗
- Cap rate
- 3.54%
- Cash-on-cash
- -9.82%
- DSCR
- 0.56
- GRM
- 13.7
CMA / ARV
- ARV (median comp)
- $292,151
- List price
- $215,900
- Delta
- -26.10%
- Verdict
- UNDERPRICED
- Comps
- 20 within 1.0 mi
Show comp detail 3 sales within ~0.75 mi
| Address | Dist | Beds/Ba | Sqft | Sold | Price | $/sf | Match |
|---|---|---|---|---|---|---|---|
| 412 Terrapin Rd | 0.13mi | 3/2.0 | 2,101 (0%) | 24mo | $488,000 | $232 | 74 |
| 239 Callender Lake Dr | 0.59mi | 3/2.0 | 1,909 (-9%) | 11mo | $400,000 | $210 | 48 |
| 371 Callender Lake Dr | 0.28mi | 3/3.5 | 2,400 (+14%) | 24mo | $544,000 | $227 | 37 |
Match score weights: distance 35% · size 25% · config 20% · recency 20%. Top-matched comps best support the ARV.
Projected returns pro-forma
4.59% appreciation · 3.0% rent growth · sell at horizon
- IRR
- 3.5%
- Equity multiple
- 1.22×
- Total profit
- $13,264
- Equity at exit
- $117,008
- IRR
- 6.4%
- Equity multiple
- 2.16×
- Total profit
- $69,962
- Equity at exit
- $197,658
Cash invested: $60,452 (down + closing). Projections, not guarantees.
Landlord ↔ Tenant lean methodology
- Overall (STATE)
- 87 Strongly Landlord-Friendly
- State Texas
- 87 Strongly Landlord-Friendly · R+5
- County
- — inherits STATE
- City
- — inherits STATE
ZIP-level market 75778
- Home prices YoY
- 2.2%
- Active inventory
- 110
- Price-to-rent
- 13.7×
Monthly cashflow live
- Estimated rent
- $1,312 medium interval (Pro) →
- Mortgage (P&I)
- −$1,132
- Tax est. 1.5%
- −$270 /mo · $3,238/yr
- Insurance
- −$90
- HOA
- −$39
- Vacancy / Maint / Mgmt
- −$275
- Net cashflow
- $-495
Break-even live
Sensitivity live
| Price | -10% $-346 | -5% $-420 | +0% $-495 | +5% $-570 | +10% $-644 |
|---|---|---|---|---|---|
| Rent | -10% $-599 | -5% $-547 | +0% $-495 | +5% $-443 | +10% $-391 |
| Rate | -1.0pp $-386 | -0.5pp $-440 | base $-495 | +0.5pp $-551 | +1.0pp $-608 |
UW: 25.0% down · 7.5% · 30yr · 1.5% tax · 5.0% vac · 8.0% maint · 8.0% mgmt
Financing live
Cash to close
- Down payment
- $53,975
- Closing costs
- $6,477
- Reserves months
- —
- Total cash needed
- —
Loan-product check · same deal, 3 products live
Conventional
25% down · 7.5% · 30yr
- Down + closing
- —
- Monthly P&I
- —
- Monthly cashflow
- —
- DSCR
- —
- Eligible?
- —
Personal DTI + credit; lowest rate.
DSCR
20% down · 8.5% · 30yr
- Down + closing
- —
- Monthly P&I
- —
- Monthly cashflow
- —
- DSCR
- —
- Eligible?
- —
No personal income docs; deal must DSCR.
Hard money
10% down · 12.0% · 12mo
- Down + closing
- —
- Monthly P&I
- —
- Monthly cashflow
- —
- DSCR
- —
- Eligible?
- —
Short-term bridge; refi at stabilization.
HOA detail
- Monthly dues
- $39 · $468/yr
Listing history 17 events
-
2026-05-31days on market $215,900 Active 123 DOM
-
2026-05-30days on market $215,900 Active 122 DOM
-
2026-02-06$215,900 Active 429-char remark
Show marketing remark (429 chars)
Welcome to this beautiful newly built two-story home nestled in the peaceful Callender Lake community. Featuring 3bedrooms and 2 full bathrooms, this thoughtfully designed upstairs/downstairs layout offers both comfort and functionality. This home sits on a spacious . 22-acre lot providing plenty of room for outdoor enjoyment or future additions. This move inready new construction is perfect for homeowners ADDITIONAL PICTURES
-
2026-01-28$215,900 Active 411-char remark
Show marketing remark (411 chars)
Welcome to this beautiful newly built two-story home nestled in the peaceful Callender Lake community. Featuring 3 bedrooms and 2 full bathrooms, this thoughtfully designed upstairs/downstairs layout offers both comfort and functionality. This home sits on a spacious . 22-acre lot providing plenty of room for outdoor enjoyment or future additions. This move in ready new construction is perfect for homeowners
-
2026-01-26$215,900 Active
-
2026-01-12historical
-
2025-08-27price $219,999
-
2025-07-12$224,999 Active
-
2024-11-29historical
-
2024-09-15price $259,000
-
2024-07-01price $269,910
-
2024-05-29$299,900 Active
-
2024-04-15price $275,000
-
2024-04-15price $275,000
-
2024-03-25$285,000 Active
-
2024-03-14price $285,000
-
2024-02-08$290,000 Active
ⓘ Source: listings_history table (triggers on properties + properties_extension) + one-shot
backfill from property_details.listing_events for pre-trigger history.
Climate risk First Street
- Flood 1/10 Low FEMA zone X (unshaded) · 0% chance over 30 yrs
- Wildfire 4/10 Moderate
- Heat 7/10 Severe 7 d/yr ≥109°F today · 26 d/yr by 30 yrs out
- Wind 6/10 Major 60% chance of damaging wind over 30 yrs
- Air quality 2/10 Low 0 unhealthy d/yr today · 1 by 30 yrs out
Nearby sold comps map
Loading sold comps map…
Walkable amenities ~0.75 mi
Loading nearby amenities…
Taxation est. · year 1
- Rental income
- $15,738
- − Mortgage interest
- −$12,094
- − Property taxes
- −$3,238
- − Insurance
- −$1,080
- − Repairs & maintenance
- −$1,259
- − Management
- −$1,259
- − HOA
- −$468
- − Depreciation
- −$6,281
- Taxable loss
- −$9,940
- Est. tax savings @ 24.0%
- +$2,386
- After-tax cash flow
- $-3,554/yr
For passive investors: Depreciation is non-cash, so a rental often shows a tax loss while cash-flowing — sheltering income. Rental losses are passive: they offset passive income freely, and up to $25,000/yr can offset ordinary (W-2) income if you actively participate and your MAGI is under $100k (phasing out to $0 by $150k); unused losses carry forward. On sale, claimed depreciation is recaptured at up to 25%, and gains may owe capital-gains tax (a 1031 exchange can defer both). Figures are a year-1 estimate at your 24.0% rate — not tax advice; consult a CPA.
Schools (NCES district)
- District
- Van ISD
- NCES district ID
- 4843920
- Math proficiency
- 40% ▼ -8.00%
- Reading proficiency
- 42% ▼ -5.00%
- Median HH income
- $44,308
- Composite
- 34.78/100
- National rank
- #5120
- State rank
- #390 of 826 in TX
Livability — Callender Lake
- Score
- 52/100
- State rank
- #1447
- US rank
- #24766
Category grades
Schools grade is shown separately in the Schools card above.
Census & demographics
- Census place
- Callender Lake, TX
- Population (ZIP)
- 2,987
Population outlook (Van Zandt County) Hauer SSP2
- Today (2025)
- 55,634 people
- By 2030
- 56,479 · +1.5%
- By 2040
- 57,672 · +3.7%
- By 2050
- 57,913 · +4.1%
- By 2075
- 57,544 · +3.4%
- By 2100
- 52,659 · -5.3%
Race, ethnicity, and origin ACS 2023
- Neighborhood character
- Predominantly White (80%)
- Race & ethnicity
- White 80% Black 9% Two or more races 8% Hispanic / Latino 4%
- Common ancestry
- Slovak 2% Portuguese 1% Serbian 1%
- Foreign-born
- 2% · Canada
- Languages at home
- 97% English-only · Spanish 3%
Political lean MEDSL · Van Zandt
- 2024 margin
- Solid R (+74.8) · D 12.3% · R 87.2%
- 2008→2024 swing
- -19.8pp toward R · 2008: -55.1pp · 2024: -74.8pp
- All cycles
- 2024: R+74.8 2020: R+72.1 2016: R+72.1 2012: R+66.6 2008: R+55.1
Not yet ingested
- Civics
- —
Market trends
- HPI YoY
- ▲ 4.59%
- Current HPI
- 216.4151
- Rent YoY
- —
- Metro
- —
- State GDP YoY
- ▲ 3.95%
- F500 in state
- 110
Industry mix (Fortune 500 HQ in TX)
| Industry | F500 HQs | Revenue |
|---|---|---|
| Energy | 16 | $1,198B |
|
||
| Technology | 5 | $198B |
|
||
| Engineering / Construction | 4 | $72B |
|
||
| Energy Services | 3 | $60B |
|
||
| Utilities | 3 | $41B |
|
||
| Healthcare | 2 | $330B |
|
||
Price history
-25.6% since first listed15 events — show timeline
- 2026-02-06 Listed $215,900 HCBOR
- 2026-01-28 Listed $215,900 GTAR
- 2026-01-26 Listed $215,900 NTREIS
- 2026-01-12 Listing Removed — NTREIS
- 2025-08-27 Price Changed $219,999 NTREIS
- 2025-07-12 Listed $224,999 NTREIS
- 2024-11-29 Listing Removed — NTREIS
- 2024-09-15 Price Changed $259,000 NTREIS
- 2024-07-01 Price Changed $269,910 NTREIS
- 2024-05-29 Listed $299,900 NTREIS
- 2024-04-15 Price Changed $275,000 GTAR
- 2024-04-15 Price Changed $275,000 HCBOR
- 2024-03-25 Listed $285,000 GTAR
- 2024-03-14 Price Changed $285,000 HCBOR
- 2024-02-08 Listed $290,000 HCBOR
Cash-flow waterfall
monthlySold comps — $/sqft
last 12 mo · ≤1 miLoading sold comps…