335 Woodland Dr · Madison, WV
Flood risk 1/10 · Minimal
- FEMA flood zone
- X (unshaded)
- Chance of flooding over 30 yrs
- 0.0%
- Est. flood insurance / yr
- $473 – $860
Fire risk 6/10 · Moderate
- Est. fire insurance / yr
- $787 – $1,461
Heat risk 5/10 · Moderate
- Hot days now (above 99°F)
- 7 days/yr
- Hot days in 30 yrs
- 21 days/yr
Wind risk 2/10 · Minimal
- Chance of severe wind over 30 yrs
- 1.0%
Air-quality risk 1/10 · Minimal
- Unhealthy air days now
- 0 days/yr
- Unhealthy air days in 30 yrs
- 0 days/yr
Risk factors via First Street. Map © Google.
Why this score? — see what drove the D+ grade
The composite is a weighted blend of 9 inputs, each scored 0–100. Each bar is that input's sub-score; the figure is the points it added to the 100-point composite (weight × sub-score).
- ARV discount +11.5/15.0
- Appreciation +10.0/10.0
- Cash flow +9.2/30.0
- 1% rule +3.2/10.0
- Livability +3.0/5.0
- DSCR +2.6/10.0
- Schools +2.6/10.0
- Rent growth +2.5/5.0
- Condition / age +2.5/5.0
$149,900
🖨 Deal sheet (PDF) 📄 Offer letter ✓ Due diligence
Listing remarks
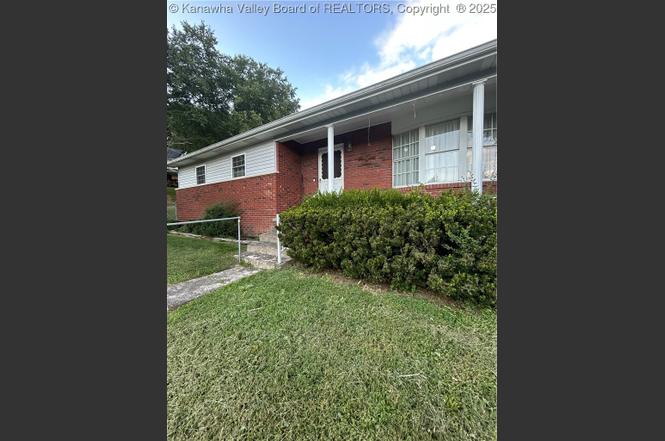
LOCATION and PRICE DUCTION!! Motivated Sellers!! Metal ROOF only a few months old. Make your appointment to view this 1851 sg ft home offering 3 bedroom 2 bath on Large lot. If you like retro you will love this well built home on a corner lot. A unique sunken living room - with Bay window. Family room with sliding doors to a deck that overlooks the neighborhood. Dining room also has sliding doors to a back deck. Extra room can be den or another bedroom. Flooring allowance of $5,000. at closing. One car attached garage. Metal Roof put on in February $5,000. in flooring allowance to buyer at closing- In established neighborhood. Convenient to schools, churches and shopping. 25 minutes to Cha
Key facts
- Large lot
- Sunken living room
- Bay window
Tags
Property features AI
Exterior
- Parking: Garage with 1 parking space
- Utilities: Public water; Public sewer
- Home design: Single-family residence; One story
- Construction: Brick and vinyl siding exterior; Metal roof
- Exterior features: Deck; Fenced yard
Interior
- Kitchen: Electric range; Refrigerator
- Bedrooms: Total rooms: 8
- Flooring: Carpet
- Bathrooms: 2 full bathrooms
- Heating & cooling: Electric heating with forced air; Electric cooling
- Interior features: Insulated windows; No basement
Neighborhood map
What this means for you Summary
Snapshot
- This is a 3-bed/2.0-bath single-family listed at $150k.
Deal economics
- At list price, monthly cash flow is $-113 ($-1k/yr) — negative.
- To cash-flow at today's rent, offer at most $130k (13.3% below list).
- To meet the 1% rule (rent ≥ 1% of price), the offer needs to be $123k (17.9% below list).
- Recommended offer: $123k (17.9% below list) — sets the bar for 1% rule.
Location & tenants
- Location reads 60/100 on livability (#217 in WV) — a middle-class / working-renter tenant base. Strengths: cost of living A+, crime A, housing A-; Watch: amenities F, commute F, employment F.
- Boone County Schools (rural): math 26% / reading 36% proficiency, ranked #26 of 55 in WV (top 47%) — families likely to look elsewhere, expect single-tenant / working-renter base with shorter leases.
- Zoned schools: Madison Elementary (math 22% / reading 32%, grade F, #261 of 377 statewide, top 75%, 273 students, 0% FRL); Madison Middle School (math 18% / reading 30%, grade F, #89 of 109 statewide, top 82%, 442 students, 0% FRL); Scott High School (math 17% / reading 37%, grade F, #79 of 110 statewide, top 78%, 529 students, 0% FRL) — zoned schools average 0% FRL vs 43% district-wide (43 pts lower); this property's tenant base skews higher-income than the district average.
- Market conditions: 17 active listings in the ZIP; 4 units permitted in Boone County in 2024 (0 in 5+ unit buildings).
Forward outlook
- In year one you build about $16k of equity ($1k loan paydown + $15k appreciation (10.0% local appreciation)).
- Boone County population projected at -34% by 2050 — secular population decline; favor cash flow + early exit over multi-decade hold.
- By year 3, paydown + projected appreciation supports a ~$41k cash-out refi (75% LTV) — recoverable capital for the next deal without selling this one.
Negotiation context
- It's been on market 271 days — a 12% lower offer ($132k) is reasonable based on typical stale-listing flexibility.
- Current owner paid $75k; list at $150k implies a 100% gain — meaningful room to come down on a strong offer.
Risks & watch-outs
- Climate carrying-cost: major wildfire risk; extreme-heat days projected 7→21/yr by 2055 (HVAC capex compounding) — expect insurance premiums to compound above CPI over the hold.
Questions for the listing agent
- What do current leases actually rent for vs. the listed asking? Can we see a recent rent roll and the last 12 months of T-12 income?
- It's been on market 271 days. Have you received any prior offers? Is the seller open to a 18% concession, seller financing, or rate buy-down credit?
- Built in 1973 — when were the roof, HVAC, electrical panel, plumbing, and water heater last replaced?
- Why hasn't it sold? Are there any deal-killer items the seller is aware of (foundation, flood, title, zoning, code violations)?
- Is there a deadline driving the sale (1031 exchange, divorce, estate, relocation)? That informs how much negotiation room exists.
- Schools are F-rated, which usually means shorter tenancies and higher turnover. Who's the typical renter profile here, and what's been the actual vacancy rate?
- The area grade is low — what's the realistic commute time and amenity access for the typical tenant pool here? Any planned neighborhood developments (good or bad) we should know about?
- What's the average days-on-market for RENTAL listings here right now (not sales)? A rising rental-DOM trend means longer vacancies and softer asking-rent achievability than the comps imply.
- What's the recent tenant-quality profile in this submarket — average credit score on applications, eviction rate, late-payment / NSF rate, and stable-employment percentage? A property-management company in the area should have these aggregated.
- How much new for-sale + rental construction is in the pipeline within 1–3 miles? Heavy new supply typically softens prices + rents 12–24 months out; constrained supply supports both.
Investment metrics
- 1% rule
- 0.82% ✗
- Cap rate
- 5.39%
- Cash-on-cash
- -3.22%
- DSCR
- 0.86
- GRM
- 10.2
CMA / ARV
- ARV (on-the-fly)
- $164,352
- Comps found
- 4
Show comp detail 4 sales within ~0.75 mi
| Address | Dist | Beds/Ba | Sqft | Sold | Price | $/sf | Match |
|---|---|---|---|---|---|---|---|
| 474 Third St | 0.57mi | 3/1.5 | 1,770 (+3%) | 2mo | $172,000 | $97 | 64 |
| 311 Reservoir Rd | 0.66mi | 3/2.5 | 1,664 (-3%) | 2mo | $159,000 | $96 | 61 |
| 25 Hickory Ln | 0.16mi | 3/2.0 | 1,929 (+13%) | 15mo | $170,000 | $88 | 59 |
| 8 Madison Ave | 0.59mi | 3/1.5 | 1,757 (+3%) | 21mo | $80,260 | $46 | 49 |
Match score weights: distance 35% · size 25% · config 20% · recency 20%. Top-matched comps best support the ARV.
Projected returns pro-forma
10.0% appreciation · 3.0% rent growth · sell at horizon
- IRR
- 22.0%
- Equity multiple
- 2.78×
- Total profit
- $74,517
- Equity at exit
- $135,042
- IRR
- 19.8%
- Equity multiple
- 6.36×
- Total profit
- $225,175
- Equity at exit
- $291,223
Cash invested: $41,972 (down + closing). Projections, not guarantees.
Landlord ↔ Tenant lean methodology
- Overall (STATE)
- 83 Strongly Landlord-Friendly
- State West Virginia
- 83 Strongly Landlord-Friendly · R+22
- County
- — inherits STATE
- City
- — inherits STATE
ZIP-level market 25130
- Home prices YoY
- 7.3%
- Active inventory
- 17
- Price-to-rent
- 10.2×
Monthly cashflow live
- Estimated rent
- $1,230 medium interval (Pro) →
- Mortgage (P&I)
- −$786
- Tax from tax record
- −$236 /mo · $2,830/yr
- Insurance
- −$62
- HOA
- −$0
- Vacancy / Maint / Mgmt
- −$258
- Net cashflow
- $-113
Break-even live
Sensitivity live
| Price | -10% $-28 | -5% $-70 | +0% $-113 | +5% $-155 | +10% $-197 |
|---|---|---|---|---|---|
| Rent | -10% $-210 | -5% $-161 | +0% $-113 | +5% $-64 | +10% $-15 |
| Rate | -1.0pp $-37 | -0.5pp $-74 | base $-113 | +0.5pp $-151 | +1.0pp $-191 |
UW: 25.0% down · 7.5% · 30yr · 1.5% tax · 5.0% vac · 8.0% maint · 8.0% mgmt
Financing live
Cash to close
- Down payment
- $37,475
- Closing costs
- $4,497
- Reserves months
- —
- Total cash needed
- —
Loan-product check · same deal, 3 products live
Conventional
25% down · 7.5% · 30yr
- Down + closing
- —
- Monthly P&I
- —
- Monthly cashflow
- —
- DSCR
- —
- Eligible?
- —
Personal DTI + credit; lowest rate.
DSCR
20% down · 8.5% · 30yr
- Down + closing
- —
- Monthly P&I
- —
- Monthly cashflow
- —
- DSCR
- —
- Eligible?
- —
No personal income docs; deal must DSCR.
Hard money
10% down · 12.0% · 12mo
- Down + closing
- —
- Monthly P&I
- —
- Monthly cashflow
- —
- DSCR
- —
- Eligible?
- —
Short-term bridge; refi at stabilization.
Listing history 6 events
-
2026-05-16status Pending
-
2026-04-01price $149,900
-
2026-02-17price $159,900
-
2025-10-15price $165,000
-
2025-08-18$182,500 Active
-
1990-02-22soldstatus $75,000
ⓘ Source: listings_history table (triggers on properties + properties_extension) + one-shot
backfill from property_details.listing_events for pre-trigger history.
Tax reassessment forecast WV · Resets to sale price
- Current annual tax
- $2,830 · $236/mo
- Projected year-2 tax
- $2,830 · $236/mo
- Expected delta
- $0/yr ($0/mo · 0.0%)
ⓘ Screening estimate from a state-policy table — verify with the county assessor before closing.
Climate risk First Street
- Flood 1/10 Low FEMA zone X (unshaded) · 0% chance over 30 yrs
- Wildfire 6/10 Major
- Heat 5/10 Major 7 d/yr ≥99°F today · 21 d/yr by 30 yrs out
- Wind 2/10 Low 100% chance of damaging wind over 30 yrs
- Air quality 1/10 Low 0 unhealthy d/yr today · 0 by 30 yrs out
Nearby sold comps map
Loading sold comps map…
Walkable amenities ~0.75 mi
Loading nearby amenities…
Taxation est. · year 1
- Rental income
- $14,761
- − Mortgage interest
- −$8,397
- − Property taxes
- −$2,830
- − Insurance
- −$750
- − Repairs & maintenance
- −$1,181
- − Management
- −$1,181
- − Depreciation
- −$4,361
- Taxable loss
- −$3,937
- Est. tax savings @ 24.0%
- +$945
- After-tax cash flow
- $-406/yr
For passive investors: Depreciation is non-cash, so a rental often shows a tax loss while cash-flowing — sheltering income. Rental losses are passive: they offset passive income freely, and up to $25,000/yr can offset ordinary (W-2) income if you actively participate and your MAGI is under $100k (phasing out to $0 by $150k); unused losses carry forward. On sale, claimed depreciation is recaptured at up to 25%, and gains may owe capital-gains tax (a 1031 exchange can defer both). Figures are a year-1 estimate at your 24.0% rate — not tax advice; consult a CPA.
Schools (NCES district)
- District
- Boone County Schools
- NCES district ID
- 5400090
- Math proficiency
- 26% ▼ -10.00%
- Reading proficiency
- 36% ▼ -7.00%
- Median HH income
- $39,554
- Composite
- 26.0/100
- National rank
- #7318
- State rank
- #26 of 55 in WV
Livability — Madison
- Score
- 60/100
- State rank
- #217
- US rank
- #19138
Category grades
Schools grade is shown separately in the Schools card above.
Census & demographics
- Census place
- Madison, WV
- Population (ZIP)
- 3,347
Population outlook (Boone County) Hauer SSP2
- Today (2025)
- 20,544 people
- By 2030
- 19,019 · -7.4%
- By 2040
- 16,026 · -22.0%
- By 2050
- 13,482 · -34.4%
- By 2075
- 8,854 · -56.9%
- By 2100
- 6,046 · -70.6%
Race, ethnicity, and origin ACS 2023
- Neighborhood character
- Predominantly White (95%)
- Race & ethnicity
- White 95% Black 2% Two or more races 1%
- Common ancestry
- Scottish 2% Serbian 2% Italian 1%
- Foreign-born
- 1% · China, Canada
- Languages at home
- 99% English-only · Chinese 1% Spanish 0%
Political lean MEDSL · Boone
- 2024 margin
- Solid R (+57.4) · D 20.1% · R 77.5% · Other 2.3%
- 2008→2024 swing
- -68.1pp toward R · 2008: 10.7pp · 2024: -57.4pp
- All cycles
- 2024: R+57.4 2020: R+53.0 2016: R+54.3 2012: R+31.3 2008: D+10.7
Not yet ingested
- Civics
- —
Market trends
- HPI YoY
- ▲ 10.81%
- Current HPI
- 158.1346
- Rent YoY
- —
- Metro
- —
- State GDP YoY
- —
- F500 in state
- 0
Price history
+99.9% since first listed6 events — show timeline
- 2026-05-16 Pending — KVBOR
- 2026-04-01 Price Changed $149,900 KVBOR
- 2026-02-17 Price Changed $159,900 KVBOR
- 2025-10-15 Price Changed $165,000 KVBOR
- 2025-08-18 Listed $182,500 KVBOR
- 1990-02-22 Sold (Public Records) $75,000 Public Records
Property tax history
+20.5%/yrLatest (2025): $2,830 · +0.8% YoY. Source: county tax records.
Cash-flow waterfall
monthlySold comps — $/sqft
last 12 mo · ≤1 miLoading sold comps…