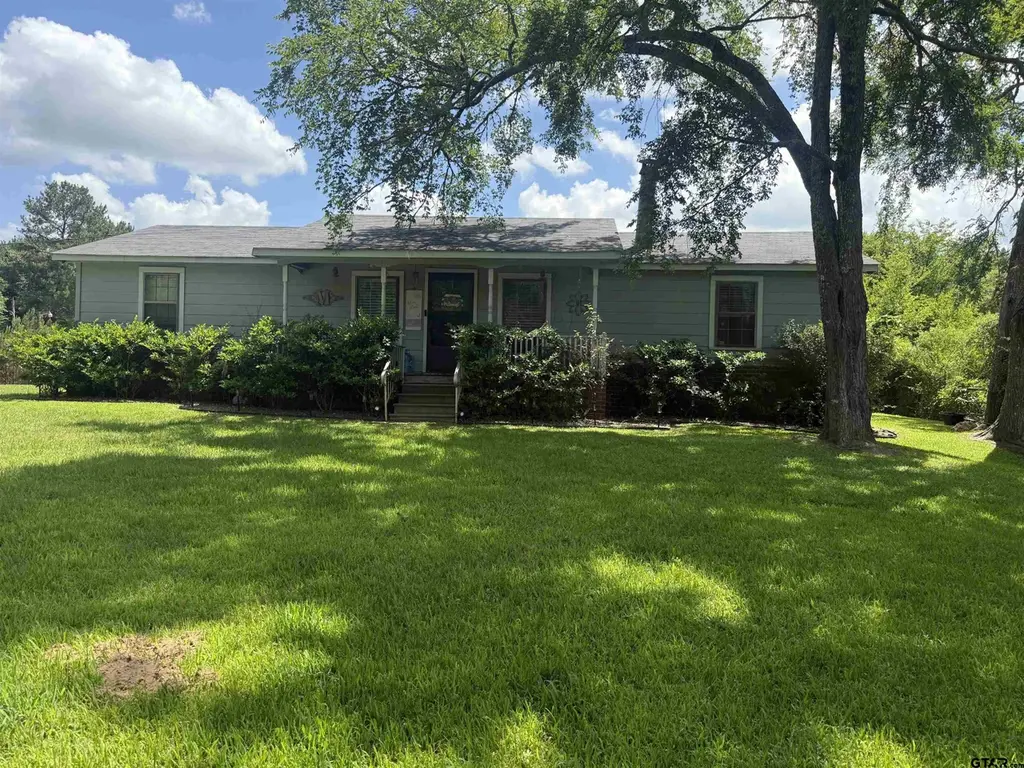
3901 Almond Rd · Big Sandy, TX
Flood risk 1/10 · Minimal
- FEMA flood zone
- X (unshaded)
- Chance of flooding over 30 yrs
- 0.0%
- Est. flood insurance / yr
- $507 – $1,088
Fire risk 5/10 · Moderate
- Est. fire insurance / yr
- $1,222 – $2,270
Heat risk 7/10 · Major
- Hot days now (above 111°F)
- 7 days/yr
- Hot days in 30 yrs
- 25 days/yr
Wind risk 6/10 · Moderate
- Chance of severe wind over 30 yrs
- 52.0%
Air-quality risk 2/10 · Minimal
- Unhealthy air days now
- 1 days/yr
- Unhealthy air days in 30 yrs
- 2 days/yr
Risk factors via First Street. Map © Google.
Why this score? — see what drove the C- grade
The composite is a weighted blend of 9 inputs, each scored 0–100. Each bar is that input's sub-score; the figure is the points it added to the 100-point composite (weight × sub-score).
- Cash flow +20.9/30.0
- ARV discount +7.5/15.0
- DSCR +6.6/10.0
- 1% rule +5.3/10.0
- Schools +3.6/10.0
- Livability +3.2/5.0
- Rent growth +2.5/5.0
- Condition / age +2.5/5.0
- Appreciation +0.0/10.0
$120,000
🖨 Deal sheet 📄 Offer letter ✓ Due diligence
Listing remarks MLS
Updated and move in ready !!!! Quiet country living. 2/2 on over 1/2 acre. Partial pipe fence. Relax on the covered back deck mornings and evenings with great view of neighbors pond! Plenty of storage and closet space. Fruit trees line the drive. Close to Gladewater in Big Sandy ISD. New Roof, New paint, New flooring ! Don't miss this one !
Key facts
- Front porch
- Backyard
- Pond views
Tags
Property features AI
Finance
- Other: Lot size approximately 0.53 acres
Exterior
- Utilities: Public water and sewer information not provided
- Home design: Single-family detached residence; One story
- Construction: Composition roof
- Exterior features: Front porch
Interior
- Kitchen: Dishwasher; Electric oven; Electric range
- Bathrooms: 2 full bathrooms
- Heating & cooling: Central heating (electric); Central air; Ceiling fans
- Interior features: Dishwasher; Electric oven; Electric range; Wood-burning fireplace
Neighborhood map
What this means for you Summary
Snapshot
- This is a 2-bed/2.0-bath single-family listed at $120k.
Deal economics
- At list price, monthly cash flow is $167 ($2k/yr) — positive.
- The deal already cash-flows at list — no discount required.
- Meets the 1% rule at list price ($1k rent vs $120k).
Location & tenants
- Location reads 65/100 on livability (#710 in TX) — a middle-class / working-renter tenant base. Strengths: cost of living A+, housing A-; Watch: amenities F, commute F, employment F.
- Big Sandy ISD (rural): math 44% / reading 41% proficiency, ranked #330 of 826 in TX (top 40%) — families likely to look elsewhere, expect single-tenant / working-renter base with shorter leases.
- Zoned schools: Big Sandy El (math 42% / reading 47%, grade F, #1,155 of 4,322 statewide, top 29%, 337 students, 77% FRL); Big Sandy J H (math 52% / reading 37%, grade D, #491 of 1,662 statewide, top 31%, 145 students, 71% FRL); Big Sandy H S (math 24% / reading 44%, grade F, #963 of 1,632 statewide, top 61%, 189 students, 62% FRL).
- Market conditions: 101 active listings in the ZIP; 34 units permitted in Upshur County in 2024 (0 in 5+ unit buildings).
Forward outlook
- Local home prices are declining (-3.0%/yr); year-one equity from $830 of loan paydown is wiped out by about $4k of value loss. Plan a longer hold.
- Upshur County population projected at +9% by 2050 — modest demand growth; plan on rents tracking national, not racing it.
Negotiation context
- Only 11 days on market — expect competitive offers; lowballing is unlikely to land.
- 2 sale attempts since 10y ago; this cycle's ask has dropped $9k (7%) from the opening price — seller is motivated, your offer sets the floor, not the list.
Risks & watch-outs
- Climate carrying-cost: major wind risk, 52% chance of damaging wind over 30y; moderate wildfire risk; extreme-heat days projected 7→25/yr by 2055 (HVAC capex compounding) — expect insurance premiums to compound above CPI over the hold.
Questions for the listing agent
- Is there a deadline driving the sale (1031 exchange, divorce, estate, relocation)? That informs how much negotiation room exists.
- Schools are D-rated, which usually means shorter tenancies and higher turnover. Who's the typical renter profile here, and what's been the actual vacancy rate?
- What's the average days-on-market for RENTAL listings here right now (not sales)? A rising rental-DOM trend means longer vacancies and softer asking-rent achievability than the comps imply.
- What's the recent tenant-quality profile in this submarket — average credit score on applications, eviction rate, late-payment / NSF rate, and stable-employment percentage? A property-management company in the area should have these aggregated.
- How much new for-sale + rental construction is in the pipeline within 1–3 miles? Heavy new supply typically softens prices + rents 12–24 months out; constrained supply supports both.
Investment metrics
- 1% rule
- 1.03% ✓
- Cap rate
- 7.96%
- Cash-on-cash
- 5.95%
- DSCR
- 1.26
- GRM
- 8.1
CMA / ARV
No comps found within radius.
Projected returns pro-forma
-3.0% appreciation · 3.0% rent growth · sell at horizon
- IRR
- -7.1%
- Equity multiple
- 0.74×
- Total profit
- $-8,825
- Equity at exit
- $17,892
- IRR
- 2.5%
- Equity multiple
- 1.18×
- Total profit
- $6,016
- Equity at exit
- $10,375
Cash invested: $33,600 (down + closing). Projections, not guarantees.
Landlord ↔ Tenant lean methodology
- Overall (STATE)
- 87 Strongly Landlord-Friendly
- State Texas
- 87 Strongly Landlord-Friendly · R+5
- County
- — inherits STATE
- City
- — inherits STATE
ZIP-level market 75755
- Home prices YoY
- -18.6%
- Active inventory
- 101
- Price-to-rent
- 8.1×
Monthly cashflow live
- Estimated rent
- $1,241 medium interval (Pro) →
- Mortgage (P&I)
- −$629
- Tax from tax record
- −$134 /mo · $1,611/yr
- Insurance
- −$50
- HOA
- −$0
- Vacancy / Maint / Mgmt
- −$261
- Net cashflow
- $167
Break-even live
UW: 25.0% down · 7.5% · 30yr · 1.5% tax · 5.0% vac · 8.0% maint · 8.0% mgmt
Financing live
Cash to close
- Down payment
- $30,000
- Closing costs
- $3,600
- Reserves months
- —
- Total cash needed
- —
Loan-product check · same deal, 3 products live
Conventional
25% down · 7.5% · 30yr
- Down + closing
- —
- Monthly P&I
- —
- Monthly cashflow
- —
- DSCR
- —
- Eligible?
- —
Personal DTI + credit; lowest rate.
DSCR
20% down · 8.5% · 30yr
- Down + closing
- —
- Monthly P&I
- —
- Monthly cashflow
- —
- DSCR
- —
- Eligible?
- —
No personal income docs; deal must DSCR.
Hard money
10% down · 12.0% · 12mo
- Down + closing
- —
- Monthly P&I
- —
- Monthly cashflow
- —
- DSCR
- —
- Eligible?
- —
Short-term bridge; refi at stabilization.
Listing history 9 events
-
2026-06-15pricestatusdays on market $120,000 Pending 11 DOM
-
2026-06-13days on market $129,000 Active 10 DOM
-
2026-06-12days on market $129,000 Active 9 DOM
-
2026-06-09days on market $129,000 Active 6 DOM
-
2026-06-08days on market $129,000 Active 5 DOM
-
2026-06-08days on market $129,000 Active 4 DOM
-
2026-06-05days on market $129,000 Active 2 DOM
-
2026-06-04remarks 515-char remark
-
2026-06-04$129,000 Active 1 DOM
ⓘ Source: listings_history table (triggers on properties + properties_extension) + one-shot
backfill from property_details.listing_events for pre-trigger history.
Tax reassessment forecast TX · Resets to sale price
- Current annual tax
- $1,611 · $134/mo
- Projected year-2 tax
- $2,196 · $183/mo
- Expected delta
- +$585/yr (+$49/mo · 36.3%)
ⓘ Screening estimate from a state-policy table — verify with the county assessor before closing.
Climate risk First Street
- Flood 1/10 Low FEMA zone X (unshaded) · 0% chance over 30 yrs
- Wildfire 5/10 Major
- Heat 7/10 Severe 7 d/yr ≥111°F today · 25 d/yr by 30 yrs out
- Wind 6/10 Major 52% chance of damaging wind over 30 yrs
- Air quality 2/10 Low 1 unhealthy d/yr today · 2 by 30 yrs out
Nearby sold comps map
Loading sold comps map…
Walkable amenities ~0.75 mi
Loading nearby amenities…
Taxation est. · year 1
- Rental income
- $14,888
- − Mortgage interest
- −$6,722
- − Property taxes
- −$1,611
- − Insurance
- −$600
- − Repairs & maintenance
- −$1,191
- − Management
- −$1,191
- − Depreciation
- −$3,491
- Taxable income
- $82
- Est. tax owed @ 24.0%
- −$20
- After-tax cash flow
- $1,979/yr
For passive investors: Depreciation is non-cash, so a rental often shows a tax loss while cash-flowing — sheltering income. Rental losses are passive: they offset passive income freely, and up to $25,000/yr can offset ordinary (W-2) income if you actively participate and your MAGI is under $100k (phasing out to $0 by $150k); unused losses carry forward. On sale, claimed depreciation is recaptured at up to 25%, and gains may owe capital-gains tax (a 1031 exchange can defer both). Figures are a year-1 estimate at your 24.0% rate — not tax advice; consult a CPA.
Schools (NCES district)
- District
- Big Sandy ISD
- NCES district ID
- 4810140
- Math proficiency
- 44% ▼ -3.00%
- Reading proficiency
- 41% ▼ -5.00%
- Median HH income
- $44,595
- Composite
- 36.07/100
- National rank
- #4767
- State rank
- #330 of 826 in TX
Livability — Big Sandy
- Score
- 65/100
- State rank
- #710
- US rank
- #13298
Category grades
Schools grade is shown separately in the Schools card above.
Census & demographics
- Population (ZIP)
- 4,863
Population outlook (Upshur County) Hauer SSP2
- Today (2025)
- 42,771 people
- By 2030
- 43,788 · +2.4%
- By 2040
- 45,574 · +6.6%
- By 2050
- 46,683 · +9.1%
- By 2075
- 49,137 · +14.9%
- By 2100
- 47,457 · +11.0%
Race, ethnicity, and origin ACS 2023
- Neighborhood character
- Predominantly White (81%)
- Race & ethnicity
- White 81% Black 13% Hispanic / Latino 4% Two or more races 3%
- Common ancestry
- Serbian 5% Slovak 4% Italian 3%
- Foreign-born
- 4% · Canada
- Languages at home
- 97% English-only · Spanish 3%
Political lean MEDSL · Upshur
- 2024 margin
- Solid R (+71.0) · D 14.2% · R 85.2%
- 2008→2024 swing
- -22.0pp toward R · 2008: -49.0pp · 2024: -71.0pp
- All cycles
- 2024: R+71.0 2020: R+68.5 2016: R+68.0 2012: R+59.8 2008: R+49.0
Not yet ingested
- Civics
- —
Market trends
- HPI YoY
- ▼ -43.30%
- Current HPI
- 189.9675
- Rent YoY
- —
- Metro
- —
- State GDP YoY
- ▲ 3.95%
- F500 in state
- 110
Industry mix (Fortune 500 HQ in TX)
| Industry | F500 HQs | Revenue |
|---|---|---|
| Energy | 16 | $1,198B |
|
||
| Technology | 5 | $198B |
|
||
| Engineering / Construction | 4 | $72B |
|
||
| Energy Services | 3 | $60B |
|
||
| Utilities | 3 | $41B |
|
||
| Healthcare | 2 | $330B |
|
||
Price history
+87.0% since first listed9 events — show timeline
- 2026-06-03 Listed $129,000 GTAR
- 2017-04-13 Sold (Public Records) — Public Records
- 2017-04-13 Sold (MLS) — LAAR
- 2016-10-06 Listed $69,000 LAAR
- 2013-12-12 Sold (Public Records) — Public Records
- 2013-12-12 Sold (Public Records) — Public Records
- 2013-12-12 Sold (Public Records) — Public Records
- 2007-12-05 Sold (Public Records) — Public Records
- 2007-12-05 Sold (Public Records) — Public Records
Property tax history
-2.6%/yrLatest (2025): $1,611 · +11.2% YoY. Source: county tax records.
Cash-flow waterfall
monthlySold comps — $/sqft
last 12 mo · ≤1 miLoading sold comps…