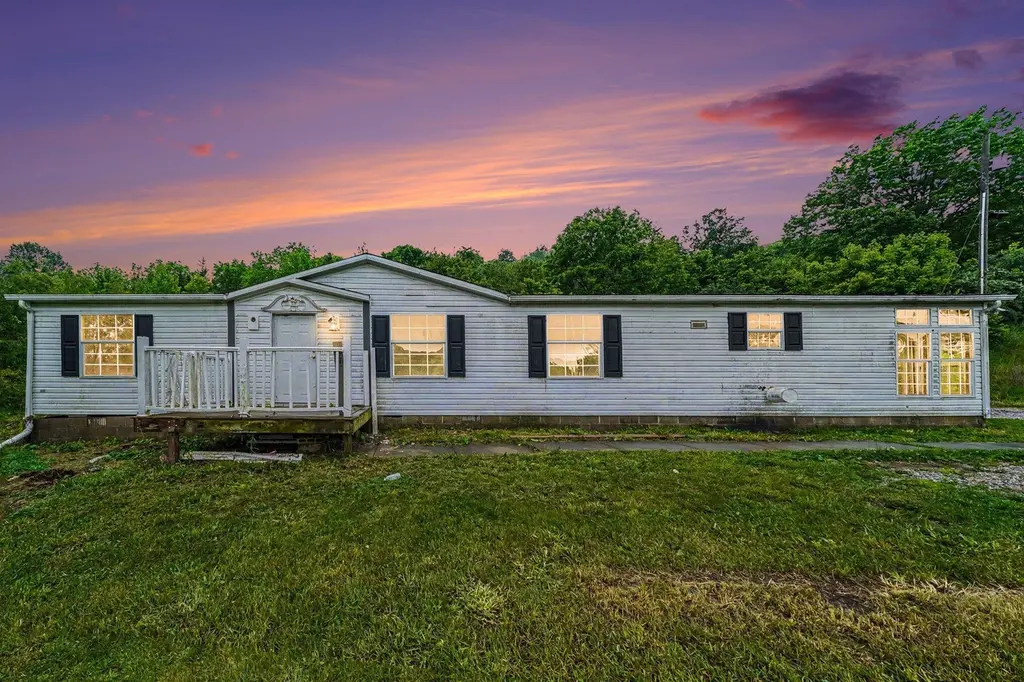
5500 Ky Highway 1992 · Patriot, IN
Flood risk 1/10 · Minimal
- FEMA flood zone
- X (unshaded)
- Chance of flooding over 30 yrs
- 0.0%
- Est. flood insurance / yr
- $507 – $1,088
Fire risk 2/10 · Minimal
- Est. fire insurance / yr
- $839 – $1,559
Heat risk 4/10 · Minor
- Hot days now (above 103°F)
- 7 days/yr
- Hot days in 30 yrs
- 19 days/yr
Wind risk 2/10 · Minimal
- Chance of severe wind over 30 yrs
- 1.0%
Air-quality risk 3/10 · Minor
- Unhealthy air days now
- 2 days/yr
- Unhealthy air days in 30 yrs
- 5 days/yr
Risk factors via First Street. Map © Google.
Why this score? — see what drove the B+ grade
The composite is a weighted blend of 9 inputs, each scored 0–100. Each bar is that input's sub-score; the figure is the points it added to the 100-point composite (weight × sub-score).
- Cash flow +30.0/30.0
- 1% rule +10.0/10.0
- DSCR +10.0/10.0
- Appreciation +9.2/10.0
- ARV discount +7.5/15.0
- Livability +2.7/5.0
- Rent growth +2.5/5.0
- Condition / age +2.5/5.0
- Schools +2.2/10.0
$60,000
🖨 Deal sheet 📄 Offer letter ✓ Due diligence
Listing remarks
This home offers a great opportunity for an investor, flipper, or buyer looking for a renovation project near the Ohio River. This 3-bedroom, 2 full bath home sits on approximately 1 acre and is in need of a full rehab. The property is being sold as-is and very close to Hartig Park & Wildlife Reserve, a 500+ acre recreational area featuring wooded trails, wildlife habitat, and outdoor recreation near the Ohio River. Offering a private setting with wooded surroundings and convenient access to outdoor recreation. Located just minutes from the river, this property could serve as a primary residence, weekend getaway, or investment opportunity. Schedule your showing today!
Key facts
- Wooded surroundings
- Outdoor recreation
- Private setting
Tags
Property features AI
Finance
- Other: Located on a private road; Has view
Exterior
- Parking: Driveway
- Utilities: Public water; Public sewer; Cable available; Water service available
- Home design: Single-family manufactured home; One level; Built in 2003; Shingle roof; Irregular lot shape
- Construction: Vinyl siding; Mobile home base foundation
- Exterior features: Private yard; Sloped, wooded lot; Aluminum-clad windows
Interior
- Kitchen: Electric oven; Dishwasher
- Bedrooms: Primary bedroom (15 x 12); Bedroom 2 (11 x 13)
- Bathrooms: 2 full bathrooms; Primary bath (7 x 9); Bathroom 2 (4 x 7); Bathroom 3 (10 x 13)
- Heating & cooling: Electric heating; Central air conditioning
- Interior features: Eat-in kitchen; Wood-burning fireplace
Neighborhood map
What this means for you Summary
Snapshot
- This is a 3-bed/2.0-bath single-family listed at $60k.
Deal economics
- At list price, monthly cash flow is $547 ($7k/yr) — positive.
- The deal already cash-flows at list — no discount required.
- Meets the 1% rule at list price ($1k rent vs $60k).
- Recommended offer: $59k (1.5% below list) — sets the bar for market timing.
Location & tenants
- Location reads 53/100 on livability (#645 in IN) — a working-class tenant base; expect higher turnover. Strengths: cost of living A+, housing A+; Watch: crime D, employment D, amenities F.
- Gallatin County (rural): math 20% / reading 31% proficiency, ranked #137 of 165 in KY (top 83%) — low school quality limits family demand, transient renter base, plan for 1-2y turnover; 62% free/reduced lunch — lower-income household profile, screen leases tightly.
- Zoned schools: Gallatin County Upper Elementary (math 18% / reading 32%, grade F, #483 of 676 statewide, top 72%, 290 students, 70% FRL); Gallatin County Middle School (math 22% / reading 30%, grade F, #178 of 217 statewide, top 83%, 326 students, 67% FRL); Gallatin County High School (math 22% / reading 32%, grade F, #158 of 254 statewide, top 68%, 493 students, 65% FRL).
- Market conditions: 56 units permitted in Gallatin County in 2024 (0 in 5+ unit buildings).
Forward outlook
- In year one you build about $5k of equity ($415 loan paydown + $5k appreciation (8.4% local appreciation)).
- Gallatin County population projected to shrink 6% by 2050 — rents likely to lag national; underwrite the cash flow, not the appreciation.
- At projected returns (8.4% appreciation + 3.0% rent growth), your $17k cash investment doubles in ~2 years — after that, you're playing with house money.
- By year 6, paydown + projected appreciation supports a ~$31k cash-out refi (75% LTV) — recoverable capital for the next deal without selling this one.
Negotiation context
- It's been on market 23 days — a 2% lower offer ($59k) is reasonable based on typical stale-listing flexibility.
- 2 sale attempts since 7y ago; this cycle's ask has dropped $20k (25%) from the opening price — seller is motivated, your offer sets the floor, not the list.
Questions for the listing agent
- Is there a deadline driving the sale (1031 exchange, divorce, estate, relocation)? That informs how much negotiation room exists.
- Schools are F-rated, which usually means shorter tenancies and higher turnover. Who's the typical renter profile here, and what's been the actual vacancy rate?
- Crime grade is D in this area — have there been break-ins, vandalism, or insurance claims at this property in the last 3 years? What carrier currently insures it and at what premium?
- What's the average days-on-market for RENTAL listings here right now (not sales)? A rising rental-DOM trend means longer vacancies and softer asking-rent achievability than the comps imply.
- What's the recent tenant-quality profile in this submarket — average credit score on applications, eviction rate, late-payment / NSF rate, and stable-employment percentage? A property-management company in the area should have these aggregated.
- How much new for-sale + rental construction is in the pipeline within 1–3 miles? Heavy new supply typically softens prices + rents 12–24 months out; constrained supply supports both.
Investment metrics
- 1% rule
- 2.05% ✓
- Cap rate
- 17.23%
- Cash-on-cash
- 39.06%
- DSCR
- 2.74
- GRM
- 4.1
CMA / ARV
No comps found within radius.
Projected returns pro-forma
8.37% appreciation · 3.0% rent growth · sell at horizon
- IRR
- 52.2%
- Equity multiple
- 4.63×
- Total profit
- $61,008
- Equity at exit
- $47,115
- IRR
- 47.1%
- Equity multiple
- 10.00×
- Total profit
- $151,271
- Equity at exit
- $95,023
Cash invested: $16,800 (down + closing). Projections, not guarantees.
Landlord ↔ Tenant lean methodology
- Overall (STATE)
- 90 Strongly Landlord-Friendly
- State Indiana
- 90 Strongly Landlord-Friendly · R+11
- County
- — inherits STATE
- City
- — inherits STATE
ZIP-level market 41095
- Home prices YoY
- 2.9%
- Price-to-rent
- 4.1×
Monthly cashflow live
- Estimated rent
- $1,227 medium interval (Pro) →
- Mortgage (P&I)
- −$315
- Tax from tax record
- −$83 /mo · $998/yr
- Insurance
- −$25
- HOA
- −$0
- Vacancy / Maint / Mgmt
- −$258
- Net cashflow
- $547
Break-even live
UW: 25.0% down · 7.5% · 30yr · 1.5% tax · 5.0% vac · 8.0% maint · 8.0% mgmt
Financing live
Cash to close
- Down payment
- $15,000
- Closing costs
- $1,800
- Reserves months
- —
- Total cash needed
- —
Loan-product check · same deal, 3 products live
Conventional
25% down · 7.5% · 30yr
- Down + closing
- —
- Monthly P&I
- —
- Monthly cashflow
- —
- DSCR
- —
- Eligible?
- —
Personal DTI + credit; lowest rate.
DSCR
20% down · 8.5% · 30yr
- Down + closing
- —
- Monthly P&I
- —
- Monthly cashflow
- —
- DSCR
- —
- Eligible?
- —
No personal income docs; deal must DSCR.
Hard money
10% down · 12.0% · 12mo
- Down + closing
- —
- Monthly P&I
- —
- Monthly cashflow
- —
- DSCR
- —
- Eligible?
- —
Short-term bridge; refi at stabilization.
Listing history 13 events
-
2026-06-12statusdays on market $60,000 Pending 23 DOM
-
2026-06-09days on market $60,000 Active 22 DOM
-
2026-06-08days on market $60,000 Active 21 DOM
-
2026-06-07days on market $60,000 Active 20 DOM
-
2026-06-07days on market $60,000 Active 19 DOM
-
2026-06-04pricedays on market $60,000 Active 16 DOM
-
2026-06-02days on market $80,000 Active 15 DOM
-
2026-06-01days on market $80,000 Active 14 DOM
-
2026-05-31days on market $80,000 Active 13 DOM
-
2026-05-31days on market $80,000 Active 12 DOM
-
2026-05-18$80,000 Active
-
2020-01-19historical
-
2019-06-05$80,000 Active
ⓘ Source: listings_history table (triggers on properties + properties_extension) + one-shot
backfill from property_details.listing_events for pre-trigger history.
Tax reassessment forecast IN · Partial reset (capped growth)
- Current annual tax
- $998 · $83/mo
- Projected year-2 tax
- $998 · $83/mo
- Expected delta
- $0/yr ($0/mo · 0.0%)
ⓘ Screening estimate from a state-policy table — verify with the county assessor before closing.
Climate risk First Street
- Flood 1/10 Low FEMA zone X (unshaded) · 0% chance over 30 yrs
- Wildfire 2/10 Low
- Heat 4/10 Moderate 7 d/yr ≥103°F today · 19 d/yr by 30 yrs out
- Wind 2/10 Low 100% chance of damaging wind over 30 yrs
- Air quality 3/10 Moderate 2 unhealthy d/yr today · 5 by 30 yrs out
Nearby sold comps map
Loading sold comps map…
Walkable amenities ~0.75 mi
Loading nearby amenities…
Taxation est. · year 1
- Rental income
- $14,729
- − Mortgage interest
- −$3,361
- − Property taxes
- −$998
- − Insurance
- −$300
- − Repairs & maintenance
- −$1,178
- − Management
- −$1,178
- − Depreciation
- −$1,745
- Taxable income
- $5,968
- Est. tax owed @ 24.0%
- −$1,432
- After-tax cash flow
- $5,130/yr
For passive investors: Depreciation is non-cash, so a rental often shows a tax loss while cash-flowing — sheltering income. Rental losses are passive: they offset passive income freely, and up to $25,000/yr can offset ordinary (W-2) income if you actively participate and your MAGI is under $100k (phasing out to $0 by $150k); unused losses carry forward. On sale, claimed depreciation is recaptured at up to 25%, and gains may owe capital-gains tax (a 1031 exchange can defer both). Figures are a year-1 estimate at your 24.0% rate — not tax advice; consult a CPA.
Schools (NCES district)
- District
- Gallatin County
- NCES district ID
- 2102130
- Math proficiency
- 20% ▼ -15.00%
- Reading proficiency
- 31% ▼ -16.00%
- Median HH income
- $46,041
- Composite
- 22.05/100
- National rank
- #8195
- State rank
- #137 of 165 in KY
Livability — Patriot
- Score
- 53/100
- State rank
- #645
- US rank
- #24451
Category grades
Schools grade is shown separately in the Schools card above.
Census & demographics
- Population (ZIP)
- 3,775
Population outlook (Gallatin County) Hauer SSP2
- Today (2025)
- 8,658 people
- By 2030
- 8,616 · -0.5%
- By 2040
- 8,410 · -2.9%
- By 2050
- 8,140 · -6.0%
- By 2075
- 7,308 · -15.6%
- By 2100
- 6,671 · -22.9%
Race, ethnicity, and origin ACS 2023
- Neighborhood character
- Predominantly White (82%)
- Race & ethnicity
- White 82% Hispanic / Latino 7% Black 6% Two or more races 5% Asian 1%
- Hispanic origin (detail)
- Mexican 7%
- Common ancestry
- Slovak 1% Italian 1% Scottish 1%
- Foreign-born
- 4% · Canada
- Languages at home
- 93% English-only · Spanish 6% French/Haitian/Cajun 0%
Political lean MEDSL · Gallatin
- 2024 margin
- Solid R (+59.9) · D 19.4% · R 79.4% · Other 1.2%
- 2008→2024 swing
- -42.3pp toward R · 2008: -17.6pp · 2024: -59.9pp
- All cycles
- 2024: R+59.9 2020: R+55.4 2016: R+50.8 2012: R+17.0 2008: R+17.6
Not yet ingested
- Civics
- —
Market trends
- HPI YoY
- ▲ 8.37%
- Current HPI
- 293.2896
- Rent YoY
- —
- Metro
- —
- State GDP YoY
- ▲ 2.90%
- F500 in state
- 18
Industry mix (Fortune 500 HQ in IN)
| Industry | F500 HQs | Revenue |
|---|---|---|
| Industrial Machinery | 2 | $37B |
|
||
| Healthcare | 1 | $177B |
|
||
| Pharmaceuticals | 1 | $45B |
|
||
| Metals / Steel | 1 | $18B |
|
||
| Agriculture | 1 | $17B |
|
||
| Packaging | 1 | $12B |
|
||
Price history
+0.0% since first listed3 events — show timeline
- 2026-05-18 Listed $80,000 NKMLS
- 2020-01-19 Listing Removed — NKMLS
- 2019-06-05 Listed $80,000 NKMLS
Property tax history
-0.4%/yrLatest (2025): $998 · -0.2% YoY. Source: county tax records.
Cash-flow waterfall
monthlySold comps — $/sqft
last 12 mo · ≤1 miLoading sold comps…