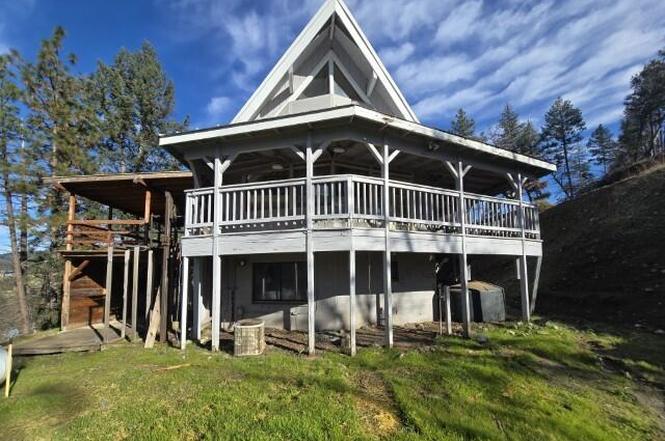
113 Top Of The Grade Rd · Douglas City, CA
Flood risk 1/10 · Minimal
- FEMA flood zone
- X (unshaded)
- Chance of flooding over 30 yrs
- 0.0%
- Est. flood insurance / yr
- $507 – $1,088
Fire risk 8/10 · Major
- Est. fire insurance / yr
- $659 – $1,223
Heat risk 6/10 · Moderate
- Hot days now (above 92°F)
- 8 days/yr
- Hot days in 30 yrs
- 18 days/yr
Wind risk 1/10 · Minimal
- Chance of severe wind over 30 yrs
- —
Air-quality risk 10/10 · Severe
- Unhealthy air days now
- 39 days/yr
- Unhealthy air days in 30 yrs
- 43 days/yr
Risk factors via First Street. Map © Google.
Why this score? — see what drove the D+ grade
The composite is a weighted blend of 9 inputs, each scored 0–100. Each bar is that input's sub-score; the figure is the points it added to the 100-point composite (weight × sub-score).
- Cash flow +16.4/30.0
- ARV discount +7.5/15.0
- 1% rule +6.0/10.0
- DSCR +5.1/10.0
- Appreciation +4.3/10.0
- Livability +2.9/5.0
- Schools +2.8/10.0
- Rent growth +2.5/5.0
- Condition / age +2.5/5.0
$119,900
🖨 Deal sheet 📄 Offer letter ✓ Due diligence
Listing remarks
Top Of The Grade says it all! Wonderful views from this Lindel cedar log home with 2.48 acres of privacy. Covered carport provides space for vehicles and there are 3 levels inside to spread out in. 2 bedrooms, bath and laundry on the lower level, open floor concept on the middle level with living space, kitchen, bathroom & bonus room and an open loft area on the top level. If you crave privacy with the convenience of close by amenities, this may be the property for you!
Key facts
- 2.48 acre lot
- 2 parking spots
- Built 1981
Property features AI
Exterior
- Parking: Has a 2-space carport; Off-street parking
- Utilities: Well water; Septic tank; Other utilities
- Home design: Single family residence; Three or more levels; Residential property
- Construction: Slab foundation
- Exterior features: Metal roof; Greenbelt lot; Steep slope lot; Dirt and gravel road access; Has a view
Interior
- Flooring: Laminate
- Bathrooms: 1 full bathroom
- Heating & cooling: Has heating; Has cooling
- Interior features: Fireplace in the living room; Laminate flooring
Neighborhood map
What this means for you Summary
Snapshot
- This is a 2-bed/1.0-bath single-family listed at $120k.
Deal economics
- At list price, monthly cash flow is $68 ($811/yr) — positive.
- The deal already cash-flows at list — no discount required.
- Meets the 1% rule at list price ($1k rent vs $120k).
- Recommended offer: $106k (12.0% below list) — sets the bar for market timing.
Location & tenants
- Location reads 57/100 on livability (#755 in CA) — a working-class tenant base; expect higher turnover. Strengths: schools A-; Watch: employment D, crime F, amenities F.
- Lewiston Elementary (rural): math 30% / reading 30% proficiency, ranked #1,065 of 1,400 in CA (top 76%) — families likely to look elsewhere, expect single-tenant / working-renter base with shorter leases; 71% free/reduced lunch — lower-income household profile, screen leases tightly.
- Market conditions: 31 active listings in the ZIP; 21 units permitted in Trinity County in 2024 (0 in 5+ unit buildings).
Forward outlook
- Local home prices are declining (-1.5%/yr); year-one equity from $829 of loan paydown is wiped out by about $2k of value loss. Plan a longer hold.
- Trinity County population projected at -38% by 2050 — secular population decline; favor cash flow + early exit over multi-decade hold.
Negotiation context
- It's been on market 213 days — a 12% lower offer ($106k) is reasonable based on typical stale-listing flexibility.
- 2 sale attempts; this cycle's ask has dropped $60k (33%) from the opening price — seller is motivated, your offer sets the floor, not the list.
Risks & watch-outs
- Watch-outs: property tax is 3.0% of price.
- Climate carrying-cost: severe wildfire risk; extreme-heat days projected 8→18/yr by 2055 (HVAC capex compounding) — expect insurance premiums to compound above CPI over the hold.
Questions for the listing agent
- It's been on market 213 days. Have you received any prior offers? Is the seller open to a 12% concession, seller financing, or rate buy-down credit?
- Property tax is high relative to price — has the assessment been appealed recently, and will the sale trigger a re-assessment?
- Why hasn't it sold? Are there any deal-killer items the seller is aware of (foundation, flood, title, zoning, code violations)?
- Is there a deadline driving the sale (1031 exchange, divorce, estate, relocation)? That informs how much negotiation room exists.
- Schools are A-rated — typically a magnet for longer-tenancy family renters. What's the average tenant stay here, and is there a school-zone premium baked into asking?
- Crime grade is F in this area — have there been break-ins, vandalism, or insurance claims at this property in the last 3 years? What carrier currently insures it and at what premium?
- The area grade is low — what's the realistic commute time and amenity access for the typical tenant pool here? Any planned neighborhood developments (good or bad) we should know about?
- What's the average days-on-market for RENTAL listings here right now (not sales)? A rising rental-DOM trend means longer vacancies and softer asking-rent achievability than the comps imply.
- What's the recent tenant-quality profile in this submarket — average credit score on applications, eviction rate, late-payment / NSF rate, and stable-employment percentage? A property-management company in the area should have these aggregated.
- How much new for-sale + rental construction is in the pipeline within 1–3 miles? Heavy new supply typically softens prices + rents 12–24 months out; constrained supply supports both.
Investment metrics
- 1% rule
- 1.10% ✓
- Cap rate
- 6.97%
- Cash-on-cash
- 2.42%
- DSCR
- 1.11
- GRM
- 7.6
CMA / ARV
No comps found within radius.
Projected returns pro-forma
-1.48% appreciation · 3.0% rent growth · sell at horizon
- IRR
- -5.1%
- Equity multiple
- 0.79×
- Total profit
- $-7,205
- Equity at exit
- $26,183
- IRR
- 2.3%
- Equity multiple
- 1.20×
- Total profit
- $6,872
- Equity at exit
- $25,206
Cash invested: $33,572 (down + closing). Projections, not guarantees.
Landlord ↔ Tenant lean methodology
- Overall (STATE)
- 18 Strongly Tenant-Friendly
- State California
- 18 Strongly Tenant-Friendly · D+13
- County
- — inherits STATE
- City
- — inherits STATE
ZIP-level market 96024
- Home prices YoY
- -1.3%
- Active inventory
- 31
- Price-to-rent
- 7.6×
Monthly cashflow live
- Estimated rent
- $1,321 medium interval (Pro) →
- Mortgage (P&I)
- −$629
- Tax from tax record
- −$298 /mo · $3,570/yr
- Insurance
- −$50
- HOA
- −$0
- Vacancy / Maint / Mgmt
- −$277
- Net cashflow
- $68
Break-even live
UW: 25.0% down · 7.5% · 30yr · 1.5% tax · 5.0% vac · 8.0% maint · 8.0% mgmt
Financing live
Cash to close
- Down payment
- $29,975
- Closing costs
- $3,597
- Reserves months
- —
- Total cash needed
- —
Loan-product check · same deal, 3 products live
Conventional
25% down · 7.5% · 30yr
- Down + closing
- —
- Monthly P&I
- —
- Monthly cashflow
- —
- DSCR
- —
- Eligible?
- —
Personal DTI + credit; lowest rate.
DSCR
20% down · 8.5% · 30yr
- Down + closing
- —
- Monthly P&I
- —
- Monthly cashflow
- —
- DSCR
- —
- Eligible?
- —
No personal income docs; deal must DSCR.
Hard money
10% down · 12.0% · 12mo
- Down + closing
- —
- Monthly P&I
- —
- Monthly cashflow
- —
- DSCR
- —
- Eligible?
- —
Short-term bridge; refi at stabilization.
Listing history 25 events
-
2026-06-19status $119,900 Pending 213 DOM
-
2026-06-18days on market $119,900 Active Under Contract 213 DOM
-
2026-06-17days on market $119,900 Active Under Contract 212 DOM
-
2026-06-16days on market $119,900 Active Under Contract 211 DOM
-
2026-06-15days on market $119,900 Active Under Contract 210 DOM
-
2026-06-14days on market $119,900 Active Under Contract 208 DOM
-
2026-06-12days on market $119,900 Active Under Contract 207 DOM
-
2026-06-09days on market $119,900 Active Under Contract 204 DOM
-
2026-06-08days on market $119,900 Active Under Contract 203 DOM
-
2026-06-07days on market $119,900 Active Under Contract 202 DOM
-
2026-06-07statusdays on market $119,900 Active Under Contract 201 DOM
-
2026-06-04days on market $119,900 Active 198 DOM
-
2026-06-02days on market $119,900 Active 197 DOM
-
2026-06-01days on market $119,900 Active 196 DOM
-
2026-05-31days on market $119,900 Active 195 DOM
-
2026-05-31days on market $119,900 Active 194 DOM
-
2026-04-23price $129,900
-
2026-03-24price $139,900
-
2026-02-18price $149,900
-
2026-01-18price $159,900
-
2025-12-18price $165,000
-
2025-11-17status Active
-
2025-11-14$179,900
-
2006-09-20soldstatus $255,000
-
1992-06-03soldstatus $79,500
ⓘ Source: listings_history table (triggers on properties + properties_extension) + one-shot
backfill from property_details.listing_events for pre-trigger history.
Tax reassessment forecast CA · Resets to sale price
- Current annual tax
- $3,570 · $298/mo
- Projected year-2 tax
- $3,570 · $298/mo
- Expected delta
- $0/yr ($0/mo · 0.0%)
ⓘ Screening estimate from a state-policy table — verify with the county assessor before closing.
Climate risk First Street
- Flood 1/10 Low FEMA zone X (unshaded) · 0% chance over 30 yrs
- Wildfire 8/10 Severe
- Heat 6/10 Major 8 d/yr ≥92°F today · 18 d/yr by 30 yrs out
- Wind 1/10 Low
- Air quality 10/10 Extreme 39 unhealthy d/yr today · 43 by 30 yrs out
Nearby sold comps map
Loading sold comps map…
Walkable amenities ~0.75 mi
Loading nearby amenities…
Taxation est. · year 1
- Rental income
- $15,856
- − Mortgage interest
- −$6,716
- − Property taxes
- −$3,570
- − Insurance
- −$600
- − Repairs & maintenance
- −$1,268
- − Management
- −$1,268
- − Depreciation
- −$3,488
- Taxable loss
- −$1,055
- Est. tax savings @ 24.0%
- +$253
- After-tax cash flow
- $1,065/yr
For passive investors: Depreciation is non-cash, so a rental often shows a tax loss while cash-flowing — sheltering income. Rental losses are passive: they offset passive income freely, and up to $25,000/yr can offset ordinary (W-2) income if you actively participate and your MAGI is under $100k (phasing out to $0 by $150k); unused losses carry forward. On sale, claimed depreciation is recaptured at up to 25%, and gains may owe capital-gains tax (a 1031 exchange can defer both). Figures are a year-1 estimate at your 24.0% rate — not tax advice; consult a CPA.
Schools (NCES district)
- District
- Lewiston Elementary
- NCES district ID
- 0621480
- Math proficiency
- 30% ▲ 9.00%
- Reading proficiency
- 30% ▲ 9.00%
- Median HH income
- $39,441
- Composite
- 28.03/100
- National rank
- #12231
- State rank
- #1065 of 1400 in CA
Livability — Douglas City
- Score
- 57/100
- State rank
- #755
- US rank
- #22088
Category grades
Schools grade is shown separately in the Schools card above.
Census & demographics
- Census place
- Douglas City, CA
- Population (ZIP)
- 1,029
Population outlook (Trinity County) Hauer SSP2
- Today (2025)
- 11,337 people
- By 2030
- 10,349 · -8.7%
- By 2040
- 8,518 · -24.9%
- By 2050
- 7,084 · -37.5%
- By 2075
- 4,693 · -58.6%
- By 2100
- 2,894 · -74.5%
Race, ethnicity, and origin ACS 2023
- Neighborhood character
- Predominantly White (86%)
- Race & ethnicity
- White 86% Hispanic / Latino 13% Two or more races 5% Native American 2%
- Hispanic origin (detail)
- Common ancestry
- Portuguese 6% Russian 2% Lithuanian 1%
- Foreign-born
- 4% · Canada, Jamaica
- Languages at home
- 99% English-only · Spanish 1%
Political lean MEDSL · Trinity
- 2024 margin
- Lean R (+9.4) · D 43.4% · R 52.8% · Other 3.8%
- 2008→2024 swing
- -14.0pp toward R · 2008: 4.6pp · 2024: -9.4pp
- All cycles
- 2024: R+9.4 2020: R+5.4 2016: R+11.3 2012: R+1.1 2008: D+4.6
Not yet ingested
- Civics
- —
Market trends
- HPI YoY
- ▼ -1.48%
- Current HPI
- 109.3863
- Rent YoY
- —
- Metro
- —
- State GDP YoY
- ▲ 3.21%
- F500 in state
- 116
Industry mix (Fortune 500 HQ in CA)
| Industry | F500 HQs | Revenue |
|---|---|---|
| Technology | 27 | $1,492B |
|
||
| Financial Services | 3 | $174B |
|
||
| Retail | 3 | $44B |
|
||
| Insurance | 3 | $26B |
|
||
| Media / Entertainment | 2 | $115B |
|
||
| Pharmaceuticals / Biotech | 2 | $62B |
|
||
Price history
+63.4% since first listed9 events — show timeline
- 2026-04-23 Price Changed $129,900 SAOR
- 2026-03-24 Price Changed $139,900 SAOR
- 2026-02-18 Price Changed $149,900 SAOR
- 2026-01-18 Price Changed $159,900 SAOR
- 2025-12-18 Price Changed $165,000 SAOR
- 2025-11-17 Relisted — SAOR
- 2025-11-14 Listed $179,900 SAOR
- 2006-09-20 Sold (Public Records) $255,000 Public Records
- 1992-06-03 Sold (Public Records) $79,500 Public Records
Property tax history
+2.0%/yrLatest (2025): $3,570 · +1.8% YoY. Source: county tax records.
Cash-flow waterfall
monthlySold comps — $/sqft
last 12 mo · ≤1 miLoading sold comps…