2010 Victoria Ave · Arnold, PA
Flood risk 1/10 · Minimal
- FEMA flood zone
- X (unshaded)
- Chance of flooding over 30 yrs
- 0.0%
- Est. flood insurance / yr
- $507 – $1,088
Fire risk 1/10 · Minimal
- Est. fire insurance / yr
- $511 – $949
Heat risk 4/10 · Minor
- Hot days now (above 97°F)
- 7 days/yr
- Hot days in 30 yrs
- 19 days/yr
Wind risk 2/10 · Minimal
- Chance of severe wind over 30 yrs
- 0.0%
Air-quality risk 4/10 · Minor
- Unhealthy air days now
- 5 days/yr
- Unhealthy air days in 30 yrs
- 6 days/yr
Risk factors via First Street. Map © Google.
Why this score? — see what drove the D grade
The composite is a weighted blend of 9 inputs, each scored 0–100. Each bar is that input's sub-score; the figure is the points it added to the 100-point composite (weight × sub-score).
- Cash flow +15.0/30.0
- ARV discount +7.5/15.0
- 1% rule +5.0/10.0
- DSCR +5.0/10.0
- Livability +3.2/5.0
- Rent growth +3.0/5.0
- Condition / age +2.2/5.0
- Schools +1.9/10.0
- Appreciation +0.0/10.0
$39,900
🖨 Deal sheet (PDF) 📄 Offer letter ✓ Due diligence
Listing remarks MLS
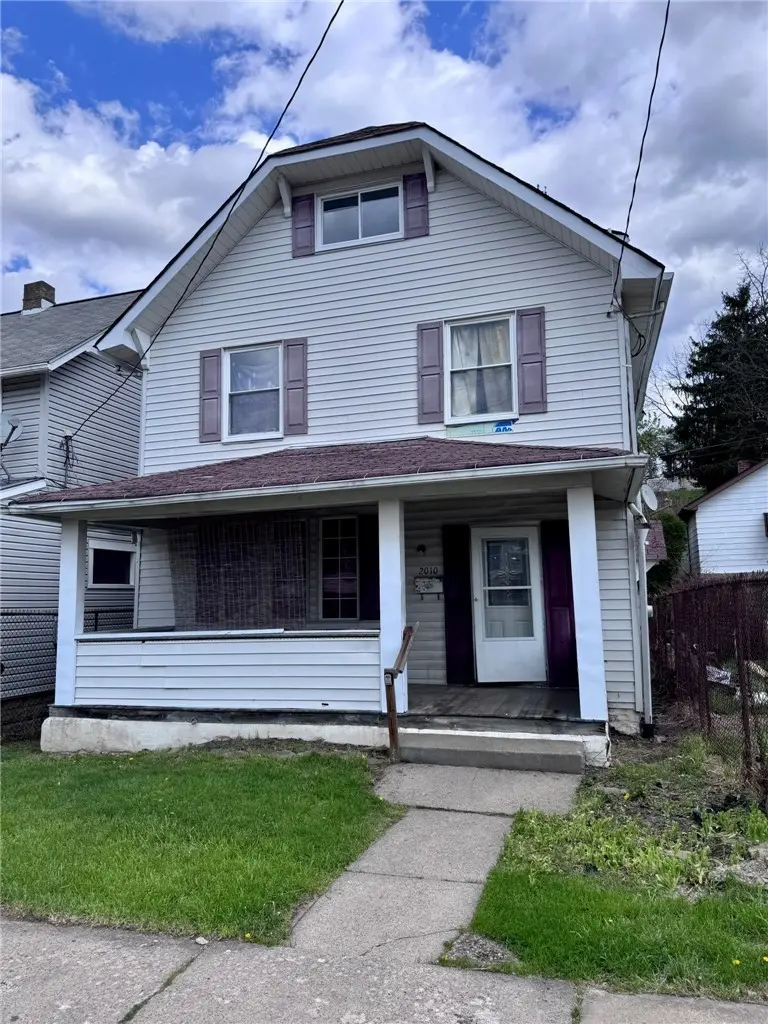
Spacious three-story frame home offering great potential for an owner-occupant or investor. This property features a covered front porch and rear porch, providing additional outdoor living space, along with a private backyard ideal for entertaining, gardening, or recreation. The home is ready for your personal updates and needs TLC to truly shine, making it a fantastic opportunity to add value. With solid bones, classic charm, and plenty of room to customize, this property offers endless possibilities. Conveniently located near local amenities, shopping, and major roadways. Bring your vision and transform this home into something special!
Key facts
- Covered front porch
- Private backyard
- Shopping
Tags
Neighborhood map
What this means for you Summary
Snapshot
- This is a 4-bed/2.0-bath single-family listed at $40k. Condition is rated fair.
Deal economics
- At list price, monthly cash flow is $1k ($13k/yr) — positive.
- The deal already cash-flows at list — no discount required.
- Meets the 1% rule at list price ($2k rent vs $40k).
- Recommended offer: $39k (3.0% below list) — sets the bar for market timing.
Location & tenants
- Location reads 64/100 on livability (#1,212 in PA) — a middle-class / working-renter tenant base. Strengths: cost of living A+, housing A+; Watch: crime F, amenities F, commute F.
- New Kensington-Arnold SD (suburban): math 16% / reading 31% proficiency, ranked #483 of 539 in PA (top 90%) — low school quality limits family demand, transient renter base, plan for 1-2y turnover.
- Zoned schools: Roy A. Hunt El Sch (math 18% / reading 32%, grade F, #1,174 of 1,518 statewide, top 77%, 607 students, 100% FRL); Valley Jshs (math 13% / reading 27%, grade F, #387 of 437 statewide, top 89%, 869 students, 90% FRL) — zoned schools average 95% FRL vs 56% district-wide (39 pts higher); higher-poverty schools than district average — tighter screening recommended.
- Market conditions: Rents rising (+1.9%/yr); 169 active listings in the ZIP; 8 comparable units currently listed for rent nearby; rentals leasing fast (median 13d on market — plan ~1-2 weeks tenant-placement turnaround); 415 units permitted in Westmoreland County in 2024 (10 in 5+ unit buildings).
- This rent runs 33% of the median local income ($63k/yr) — at the standard rent-burdened threshold; future hikes will face affordability resistance.
Forward outlook
- Local home prices are declining (-3.0%/yr); year-one equity from $276 of loan paydown is wiped out by about $1k of value loss. Plan a longer hold.
- Westmoreland County population projected at -19% by 2050 — secular population decline; favor cash flow + early exit over multi-decade hold.
- At projected returns (-3.0% appreciation + 1.9% rent growth), your $11k cash investment doubles in ~1 year — after that, you're playing with house money.
Negotiation context
- It's been on market 57 days — a 3% lower offer ($39k) is reasonable based on typical stale-listing flexibility.
Risks & watch-outs
- Watch-outs: built in 1925 — expect roof / HVAC / electrical / plumbing capex.
Questions for the listing agent
- It's been on market 57 days. Have you received any prior offers? Is the seller open to a 3% concession, seller financing, or rate buy-down credit?
- Have any recent inspections been done? Can we get a copy of the seller's disclosures and any deferred-maintenance estimates?
- Built in 1925 — when were the roof, HVAC, electrical panel, plumbing, and water heater last replaced?
- Is there a deadline driving the sale (1031 exchange, divorce, estate, relocation)? That informs how much negotiation room exists.
- Schools are D-rated, which usually means shorter tenancies and higher turnover. Who's the typical renter profile here, and what's been the actual vacancy rate?
- Crime grade is F in this area — have there been break-ins, vandalism, or insurance claims at this property in the last 3 years? What carrier currently insures it and at what premium?
- The area grade is low — what's the realistic commute time and amenity access for the typical tenant pool here? Any planned neighborhood developments (good or bad) we should know about?
- What's the average days-on-market for RENTAL listings here right now (not sales)? A rising rental-DOM trend means longer vacancies and softer asking-rent achievability than the comps imply.
- What's the recent tenant-quality profile in this submarket — average credit score on applications, eviction rate, late-payment / NSF rate, and stable-employment percentage? A property-management company in the area should have these aggregated.
- How much new for-sale + rental construction is in the pipeline within 1–3 miles? Heavy new supply typically softens prices + rents 12–24 months out; constrained supply supports both.
Investment metrics
- 1% rule
- 4.34% ✓
- Cap rate
- 39.11%
- Cash-on-cash
- 117.19%
- DSCR
- 6.21
- GRM
- 1.9
CMA / ARV
- ARV (median comp)
- $125,963
- List price
- $39,900
- Delta
- -68.32%
- Verdict
- UNDERPRICED
- Comps
- 20 within 1.0 mi
Show comp detail 12 sales within ~0.75 mi
| Address | Dist | Beds/Ba | Sqft | Sold | Price | $/sf | Match |
|---|---|---|---|---|---|---|---|
| 1908 Woodmont Ave | 0.14mi | 3/2.0 (-1) | 1,296 (-4%) | 8mo | $149,900 | $116 | 76 |
| 1910 Ridge Ave | 0.20mi | 3/1.5 (-1) | 1,400 (+4%) | 2mo | $140,000 | $100 | 75 |
| 2020 Constitution Blvd | 0.18mi | 3/1.0 (-1) | 1,215 (-10%) | 0mo | $132,500 | $109 | 66 |
| 526 North St | 0.60mi | 4/2.0 | 1,344 (0%) | 11mo | $126,000 | $94 | 63 |
| 170 Esther Ave | 0.31mi | 3/2.0 (-1) | 1,440 (+7%) | 7mo | $205,000 | $142 | 63 |
| 201 Esther Ave | 0.34mi | 3/3.0 (-1) | 1,414 (+5%) | 10mo | $199,900 | $141 | 58 |
| 1616 Third Ave | 0.51mi | 5/1.5 (+1) | 1,400 (+4%) | 9mo | $27,000 | $19 | 55 |
| 909 Freeport Rd | 0.52mi | 3/1.5 (-1) | 1,230 (-8%) | 1mo | $187,000 | $152 | 54 |
| 2024 Kimball Ave | 0.23mi | 3/1.5 (-1) | 1,152 (-14%) | 10mo | $30,571 | $27 | 50 |
| 1006 Edgewood Rd | 0.73mi | 3/2.0 (-1) | 1,449 (+8%) | 2mo | $270,000 | $186 | 46 |
| 252 Catalpa St | 0.72mi | 3/2.0 (-1) | 1,434 (+7%) | 5mo | $26,500 | $18 | 46 |
| 1249 Leishman Ave | 0.74mi | 3/1.0 (-1) | 1,444 (+7%) | 10mo | $30,571 | $21 | 36 |
Match score weights: distance 35% · size 25% · config 20% · recency 20%. Top-matched comps best support the ARV.
Projected returns pro-forma
-3.0% appreciation · 1.9% rent growth · sell at horizon
- IRR
- —
- Equity multiple
- 6.47×
- Total profit
- $61,154
- Equity at exit
- $5,949
- IRR
- —
- Equity multiple
- 13.10×
- Total profit
- $135,232
- Equity at exit
- $3,450
Cash invested: $11,172 (down + closing). Projections, not guarantees.
Landlord ↔ Tenant lean methodology
- Overall (STATE)
- 62 Landlord-Friendly
- State Pennsylvania
- 62 Landlord-Friendly · EVEN
- County
- — inherits STATE
- City
- — inherits STATE
ZIP-level market 15068
- Home prices YoY
- -12.2%
- Rents YoY
- 1.9%
- Active inventory
- 169
- Price-to-rent
- 1.9×
Monthly cashflow live
- Estimated rent
- $1,730 high interval (Pro) →
- Mortgage (P&I)
- −$209
- Tax est. 1.5%
- −$50 /mo · $598/yr
- Insurance
- −$17
- HOA
- −$0
- Vacancy / Maint / Mgmt
- −$363
- Net cashflow
- $1,091
Break-even live
Sensitivity live
| Price | -10% $1,119 | -5% $1,105 | +0% $1,091 | +5% $1,077 | +10% $1,063 |
|---|---|---|---|---|---|
| Rent | -10% $954 | -5% $1,023 | +0% $1,091 | +5% $1,159 | +10% $1,228 |
| Rate | -1.0pp $1,111 | -0.5pp $1,101 | base $1,091 | +0.5pp $1,081 | +1.0pp $1,070 |
UW: 25.0% down · 7.5% · 30yr · 1.5% tax · 5.0% vac · 8.0% maint · 8.0% mgmt
Financing live
Cash to close
- Down payment
- $9,975
- Closing costs
- $1,197
- Reserves months
- —
- Total cash needed
- —
Loan-product check · same deal, 3 products live
Conventional
25% down · 7.5% · 30yr
- Down + closing
- —
- Monthly P&I
- —
- Monthly cashflow
- —
- DSCR
- —
- Eligible?
- —
Personal DTI + credit; lowest rate.
DSCR
20% down · 8.5% · 30yr
- Down + closing
- —
- Monthly P&I
- —
- Monthly cashflow
- —
- DSCR
- —
- Eligible?
- —
No personal income docs; deal must DSCR.
Hard money
10% down · 12.0% · 12mo
- Down + closing
- —
- Monthly P&I
- —
- Monthly cashflow
- —
- DSCR
- —
- Eligible?
- —
Short-term bridge; refi at stabilization.
Rent comps 8 comps
| Address | Beds | Baths | Sqft | Rent | $/sqft | DOM | Units | Dist |
|---|---|---|---|---|---|---|---|---|
| 1922 Kenneth Ave New Kensington, PA | 5.0 | 2.0 | 1800 | $2,150 | $1.19 | 9d | 1 | 0.16mi |
| 1922 Kenneth Ave New Kensington, PA | 5.0 | 2.0 | 1800 | $2,100 | $1.17 | 0d | 1 | 0.16mi |
| 826 North St New Kensington, PA | 4.0 | 1.5 | 1250 | $1,495 | $1.20 | 0d | 1 | 0.59mi |
| 1330 Woodmont Ave New Kensington, PA | 3.0 | 1.0 | 1250 | $1,100 | $0.88 | 12d | 1 | 0.61mi |
| 300 Craigdell Rd New Kensington, PA | 3.0 | 2.0 | 1300 | $1,130 | $0.87 | 0d | 1 | 0.89mi |
| 424 W 7th Ave Unit 2 Tarentum, PA | 3.0 | 1.0 | 1632 | $1,250 | $0.77 | 45d | 1 | 1.10mi |
| 915 Evans St New Kensington, PA | 3.0 | 2.0 | 1152 | $1,295 | $1.12 | 45d | 1 | 1.37mi |
| 1134 Strawn Ave New Kensington, PA | 3.0 | 1.0 | 1084 | $1,500 | $1.38 | 45d | 1 | 1.44mi |
Listing history 11 events
-
2026-06-21statusdays on market $39,900 Pending 57 DOM
-
2026-06-18days on market $39,900 Contingent 56 DOM
-
2026-06-17days on market $39,900 Contingent 55 DOM
-
2026-06-16statusdays on market $39,900 Contingent 54 DOM
-
2026-06-15days on market $39,900 Active 53 DOM
-
2026-06-13days on market $39,900 Active 51 DOM
-
2026-06-09days on market $39,900 Active 47 DOM
-
2026-06-08days on market $39,900 Active 46 DOM
-
2026-06-07statusdays on market $39,900 Active 45 DOM
-
2026-05-15price $39,900 650-char remark
Show marketing remark (650 chars)
Spacious three-story frame home offering great potential for an owner-occupant or investor. This property features a covered front porch and rear porch, providing additional outdoor living space, along with a private backyard ideal for entertaining, gardening, or recreation. The home is ready for your personal updates and needs TLC to truly shine, making it a fantastic opportunity to add value. With solid bones, classic charm, and plenty of room to customize, this property offers endless possibilities. Conveniently located near local amenities, shopping, and major roadways. Bring your vision and transform this home into something special!
-
2026-04-14$49,900 Active 650-char remark
Show marketing remark (650 chars)
Spacious three-story frame home offering great potential for an owner-occupant or investor. This property features a covered front porch and rear porch, providing additional outdoor living space, along with a private backyard ideal for entertaining, gardening, or recreation. The home is ready for your personal updates and needs TLC to truly shine, making it a fantastic opportunity to add value. With solid bones, classic charm, and plenty of room to customize, this property offers endless possibilities. Conveniently located near local amenities, shopping, and major roadways. Bring your vision and transform this home into something special!
ⓘ Source: listings_history table (triggers on properties + properties_extension) + one-shot
backfill from property_details.listing_events for pre-trigger history.
Climate risk First Street
- Flood 1/10 Low FEMA zone X (unshaded) · 0% chance over 30 yrs
- Wildfire 1/10 Low
- Heat 4/10 Moderate 7 d/yr ≥97°F today · 19 d/yr by 30 yrs out
- Wind 2/10 Low 0% chance of damaging wind over 30 yrs
- Air quality 4/10 Moderate 5 unhealthy d/yr today · 6 by 30 yrs out
Nearby sold comps map
Loading sold comps map…
Walkable amenities ~0.75 mi
Loading nearby amenities…
Taxation est. · year 1
- Rental income
- $20,761
- − Mortgage interest
- −$2,235
- − Property taxes
- −$598
- − Insurance
- −$200
- − Repairs & maintenance
- −$1,661
- − Management
- −$1,661
- − Depreciation
- −$1,161
- Taxable income
- $13,245
- Est. tax owed @ 24.0%
- −$3,179
- After-tax cash flow
- $9,913/yr
For passive investors: Depreciation is non-cash, so a rental often shows a tax loss while cash-flowing — sheltering income. Rental losses are passive: they offset passive income freely, and up to $25,000/yr can offset ordinary (W-2) income if you actively participate and your MAGI is under $100k (phasing out to $0 by $150k); unused losses carry forward. On sale, claimed depreciation is recaptured at up to 25%, and gains may owe capital-gains tax (a 1031 exchange can defer both). Figures are a year-1 estimate at your 24.0% rate — not tax advice; consult a CPA.
Condition & rehab AI · 1 photo
This three-story home has fair condition with some exterior wear and overgrown landscaping. It offers great potential for updates and could be transformed into a move-in-ready property with moderate renovations.
Repairs flagged
- Major siding — Significant wear and discoloration
- Minor landscaping — Overgrown grass
Value-add opportunities
- Both paint exterior — Enhances curb appeal and resale value
- Both landscaping — Improves curb appeal and rental value
- Both repair siding — Restores exterior appearance and increases value
Renovation cost estimate screening
| Repair item | Severity | Est. cost |
|---|---|---|
| siding · Significant wear and discoloration | Major | $15,000–50,000 |
| landscaping · Overgrown grass | Minor | $500–3,000 |
| Total estimated repair cost · 2 items | $15,500–53,000 |
Value-add ROI direction
- Both paint exterior — Enhances curb appeal and resale value ↑
- Both landscaping — Improves curb appeal and rental value ↑
- Both repair siding — Restores exterior appearance and increases value ↑
ⓘ Cost ranges are severity-bucket heuristics (US national rule-of-thumb). Get contractor quotes + a written scope before underwriting a rehab budget.
Schools (NCES district)
- District
- New Kensington-Arnold SD
- NCES district ID
- 4216740
- Math proficiency
- 16% ▼ -7.00%
- Reading proficiency
- 31% ▼ -13.00%
- Median HH income
- $34,386
- Composite
- 19.26/100
- National rank
- #8805
- State rank
- #483 of 539 in PA
Livability — Arnold
- Score
- 64/100
- State rank
- #1212
- US rank
- #14318
Category grades
Schools grade is shown separately in the Schools card above.
Census & demographics
- Census place
- Arnold, PA
- County
- Westmoreland County · 183,777 people
- Metro
- Pittsburgh, PA
- Population (ZIP)
- 36,203
- Household income
- $63,426
- Rent vs Own
- Severe rent burden
- 967.0
Population outlook (Westmoreland County) Hauer SSP2
- Today (2025)
- 342,555 people
- By 2030
- 331,717 · -3.2%
- By 2040
- 304,976 · -11.0%
- By 2050
- 277,444 · -19.0%
- By 2075
- 224,607 · -34.4%
- By 2100
- 171,084 · -50.1%
Race, ethnicity, and origin ACS 2023
- Neighborhood character
- Predominantly White (88%)
- Race & ethnicity
- White 88% Black 8% Two or more races 3% Hispanic / Latino 1%
- Common ancestry
- Romanian 12% Subsaharan African 2% Serbian 1%
- Foreign-born
- 1%
- Languages at home
- 97% English-only · Spanish 1% Other Indo-European 0%
Political lean MEDSL · Westmoreland
- 2024 margin
- Strong R (+28.4) · D 35.4% · R 63.9%
- 2008→2024 swing
- -11.7pp toward R · 2008: -16.7pp · 2024: -28.4pp
- All cycles
- 2024: R+28.4 2020: R+28.3 2016: R+31.3 2012: R+23.7 2008: R+16.7
Not yet ingested
- Civics
- —
Market trends
- HPI YoY
- ▼ -42.50%
- Current HPI
- 305.926
- Rent YoY
- ▲ 1.90%
- Metro
- Pittsburgh, PA
- State GDP YoY
- ▲ 1.68%
- F500 in state
- 34
Industry mix (Fortune 500 HQ in PA)
| Industry | F500 HQs | Revenue |
|---|---|---|
| Healthcare | 2 | $309B |
|
||
| Insurance | 2 | $27B |
|
||
| Telecommunications / Media | 1 | $124B |
|
||
| Industrial Distribution | 1 | $22B |
|
||
| Financial Services | 1 | $20B |
|
||
| Chemicals / Materials | 1 | $18B |
|
||
Price history
-20.0% since first listed2 events — show timeline
- 2026-05-15 Price Changed $39,900 West Penn MLS
- 2026-04-14 Listed $49,900 West Penn MLS
Cash-flow waterfall
monthlySold comps — $/sqft
last 12 mo · ≤1 miLoading sold comps…