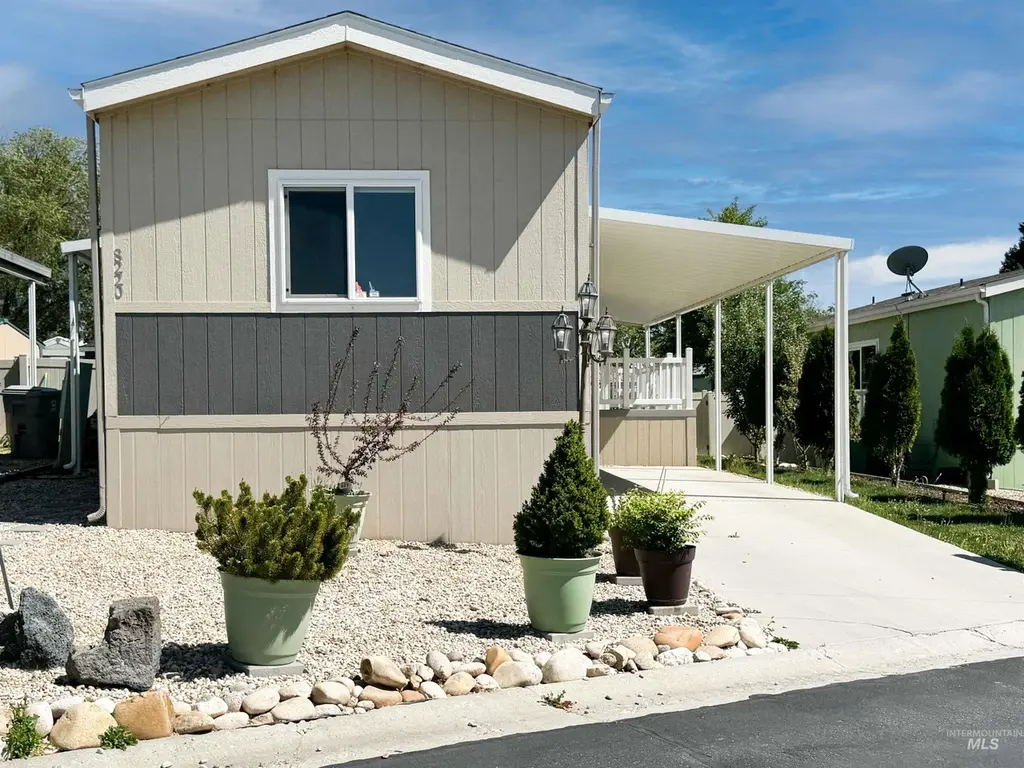
8220 S Blue Rim Ln #39 · Boise City, ID
Flood risk No data
- FEMA flood zone
- —
- Chance of flooding over 30 yrs
- —
- Est. flood insurance / yr
- —
Fire risk No data
- Est. fire insurance / yr
- —
Heat risk No data
- Hot days now (above threshold)
- —
- Hot days in 30 yrs
- —
Wind risk No data
- Chance of severe wind over 30 yrs
- —
Air-quality risk No data
- Unhealthy air days now
- —
- Unhealthy air days in 30 yrs
- —
Risk factors via First Street. Map © Google.
Why this score? — see what drove the D grade
The composite is a weighted blend of 9 inputs, each scored 0–100. Each bar is that input's sub-score; the figure is the points it added to the 100-point composite (weight × sub-score).
- Cash flow +10.9/30.0
- ARV discount +7.5/15.0
- Appreciation +5.0/10.0
- Schools +4.2/10.0
- 1% rule +3.2/10.0
- DSCR +3.2/10.0
- Rent growth +2.5/5.0
- Livability +2.5/5.0
- Condition / age +2.5/5.0
$135,000
🖨 Deal sheet (PDF) 📄 Offer letter ✓ Due diligence
Listing remarks
Nice 2013 Fleetwood single wide home located in the desirable Blue Valley Lakeside Community. Conveniently located near I-84, shopping, and restaurants, this 3-bedroom 2-bathroom home is perfect for someone looking for a low maintenance home
Key facts
- Near i-84
- Low maintenance home
- Near shopping
Tags
Property features AI
Exterior
- Parking: One covered parking space; One-car carport; Finished driveway
- Utilities: Community water service; Sewer connected
- Home design: Mobile/manufactured home on a rented lot; Built in 2013
- Construction: Composition roof
- Exterior features: Partial vinyl fencing; Paved road access; Located in a mobile home park
Interior
- Kitchen: Oven/Range (freestanding); Refrigerator
- Bedrooms: Three bedrooms on the main level
- Flooring: Carpet; Laminate; Vinyl sheet
- Bathrooms: Two bathrooms
- Heating & cooling: Electric forced air heating; Central air conditioning
- Interior features: Laminate counters
- Laundry & utility: Washer; Dryer; Utility room on the main level; Electric water heater
Neighborhood map
What this means for you Summary
Snapshot
- This is a 3-bed/2.0-bath manufactured listed at $135k.
Deal economics
- At list price, monthly cash flow is $-58 ($-701/yr) — negative.
- To cash-flow at today's rent, offer at most $127k (6.3% below list).
- To meet the 1% rule (rent ≥ 1% of price), the offer needs to be $111k (18.0% below list).
- Recommended offer: $111k (18.0% below list) — sets the bar for 1% rule.
- Cap rate 5.8% vs local median 2.6% in Boise City — top-decile yield for the area; either an underpriced asset or a hidden risk that comps aren't pricing in. Stress-test before assuming the spread holds.
Location & tenants
- Location reads: area grade D — affects rentability + tenant quality, not the cash-flow math above.
- Boise Independent District (urban): math 42% / reading 56% proficiency, ranked #36 of 92 in ID (top 39%) — families likely to look elsewhere, expect single-tenant / working-renter base with shorter leases.
- Zoned schools: White Pine Elementary School (math 48% / reading 54%, grade C-, #140 of 357 statewide, top 40%, 548 students, 23% FRL); Les Bois Junior High School (math 45% / reading 60%, grade C+, #25 of 109 statewide, top 23%, 705 students, 15% FRL); Timberline High School (math 53% / reading 74%, grade B-, #14 of 169 statewide, top 8%, 1,398 students, 10% FRL) — zoned schools average 16% FRL vs 33% district-wide (17 pts lower); this property's tenant base skews higher-income than the district average.
- Market conditions: 1 active listings in the ZIP; 5,129 units permitted in Ada County in 2024 (414 in 5+ unit buildings).
Forward outlook
- In year one you build about $5k of equity ($933 loan paydown + $4k appreciation (3.0% local appreciation)).
- Ada County population projected at +45% by 2050 — long-run rental-demand tailwind backs the buy-and-hold thesis.
- At projected returns (3.0% appreciation + 3.0% rent growth), your $38k cash investment doubles in ~7 years — after that, you're playing with house money.
- By year 7, paydown + projected appreciation supports a ~$32k cash-out refi (75% LTV) — recoverable capital for the next deal without selling this one.
Negotiation context
- It's been on market 45 days — a 3% lower offer ($131k) is reasonable based on typical stale-listing flexibility.
- 2 sale attempts since 9y ago with the ask held roughly flat each time — persistent listings suggest the price (not the market) is what's stuck; bring a comps-based counter.
Questions for the listing agent
- What do current leases actually rent for vs. the listed asking? Can we see a recent rent roll and the last 12 months of T-12 income?
- It's been on market 45 days. Have you received any prior offers? Is the seller open to a 18% concession, seller financing, or rate buy-down credit?
- Is there a deadline driving the sale (1031 exchange, divorce, estate, relocation)? That informs how much negotiation room exists.
- The area grade is low — what's the realistic commute time and amenity access for the typical tenant pool here? Any planned neighborhood developments (good or bad) we should know about?
- What's the average days-on-market for RENTAL listings here right now (not sales)? A rising rental-DOM trend means longer vacancies and softer asking-rent achievability than the comps imply.
- What's the recent tenant-quality profile in this submarket — average credit score on applications, eviction rate, late-payment / NSF rate, and stable-employment percentage? A property-management company in the area should have these aggregated.
- How much new for-sale + rental construction is in the pipeline within 1–3 miles? Heavy new supply typically softens prices + rents 12–24 months out; constrained supply supports both.
Investment metrics
- 1% rule
- 0.82% ✗
- Cap rate
- 5.77%
- Cash-on-cash
- -1.85%
- DSCR
- 0.92
- GRM
- 10.2
CMA / ARV
- ARV (on-the-fly)
- $60,984
- Comps found
- 1
Show comp detail 1 sale within ~0.75 mi
| Address | Dist | Beds/Ba | Sqft | Sold | Price | $/sf | Match |
|---|---|---|---|---|---|---|---|
| 2155 Blue Sage Ln | 0.22mi | 3/1.0 | 1,057 (+14%) | 11mo | $70,000 | $66 | 53 |
Match score weights: distance 35% · size 25% · config 20% · recency 20%. Top-matched comps best support the ARV.
Projected returns pro-forma
3.0% appreciation · 3.0% rent growth · sell at horizon
- IRR
- 5.8%
- Equity multiple
- 1.33×
- Total profit
- $12,560
- Equity at exit
- $60,702
- IRR
- 8.8%
- Equity multiple
- 2.32×
- Total profit
- $49,970
- Equity at exit
- $93,549
Cash invested: $37,800 (down + closing). Projections, not guarantees.
Landlord ↔ Tenant lean methodology
- Overall (STATE)
- 91 Strongly Landlord-Friendly
- State Idaho
- 91 Strongly Landlord-Friendly · R+18
- County
- — inherits STATE
- City
- — inherits STATE
ZIP-level market 83716-5719
- Active inventory
- 1
- Price-to-rent
- 10.2×
Monthly cashflow live
- Estimated rent
- $1,107 medium interval (Pro) →
- Mortgage (P&I)
- −$708
- Tax est. 1.5%
- −$169 /mo · $2,025/yr
- Insurance
- −$56
- HOA
- −$0
- Vacancy / Maint / Mgmt
- −$232
- Net cashflow
- $-58
Break-even live
Sensitivity live
| Price | -10% $35 | -5% $-12 | +0% $-58 | +5% $-105 | +10% $-152 |
|---|---|---|---|---|---|
| Rent | -10% $-146 | -5% $-102 | +0% $-58 | +5% $-15 | +10% $29 |
| Rate | -1.0pp $10 | -0.5pp $-24 | base $-58 | +0.5pp $-93 | +1.0pp $-129 |
UW: 25.0% down · 7.5% · 30yr · 1.5% tax · 5.0% vac · 8.0% maint · 8.0% mgmt
Financing live
Cash to close
- Down payment
- $33,750
- Closing costs
- $4,050
- Reserves months
- —
- Total cash needed
- —
Loan-product check · same deal, 3 products live
Conventional
25% down · 7.5% · 30yr
- Down + closing
- —
- Monthly P&I
- —
- Monthly cashflow
- —
- DSCR
- —
- Eligible?
- —
Personal DTI + credit; lowest rate.
DSCR
20% down · 8.5% · 30yr
- Down + closing
- —
- Monthly P&I
- —
- Monthly cashflow
- —
- DSCR
- —
- Eligible?
- —
No personal income docs; deal must DSCR.
Hard money
10% down · 12.0% · 12mo
- Down + closing
- —
- Monthly P&I
- —
- Monthly cashflow
- —
- DSCR
- —
- Eligible?
- —
Short-term bridge; refi at stabilization.
Listing history 19 events
-
2026-06-22days on market $135,000 Active 45 DOM
-
2026-06-18days on market $135,000 Active 42 DOM
-
2026-06-17days on market $135,000 Active 41 DOM
-
2026-06-16days on market $135,000 Active 40 DOM
-
2026-06-15days on market $135,000 Active 39 DOM
-
2026-06-13days on market $135,000 Active 37 DOM
-
2026-06-10days on market $135,000 Active 34 DOM
-
2026-06-09days on market $135,000 Active 33 DOM
-
2026-06-08days on market $135,000 Active 32 DOM
-
2026-06-07days on market $135,000 Active 31 DOM
-
2026-06-05days on market $135,000 Active 28 DOM
-
2026-06-03days on market $135,000 Active 27 DOM
-
2026-06-03days on market $135,000 Active 26 DOM
-
2026-06-01days on market $135,000 Active 25 DOM
-
2026-05-31days on market $135,000 Active 24 DOM
-
2026-05-07$135,000 Active
-
2018-05-22soldstatus Sold
-
2018-04-26status Pending
-
2017-12-06$44,900 Active
ⓘ Source: listings_history table (triggers on properties + properties_extension) + one-shot
backfill from property_details.listing_events for pre-trigger history.
Nearby sold comps map
Loading sold comps map…
Walkable amenities ~0.75 mi
Loading nearby amenities…
Taxation est. · year 1
- Rental income
- $13,284
- − Mortgage interest
- −$7,562
- − Property taxes
- −$2,025
- − Insurance
- −$675
- − Repairs & maintenance
- −$1,063
- − Management
- −$1,063
- − Depreciation
- −$3,927
- Taxable loss
- −$3,030
- Est. tax savings @ 24.0%
- +$727
- After-tax cash flow
- $27/yr
For passive investors: Depreciation is non-cash, so a rental often shows a tax loss while cash-flowing — sheltering income. Rental losses are passive: they offset passive income freely, and up to $25,000/yr can offset ordinary (W-2) income if you actively participate and your MAGI is under $100k (phasing out to $0 by $150k); unused losses carry forward. On sale, claimed depreciation is recaptured at up to 25%, and gains may owe capital-gains tax (a 1031 exchange can defer both). Figures are a year-1 estimate at your 24.0% rate — not tax advice; consult a CPA.
Schools (NCES district)
- District
- Boise Independent District
- NCES district ID
- 1600360
- Math proficiency
- 42% ▼ -5.00%
- Reading proficiency
- 56% ▼ -1.00%
- Median HH income
- $49,135
- Composite
- 41.82/100
- National rank
- #3388
- State rank
- #36 of 92 in ID
Livability — Boise City
No livability data for this city. (Only ~50 U.S. cities are tracked.)
Census & demographics
- Census place
- Boise City, ID
Population outlook (Ada County) Hauer SSP2
- Today (2025)
- 535,818 people
- By 2030
- 585,751 · +9.3%
- By 2040
- 682,435 · +27.4%
- By 2050
- 775,818 · +44.8%
- By 2075
- 994,458 · +85.6%
- By 2100
- 1,148,884 · +114.4%
Not yet ingested
- Political lean
- —
- Race & ethnicity
- —
- Common origin
- —
- Civics
- —
Market trends
- HPI YoY
- —
- Current HPI
- —
- Rent YoY
- —
- Metro
- —
- State GDP YoY
- ▲ 4.51%
- F500 in state
- 6
Industry mix (Fortune 500 HQ in ID)
| Industry | F500 HQs | Revenue |
|---|---|---|
| Retail | 1 | $79B |
|
||
| Technology | 1 | $25B |
|
||
| Food / Agriculture | 1 | $6B |
|
||
Price history
+200.7% since first listed4 events — show timeline
- 2026-05-07 Listed $135,000 IMLS
- 2018-05-22 Sold (MLS) — IMLS
- 2018-04-26 Pending — IMLS
- 2017-12-06 Listed $44,900 IMLS
Cash-flow waterfall
monthlySold comps — $/sqft
last 12 mo · ≤1 miLoading sold comps…