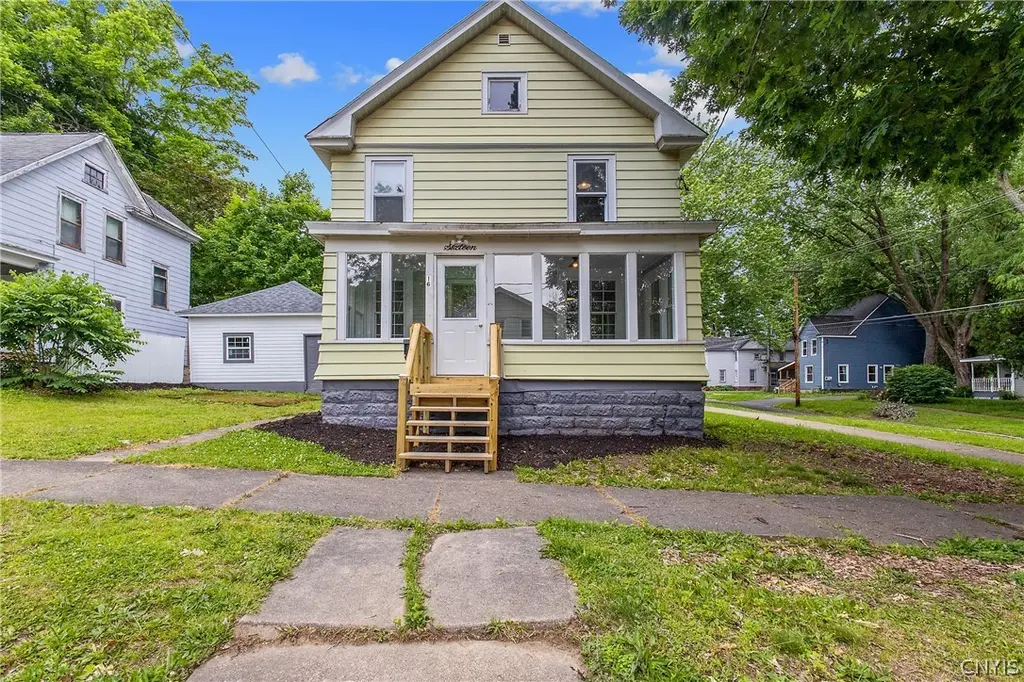
16 N 5th St · Fulton, NY
Flood risk 1/10 · Minimal
- FEMA flood zone
- X (unshaded)
- Chance of flooding over 30 yrs
- 0.0%
- Est. flood insurance / yr
- $473 – $860
Fire risk 1/10 · Minimal
- Est. fire insurance / yr
- $691 – $1,283
Heat risk 2/10 · Minimal
- Hot days now (above 95°F)
- 7 days/yr
- Hot days in 30 yrs
- 16 days/yr
Wind risk 1/10 · Minimal
- Chance of severe wind over 30 yrs
- 1.0%
Air-quality risk 2/10 · Minimal
- Unhealthy air days now
- 1 days/yr
- Unhealthy air days in 30 yrs
- 1 days/yr
Risk factors via First Street. Map © Google.
Why this score? — see what drove the F grade
The composite is a weighted blend of 9 inputs, each scored 0–100. Each bar is that input's sub-score; the figure is the points it added to the 100-point composite (weight × sub-score).
- Appreciation +8.4/10.0
- Cash flow +7.7/30.0
- Livability +3.1/5.0
- Schools +3.0/10.0
- Rent growth +2.5/5.0
- Condition / age +2.5/5.0
- 1% rule +2.3/10.0
- DSCR +1.8/10.0
- ARV discount +0.0/15.0
$199,900
🖨 Deal sheet (PDF) 📄 Offer letter ✓ Due diligence
Listing remarks MLS
Corner lot home offer lots of old world charm and character. The home features a living room, dining room and kitchen on the first floor with four bedrooms and a full bathroom on the second floor. Pick this one up to add to your rental portfolio or renovate and resell or use it as your primary home.
Key facts
- Fully renovated
- Grand foyer
- Impressive staircase
Tags
Property features AI
Exterior
- Parking: Detached garage; 2-car garage
- Utilities: Public water (connected); Sewer connected
- Home design: 2-story home; Resale property; Vinyl siding
- Construction: Block foundation; Vinyl siding exterior
- Exterior features: Blacktop driveway; Corner lot; Rectangular lot (63 x 66)
Interior
- Kitchen: Dishwasher; Electric oven; Electric range; Garbage disposal; Refrigerator
- Bedrooms: Total rooms: 10 (includes entry foyer)
- Flooring: Hardwood; Varies
- Bathrooms: 2 full bathrooms; 1 main-level bathroom
- Heating & cooling: Gas heating; Radiant heat
- Interior features: Breakfast bar; Entrance foyer; Combined living/dining room; Full basement
- Laundry & utility: Gas water heater
Neighborhood map
What this means for you Summary
Snapshot
- This is a 4-bed/1.0-bath single-family listed at $200k.
Deal economics
- At list price, monthly cash flow is $-233 ($-3k/yr) — negative.
- To cash-flow at today's rent, offer at most $159k (20.6% below list).
- To meet the 1% rule (rent ≥ 1% of price), the offer needs to be $147k (26.7% below list).
- Recommended offer: $147k (26.7% below list) — sets the bar for 1% rule.
- Cap rate 4.9% vs local median 6.7% in Fulton — below-typical yield; the buyer is paying a premium for something (appreciation thesis, condition, location) that the cap rate doesn't capture.
Location & tenants
- Location reads 61/100 on livability (#907 in NY) — a middle-class / working-renter tenant base. Strengths: cost of living A+, housing A+; Watch: employment D, crime F, amenities F.
- Fulton City School District (town): math 29% / reading 43% proficiency, ranked #554 of 590 in NY (top 94%) — families likely to look elsewhere, expect single-tenant / working-renter base with shorter leases.
- Zoned schools: Granby Elementary School (math 17% / reading 32%, grade F, #1,846 of 2,108 statewide, top 91%, 471 students, 70% FRL); Fulton Junior High School (math 15% / reading 34%, grade F, #611 of 729 statewide, top 88%, 500 students, 62% FRL); G Ray Bodley High School (math 83% / reading 86%, grade A, #379 of 1,100 statewide, top 36%, 976 students, 57% FRL).
- Market conditions: 116 active listings in the ZIP; 3 comparable units currently listed for rent nearby; rentals at typical pace (median 15d on market — plan ~3-4 weeks tenant-placement turnaround); 172 units permitted in Oswego County in 2024 (27 in 5+ unit buildings).
Forward outlook
- In year one you build about $15k of equity ($1k loan paydown + $13k appreciation (6.8% local appreciation)).
- Oswego County population projected at -23% by 2050 — secular population decline; favor cash flow + early exit over multi-decade hold.
- By year 3, paydown + projected appreciation supports a ~$37k cash-out refi (75% LTV) — recoverable capital for the next deal without selling this one.
Negotiation context
- Only 9 days on market — expect competitive offers; lowballing is unlikely to land.
- 5 sale attempts since 9y ago with the ask held roughly flat each time — persistent listings suggest the price (not the market) is what's stuck; bring a comps-based counter.
- Current owner paid $150k; 34% above their basis — modest negotiation headroom, anchor on the comps not their cost.
Risks & watch-outs
- Watch-outs: built in 1908 — expect roof / HVAC / electrical / plumbing capex.
Questions for the listing agent
- What do current leases actually rent for vs. the listed asking? Can we see a recent rent roll and the last 12 months of T-12 income?
- Built in 1908 — when were the roof, HVAC, electrical panel, plumbing, and water heater last replaced?
- Is there a deadline driving the sale (1031 exchange, divorce, estate, relocation)? That informs how much negotiation room exists.
- Schools are D-rated, which usually means shorter tenancies and higher turnover. Who's the typical renter profile here, and what's been the actual vacancy rate?
- Crime grade is F in this area — have there been break-ins, vandalism, or insurance claims at this property in the last 3 years? What carrier currently insures it and at what premium?
- The area grade is low — what's the realistic commute time and amenity access for the typical tenant pool here? Any planned neighborhood developments (good or bad) we should know about?
- What's the average days-on-market for RENTAL listings here right now (not sales)? A rising rental-DOM trend means longer vacancies and softer asking-rent achievability than the comps imply.
- What's the recent tenant-quality profile in this submarket — average credit score on applications, eviction rate, late-payment / NSF rate, and stable-employment percentage? A property-management company in the area should have these aggregated.
- How much new for-sale + rental construction is in the pipeline within 1–3 miles? Heavy new supply typically softens prices + rents 12–24 months out; constrained supply supports both.
Investment metrics
- 1% rule
- 0.73% ✗
- Cap rate
- 4.89%
- Cash-on-cash
- -5.00%
- DSCR
- 0.78
- GRM
- 11.4
CMA / ARV
- ARV (on-the-fly)
- $141,120
- Comps found
- 12
Show comp detail 12 sales within ~0.75 mi
| Address | Dist | Beds/Ba | Sqft | Sold | Price | $/sf | Match |
|---|---|---|---|---|---|---|---|
| 614 Utica St | 0.23mi | 4/1.0 | 1,374 (+2%) | 3mo | $25,000 | $18 | 83 |
| 609 Seneca St | 0.14mi | 3/1.0 (-1) | 1,381 (+3%) | 2mo | $118,450 | $86 | 83 |
| 611 Erie St | 0.17mi | 3/1.5 (-1) | 1,320 (-2%) | 1mo | $110,000 | $83 | 81 |
| 117 S 7th St | 0.33mi | 3/1.0 (-1) | 1,347 (+0%) | 2mo | $50,000 | $37 | 78 |
| 10 N 8th St | 0.26mi | 3/2.0 (-1) | 1,316 (-2%) | 7mo | $150,000 | $114 | 70 |
| 524 Rochester St | 0.24mi | 4/2.0 | 1,460 (+9%) | 1mo | $80,000 | $55 | 69 |
| 514 Academy St | 0.34mi | 3/1.5 (-1) | 1,209 (-10%) | 4mo | $136,500 | $113 | 57 |
| 309 Pratt St | 0.67mi | 3/1.5 (-1) | 1,323 (-2%) | 8mo | $147,000 | $111 | 53 |
| 871 Oneida St | 0.49mi | 4/1.5 | 1,512 (+12%) | 5mo | $172,000 | $114 | 50 |
| 1019 Emery St | 0.64mi | 3/1.5 (-1) | 1,419 (+6%) | 7mo | $175,530 | $124 | 48 |
| 420 N 6th St | 0.61mi | 3/2.0 (-1) | 1,478 (+10%) | 1mo | $155,000 | $105 | 45 |
| 115 Phillips St | 0.69mi | 3/2.0 (-1) | 1,498 (+12%) | 4mo | $135,000 | $90 | 36 |
Match score weights: distance 35% · size 25% · config 20% · recency 20%. Top-matched comps best support the ARV.
Projected returns pro-forma
6.75% appreciation · 3.0% rent growth · sell at horizon
- IRR
- 13.2%
- Equity multiple
- 1.93×
- Total profit
- $51,874
- Equity at exit
- $135,218
- IRR
- 13.6%
- Equity multiple
- 3.90×
- Total profit
- $162,312
- Equity at exit
- $253,914
Cash invested: $55,972 (down + closing). Projections, not guarantees.
Landlord ↔ Tenant lean methodology
- Overall (STATE)
- 15 Strongly Tenant-Friendly
- State New York
- 15 Strongly Tenant-Friendly · D+10
- County
- — inherits STATE
- City
- — inherits STATE
ZIP-level market 13069
- Home prices YoY
- 2.3%
- Active inventory
- 116
- Price-to-rent
- 11.4×
Monthly cashflow live
- Estimated rent
- $1,466 medium interval (Pro) →
- Mortgage (P&I)
- −$1,048
- Tax from tax record
- −$260 /mo · $3,115/yr
- Insurance
- −$83
- HOA
- −$0
- Vacancy / Maint / Mgmt
- −$308
- Net cashflow
- $-233
Break-even live
Sensitivity live
| Price | -10% $-120 | -5% $-177 | +0% $-233 | +5% $-290 | +10% $-346 |
|---|---|---|---|---|---|
| Rent | -10% $-349 | -5% $-291 | +0% $-233 | +5% $-175 | +10% $-117 |
| Rate | -1.0pp $-132 | -0.5pp $-182 | base $-233 | +0.5pp $-285 | +1.0pp $-338 |
UW: 25.0% down · 7.5% · 30yr · 1.5% tax · 5.0% vac · 8.0% maint · 8.0% mgmt
Financing live
Cash to close
- Down payment
- $49,975
- Closing costs
- $5,997
- Reserves months
- —
- Total cash needed
- —
Loan-product check · same deal, 3 products live
Conventional
25% down · 7.5% · 30yr
- Down + closing
- —
- Monthly P&I
- —
- Monthly cashflow
- —
- DSCR
- —
- Eligible?
- —
Personal DTI + credit; lowest rate.
DSCR
20% down · 8.5% · 30yr
- Down + closing
- —
- Monthly P&I
- —
- Monthly cashflow
- —
- DSCR
- —
- Eligible?
- —
No personal income docs; deal must DSCR.
Hard money
10% down · 12.0% · 12mo
- Down + closing
- —
- Monthly P&I
- —
- Monthly cashflow
- —
- DSCR
- —
- Eligible?
- —
Short-term bridge; refi at stabilization.
Rent comps 3 comps
| Address | Beds | Baths | Sqft | Rent | $/sqft | DOM | Units | Dist |
|---|---|---|---|---|---|---|---|---|
| 312 Utica St Fulton, NY | 3.0 | 1.0 | 1060 | $1,300 | $1.23 | 15d | 1 | 0.22mi |
| 303 S 5th St Fulton, NY | 4.0 | 1.5 | 1800 | $1,850 | $1.03 | 15d | 1 | 0.52mi |
| 262 W 4th St S Unit 1 Fulton, NY | 3.0 | 1.0 | 1316 | $1,500 | $1.14 | 45d | 1 | 0.95mi |
Listing history 7 events
-
2026-06-22days on market $199,900 Active 9 DOM
-
2026-06-18days on market $199,900 Active 6 DOM
-
2026-06-17days on market $199,900 Active 5 DOM
-
2026-06-16days on market $199,900 Active 4 DOM
-
2026-06-15days on market $199,900 Active 3 DOM
-
2026-06-13remarks 693-char remark
-
2026-06-13$199,900 Active 1 DOM
ⓘ Source: listings_history table (triggers on properties + properties_extension) + one-shot
backfill from property_details.listing_events for pre-trigger history.
Tax reassessment forecast NY · Partial reset (capped growth)
- Current annual tax
- $3,115 · $260/mo
- Projected year-2 tax
- $3,247 · $271/mo
- Expected delta
- +$131/yr (+$11/mo · 4.2%)
ⓘ Screening estimate from a state-policy table — verify with the county assessor before closing.
Climate risk First Street
- Flood 1/10 Low FEMA zone X (unshaded) · 0% chance over 30 yrs
- Wildfire 1/10 Low
- Heat 2/10 Low 7 d/yr ≥95°F today · 16 d/yr by 30 yrs out
- Wind 1/10 Low 100% chance of damaging wind over 30 yrs
- Air quality 2/10 Low 1 unhealthy d/yr today · 1 by 30 yrs out
Nearby sold comps map
Loading sold comps map…
Walkable amenities ~0.75 mi
Loading nearby amenities…
Taxation est. · year 1
- Rental income
- $17,591
- − Mortgage interest
- −$11,198
- − Property taxes
- −$3,115
- − Insurance
- −$1,000
- − Repairs & maintenance
- −$1,407
- − Management
- −$1,407
- − Depreciation
- −$5,815
- Taxable loss
- −$6,351
- Est. tax savings @ 24.0%
- +$1,524
- After-tax cash flow
- $-1,273/yr
For passive investors: Depreciation is non-cash, so a rental often shows a tax loss while cash-flowing — sheltering income. Rental losses are passive: they offset passive income freely, and up to $25,000/yr can offset ordinary (W-2) income if you actively participate and your MAGI is under $100k (phasing out to $0 by $150k); unused losses carry forward. On sale, claimed depreciation is recaptured at up to 25%, and gains may owe capital-gains tax (a 1031 exchange can defer both). Figures are a year-1 estimate at your 24.0% rate — not tax advice; consult a CPA.
Schools (NCES district)
- District
- Fulton City School District
- NCES district ID
- 3611700
- Math proficiency
- 29% ▼ -11.00%
- Reading proficiency
- 43% ▲ 5.00%
- Median HH income
- $43,337
- Composite
- 30.49/100
- National rank
- #6220
- State rank
- #554 of 590 in NY
Livability — Fulton
- Score
- 61/100
- State rank
- #907
- US rank
- #17723
Category grades
Schools grade is shown separately in the Schools card above.
Census & demographics
- Census place
- Fulton, NY
- Population (ZIP)
- 23,176
Population outlook (Oswego County) Hauer SSP2
- Today (2025)
- 114,465 people
- By 2030
- 109,968 · -3.9%
- By 2040
- 99,205 · -13.3%
- By 2050
- 87,979 · -23.1%
- By 2075
- 65,100 · -43.1%
- By 2100
- 47,117 · -58.8%
Race, ethnicity, and origin ACS 2023
- Neighborhood character
- Predominantly White (93%)
- Race & ethnicity
- White 93% Hispanic / Latino 4% Two or more races 3%
- Common ancestry
- Lithuanian 6% Romanian 6% Iranian 2%
- Foreign-born
- 2% · Canada
- Languages at home
- 96% English-only · Spanish 2% German/W. Germanic 1%
Political lean MEDSL · Oswego
- 2024 margin
- Strong R (+24.2) · D 37.9% · R 62.1%
- 2008→2024 swing
- -26.6pp toward R · 2008: 2.5pp · 2024: -24.2pp
- All cycles
- 2024: R+24.2 2020: R+20.2 2016: R+23.2 2012: D+7.9 2008: D+2.5
Not yet ingested
- Civics
- —
Market trends
- HPI YoY
- ▲ 6.75%
- Current HPI
- 304.443
- Rent YoY
- —
- Metro
- —
- State GDP YoY
- ▲ 2.60%
- F500 in state
- 92
Industry mix (Fortune 500 HQ in NY)
| Industry | F500 HQs | Revenue |
|---|---|---|
| Financial Services | 10 | $950B |
|
||
| Consumer Goods | 9 | $162B |
|
||
| Insurance | 4 | $225B |
|
||
| Telecommunications | 2 | $144B |
|
||
| Pharmaceuticals | 2 | $112B |
|
||
| Media / Entertainment | 2 | $69B |
|
||
Price history
+288.2% since first listed22 events — show timeline
- 2026-06-12 Listed $199,900 CNYIS
- 2022-09-15 Sold (Public Records) $149,500 Public Records
- 2022-09-12 Sold (MLS) $42,000 CNYIS
- 2022-08-13 Pending — CNYIS
- 2022-08-10 Contingent — CNYIS
- 2022-08-10 Price Changed $39,900 CNYIS
- 2022-06-30 Listed $44,900 CNYIS
- 2021-04-26 Pending — CNYIS
- 2020-09-15 Pending — CNYIS
- 2020-07-08 Contingent — CNYIS
- 2020-06-30 Listing Removed — CNYIS
- 2020-06-19 Price Changed $19,900 CNYIS
- 2020-05-19 Price Changed $22,000 CNYIS
- 2020-05-05 Price Changed $28,000 CNYIS
- 2020-03-19 Listed $34,900 CNYIS
- 2020-03-16 Listing Removed — CNYIS
- 2019-09-18 Listed $34,900 CNYIS
- 2017-10-20 Listing Removed — CNYIS
- 2017-09-15 Price Changed $35,900 CNYIS
- 2017-05-04 Listed $39,900 CNYIS
- 2000-02-23 Sold (Public Records) $23,956 Public Records
- 1995-06-06 Sold (Public Records) $51,500 Public Records
Property tax history
-0.5%/yrLatest (2025): $3,115 · +7.5% YoY. Source: county tax records.
Cash-flow waterfall
monthlySold comps — $/sqft
last 12 mo · ≤1 miLoading sold comps…