1741 Spyglass Dr · Austin, TX
Flood risk 1/10 · Minimal
- FEMA flood zone
- X (unshaded)
- Chance of flooding over 30 yrs
- 0.0%
- Est. flood insurance / yr
- $507 – $1,088
Fire risk 3/10 · Minor
- Est. fire insurance / yr
- $1,222 – $2,270
Heat risk 8/10 · Major
- Hot days now (above 108°F)
- 7 days/yr
- Hot days in 30 yrs
- 22 days/yr
Wind risk 8/10 · Major
- Chance of severe wind over 30 yrs
- 80.0%
Air-quality risk 2/10 · Minimal
- Unhealthy air days now
- 1 days/yr
- Unhealthy air days in 30 yrs
- 1 days/yr
Risk factors via First Street. Map © Google.
Why this score? — see what drove the D grade
The composite is a weighted blend of 9 inputs, each scored 0–100. Each bar is that input's sub-score; the figure is the points it added to the 100-point composite (weight × sub-score).
- Cash flow +11.6/30.0
- ARV discount +7.5/15.0
- Schools +6.8/10.0
- Livability +4.1/5.0
- DSCR +3.4/10.0
- 1% rule +3.3/10.0
- Rent growth +3.2/5.0
- Condition / age +2.5/5.0
- Appreciation +0.0/10.0
$290,000
🖨 Deal sheet (PDF) 📄 Offer letter ✓ Due diligence
Listing remarks MLS
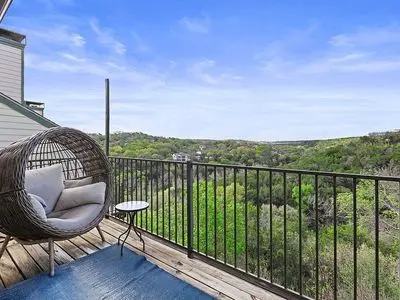
Serene setting overlooking the Barton Creek Greenbelt & capturing a great city view! Gated for security!Recently updated with stainless appliances, fresh paint & new wooden deck. Fireplace & spiral staircase leading to a loft, perfect for a study. Community pool! Bright & light! Min to downtown! Eanes schools!FEMA - Unknown Restrictions: Yes Sprinkler Sys:Yes
Key facts
- Built 1985
Neighborhood map
What this means for you Summary
Snapshot
- This is a 4-bed/4.0-bath condo listed at $290k.
Deal economics
- At list price, monthly cash flow is $-92 ($-1k/yr) — negative.
- To cash-flow at today's rent, offer at most $277k (4.6% below list).
- To meet the 1% rule (rent ≥ 1% of price), the offer needs to be $242k (16.5% below list).
- Recommended offer: $242k (16.5% below list) — sets the bar for 1% rule.
- Cap rate 5.9% vs local median 1.8% in Austin — top-decile yield for the area; either an underpriced asset or a hidden risk that comps aren't pricing in. Stress-test before assuming the spread holds.
Location & tenants
- Location reads 82/100 on livability (#16 in TX, #1,208 nationally) — a professional / high-income tenant draw. Strengths: amenities A+, commute A+, employment A+; Watch: cost of living D, crime F.
- Eanes ISD (suburban): math 70% / reading 74% proficiency, ranked #5 of 826 in TX (top 1%) — strong family-tenant draw, lease renewals of 3-5y typical; only 4% free/reduced lunch — higher-income household profile.
- Zoned schools: Cedar Creek El (math 73% / reading 73%, grade A, #101 of 4,322 statewide, top 2%, 524 students, 7% FRL); Hill Country Middle (math 72% / reading 72%, grade A, #52 of 1,662 statewide, top 3%, 975 students, 0% FRL); Westlake H S (math 76% / reading 89%, grade A, #23 of 1,632 statewide, top 1%, 2,825 students, 0% FRL) — zoned schools at 2% FRL track the district average.
- Market conditions: Rents rising (+2.6%/yr); 237 active listings in the ZIP; 1 comparable units currently listed for rent nearby; high-income renter base; 17,121 units permitted in Travis County in 2024 (11,963 in 5+ unit buildings).
- This rent is only 15% of the median local income ($188k/yr) — well below the 30% rent-burden line; pricing power to push rent on renewal without tenant pushback.
Forward outlook
- Local home prices are declining (-3.0%/yr); year-one equity from $2k of loan paydown is wiped out by about $9k of value loss. Plan a longer hold.
- Travis County population projected at +60% by 2050 — long-run rental-demand tailwind backs the buy-and-hold thesis.
Negotiation context
- Only 0 days on market — expect competitive offers; lowballing is unlikely to land.
- 4 sale attempts since 26y ago with the ask held roughly flat each time — persistent listings suggest the price (not the market) is what's stuck; bring a comps-based counter.
Risks & watch-outs
- Climate carrying-cost: severe wind risk, 80% chance of damaging wind over 30y; extreme-heat days projected 7→22/yr by 2055 (HVAC capex compounding) — expect insurance premiums to compound above CPI over the hold.
Questions for the listing agent
- What do current leases actually rent for vs. the listed asking? Can we see a recent rent roll and the last 12 months of T-12 income?
- Any open or pending special assessments — roof, HVAC, plumbing, elevator, façade? What's the per-unit balance and payoff schedule, and is the seller paying it off at close or rolling it to the buyer?
- Is there a deadline driving the sale (1031 exchange, divorce, estate, relocation)? That informs how much negotiation room exists.
- Crime grade is F in this area — have there been break-ins, vandalism, or insurance claims at this property in the last 3 years? What carrier currently insures it and at what premium?
- The area grade is low — what's the realistic commute time and amenity access for the typical tenant pool here? Any planned neighborhood developments (good or bad) we should know about?
- What's the average days-on-market for RENTAL listings here right now (not sales)? A rising rental-DOM trend means longer vacancies and softer asking-rent achievability than the comps imply.
- What's the recent tenant-quality profile in this submarket — average credit score on applications, eviction rate, late-payment / NSF rate, and stable-employment percentage? A property-management company in the area should have these aggregated.
- How much new apartment / multifamily construction is in the pipeline within 1–3 miles? Heavy new supply (>2% of stock underway) typically softens rents 12–24 months out; light construction supports rent growth.
Investment metrics
- 1% rule
- 0.83% ✗
- Cap rate
- 5.91%
- Cash-on-cash
- -1.36%
- DSCR
- 0.94
- GRM
- 10.0
CMA / ARV
No comps found within radius.
Projected returns pro-forma
-3.0% appreciation · 2.62% rent growth · sell at horizon
- IRR
- -18.9%
- Equity multiple
- 0.34×
- Total profit
- $-53,722
- Equity at exit
- $43,240
- IRR
- -12.2%
- Equity multiple
- 0.29×
- Total profit
- $-57,911
- Equity at exit
- $25,074
Cash invested: $81,200 (down + closing). Projections, not guarantees.
Landlord ↔ Tenant lean methodology
- Overall (STATE)
- 87 Strongly Landlord-Friendly
- State Texas
- 87 Strongly Landlord-Friendly · R+5
- County
- — inherits STATE
- City
- — inherits STATE
ZIP-level market 78746
- Rents YoY
- 2.6%
- Active inventory
- 237
- Price-to-rent
- 10.0×
Monthly cashflow live
- Estimated rent
- $2,421 medium interval (Pro) →
- Mortgage (P&I)
- −$1,521
- Tax est. 1.5%
- −$362 /mo · $4,350/yr
- Insurance
- −$121
- HOA
- −$0
- Vacancy / Maint / Mgmt
- −$508
- Net cashflow
- $-92
Break-even live
Sensitivity live
| Price | -10% $109 | -5% $8 | +0% $-92 | +5% $-192 | +10% $-292 |
|---|---|---|---|---|---|
| Rent | -10% $-283 | -5% $-187 | +0% $-92 | +5% $4 | +10% $99 |
| Rate | -1.0pp $54 | -0.5pp $-18 | base $-92 | +0.5pp $-167 | +1.0pp $-243 |
UW: 25.0% down · 7.5% · 30yr · 1.5% tax · 5.0% vac · 8.0% maint · 8.0% mgmt
Financing live
Cash to close
- Down payment
- $72,500
- Closing costs
- $8,700
- Reserves months
- —
- Total cash needed
- —
Loan-product check · same deal, 3 products live
Conventional
25% down · 7.5% · 30yr
- Down + closing
- —
- Monthly P&I
- —
- Monthly cashflow
- —
- DSCR
- —
- Eligible?
- —
Personal DTI + credit; lowest rate.
DSCR
20% down · 8.5% · 30yr
- Down + closing
- —
- Monthly P&I
- —
- Monthly cashflow
- —
- DSCR
- —
- Eligible?
- —
No personal income docs; deal must DSCR.
Hard money
10% down · 12.0% · 12mo
- Down + closing
- —
- Monthly P&I
- —
- Monthly cashflow
- —
- DSCR
- —
- Eligible?
- —
Short-term bridge; refi at stabilization.
Rent comps 1 comps
| Address | Beds | Baths | Sqft | Rent | $/sqft | DOM | Units | Dist |
|---|---|---|---|---|---|---|---|---|
| 2301 S Mopac Expy Austin, TX | 1.0–3.0 | 1.0–2.0 | 994 | $2,651 | $2.67 | 0d | 36 | 0.48mi |
HOA detail condo
- Monthly dues
- $0 · $0/yr
- Likely covers
- poolsecurity
- Assessments
- None detected in remarks — confirm with the listing agent.
Listing history 9 events
-
2026-05-26$290,000
-
2011-04-29soldstatus Sold 386-char remark
Show marketing remark (386 chars)
Serene setting overlooking the Barton Creek Greenbelt & capturing a great city view! Gated for security!Recently updated with stainless appliances, fresh paint & new wooden deck. Fireplace & spiral staircase leading to a loft, perfect for a study. Community pool! Bright & light! Min to downtown! Eanes schools!FEMA - Unknown Restrictions: Yes Sprinkler Sys:Yes
-
2011-04-10status Pending - Taking Backups 386-char remark
Show marketing remark (386 chars)
Serene setting overlooking the Barton Creek Greenbelt & capturing a great city view! Gated for security!Recently updated with stainless appliances, fresh paint & new wooden deck. Fireplace & spiral staircase leading to a loft, perfect for a study. Community pool! Bright & light! Min to downtown! Eanes schools!FEMA - Unknown Restrictions: Yes Sprinkler Sys:Yes
-
2011-03-27$164,900 Active 386-char remark
Show marketing remark (386 chars)
Serene setting overlooking the Barton Creek Greenbelt & capturing a great city view! Gated for security!Recently updated with stainless appliances, fresh paint & new wooden deck. Fireplace & spiral staircase leading to a loft, perfect for a study. Community pool! Bright & light! Min to downtown! Eanes schools!FEMA - Unknown Restrictions: Yes Sprinkler Sys:Yes
-
2003-04-09historical
-
2002-11-01
-
2000-10-19soldstatus
-
2000-10-06historical
-
2000-08-02$133,000
ⓘ Source: listings_history table (triggers on properties + properties_extension) + one-shot
backfill from property_details.listing_events for pre-trigger history.
Climate risk First Street
- Flood 1/10 Low FEMA zone X (unshaded) · 0% chance over 30 yrs
- Wildfire 3/10 Moderate
- Heat 8/10 Severe 7 d/yr ≥108°F today · 22 d/yr by 30 yrs out
- Wind 8/10 Severe 80% chance of damaging wind over 30 yrs
- Air quality 2/10 Low 1 unhealthy d/yr today · 1 by 30 yrs out
Nearby sold comps map
Loading sold comps map…
Walkable amenities ~0.75 mi
Loading nearby amenities…
Taxation est. · year 1
- Rental income
- $29,049
- − Mortgage interest
- −$16,245
- − Property taxes
- −$4,350
- − Insurance
- −$1,450
- − Repairs & maintenance
- −$2,324
- − Management
- −$2,324
- − Depreciation
- −$8,436
- Taxable loss
- −$6,080
- Est. tax savings @ 24.0%
- +$1,459
- After-tax cash flow
- $358/yr
For passive investors: Depreciation is non-cash, so a rental often shows a tax loss while cash-flowing — sheltering income. Rental losses are passive: they offset passive income freely, and up to $25,000/yr can offset ordinary (W-2) income if you actively participate and your MAGI is under $100k (phasing out to $0 by $150k); unused losses carry forward. On sale, claimed depreciation is recaptured at up to 25%, and gains may owe capital-gains tax (a 1031 exchange can defer both). Figures are a year-1 estimate at your 24.0% rate — not tax advice; consult a CPA.
Schools (NCES district)
- District
- Eanes ISD
- NCES district ID
- 4817760
- Math proficiency
- 70% ▼ -11.00%
- Reading proficiency
- 74% ▼ -8.00%
- Median HH income
- $127,896
- Composite
- 68.46/100
- National rank
- #344
- State rank
- #5 of 826 in TX
Livability — Austin
- Score
- 82/100
- State rank
- #16
- US rank
- #1208
Category grades
Schools grade is shown separately in the Schools card above.
Census & demographics
- Census place
- Austin, TX
- County
- Travis County · 1,299,254 people
- City population
- 1,066,854
- Metro
- Austin-Round Rock-Georgetown, TX
- Population (ZIP)
- 28,256
- Household income
- $188,414
- Rent vs Own
- Severe rent burden
- 816.0
Population outlook (Travis County) Hauer SSP2
- Today (2025)
- 1,545,133 people
- By 2030
- 1,729,269 · +11.9%
- By 2040
- 2,097,596 · +35.8%
- By 2050
- 2,463,890 · +59.5%
- By 2075
- 3,249,374 · +110.3%
- By 2100
- 3,801,868 · +146.1%
Race, ethnicity, and origin ACS 2023
- Neighborhood character
- Predominantly White (75%)
- Race & ethnicity
- White 75% Hispanic / Latino 11% Asian 8% Two or more races 7% Black 1%
- Hispanic origin (detail)
- Mexican 8%
- Common ancestry
- Italian 7% Slovak 3% Lithuanian 3%
- Foreign-born
- 12% · Canada, China, South Korea
- Languages at home
- 85% English-only · Spanish 5% Other Indo-European 4% Chinese 2%
Political lean MEDSL · Travis
- 2024 margin
- Solid D (+39.3) · D 68.8% · R 29.4% · Other 1.8%
- 2008→2024 swing
- +9.9pp toward D · 2008: 29.4pp · 2024: 39.3pp
- All cycles
- 2024: D+39.3 2020: D+45.0 2016: D+38.9 2012: D+23.9 2008: D+29.4
Not yet ingested
- Civics
- —
Market trends
- HPI YoY
- ▼ -579.69%
- Current HPI
- 318.8109
- Rent YoY
- ▲ 2.62%
- Metro
- Austin-Round Rock-Georgetown, TX
- State GDP YoY
- ▲ 3.95%
- F500 in state
- 110
Industry mix (Fortune 500 HQ in TX)
| Industry | F500 HQs | Revenue |
|---|---|---|
| Energy | 16 | $1,198B |
|
||
| Technology | 5 | $198B |
|
||
| Engineering / Construction | 4 | $72B |
|
||
| Energy Services | 3 | $60B |
|
||
| Utilities | 3 | $41B |
|
||
| Healthcare | 2 | $330B |
|
||
Price history
+118.0% since first listed9 events — show timeline
- 2026-05-26 Listed $290,000 FSBO.com
- 2011-04-29 Sold (MLS) — Unlock MLS
- 2011-04-10 Pending — Unlock MLS
- 2011-03-27 Listed $164,900 Unlock MLS
- 2003-04-09 Delisted — Unlock MLS
- 2002-11-01 Listed — Unlock MLS
- 2000-10-19 Sold (MLS) — Unlock MLS
- 2000-10-06 Delisted — Unlock MLS
- 2000-08-02 Listed $133,000 Unlock MLS
Cash-flow waterfall
monthlySold comps — $/sqft
last 12 mo · ≤1 miLoading sold comps…