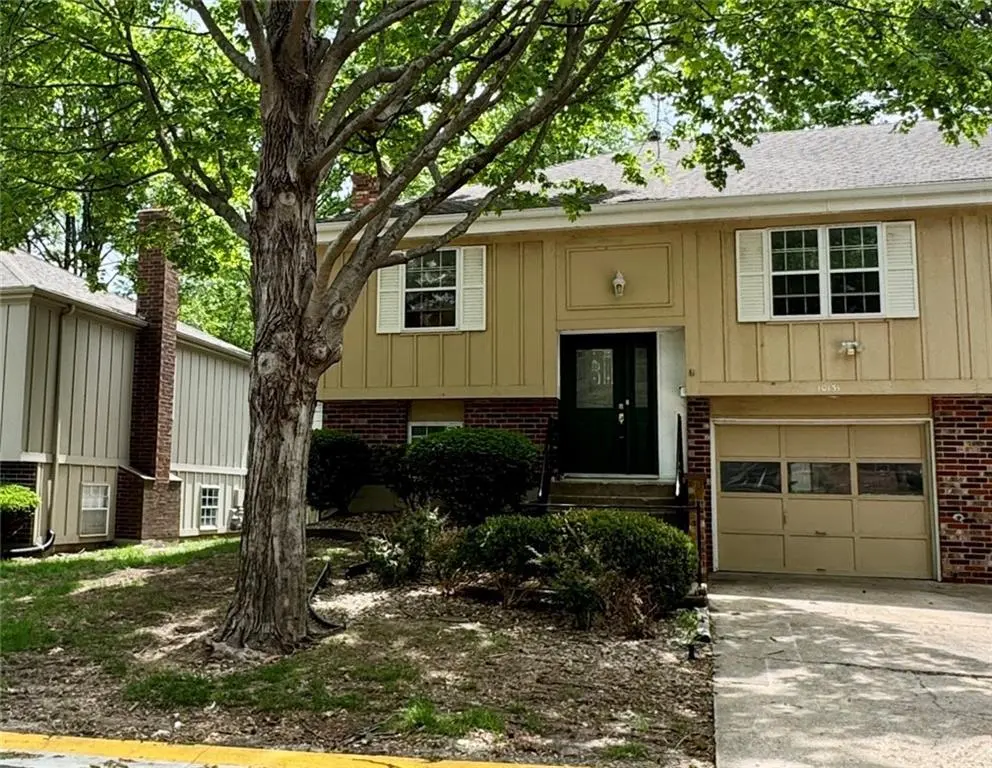
10151 W 96th Ter · Overland Park, KS
Flood risk 1/10 · Minimal
- FEMA flood zone
- X (unshaded)
- Chance of flooding over 30 yrs
- 0.0%
- Est. flood insurance / yr
- $473 – $860
Fire risk 1/10 · Minimal
- Est. fire insurance / yr
- $1,154 – $2,142
Heat risk 4/10 · Minor
- Hot days now (above 107°F)
- 7 days/yr
- Hot days in 30 yrs
- 17 days/yr
Wind risk 2/10 · Minimal
- Chance of severe wind over 30 yrs
- —
Air-quality risk 2/10 · Minimal
- Unhealthy air days now
- 2 days/yr
- Unhealthy air days in 30 yrs
- 2 days/yr
Risk factors via First Street. Map © Google.
Why this score? — see what drove the B+ grade
The composite is a weighted blend of 9 inputs, each scored 0–100. Each bar is that input's sub-score; the figure is the points it added to the 100-point composite (weight × sub-score).
- Cash flow +28.8/30.0
- ARV discount +15.0/15.0
- DSCR +10.0/10.0
- 1% rule +9.8/10.0
- Rent growth +4.0/5.0
- Livability +4.0/5.0
- Schools +3.8/10.0
- Condition / age +2.5/5.0
- Appreciation +0.0/10.0
$150,000
🖨 Deal sheet 📄 Offer letter ✓ Due diligence
Listing remarks MLS
* Buyer Warranty Plan * Excellent Condition * Attached Garage Loads Of Green Space * Trees * Newer Kitchen * Beautiful Deck Fenced Patio * Better Location In Gramercy Park * Sprinkler & Security System * Lovely Pool & Club House * Furnace 1994 * * * Switzer To 96 Tr East 1 Blk To Oak Tree Court Sign Right
Key facts
- Community pool
- Cul de sac
- Club house
Tags
Property features AI
Finance
- Other: Above-grade finished area listed as public records; Below-grade finished area listed as public records
- HOA & community: Part of Gramercy Park Homes Association; Monthly HOA dues ($210) covering trash, curbside recycling and street maintenance; Community clubhouse and pool; Lawn and snow removal provided
Exterior
- Parking: Attached garage with garage door opener; garage faces front; 1 garage space
- Utilities: Public water; Public sewer; Cable available, fiber available, metro free telecom options
- Home design: Residential half-duplex (attached); Split-entry design; Home faces northwest
- Construction: Board & batten siding with brick trim and frame construction; Composition roof
- Exterior features: Deck; Wood fencing; Located on a cul-de-sac; Not in a flood plain
Interior
- Kitchen: Eat-in kitchen
- Bedrooms: 3 bedrooms (upper and lower levels); Bedroom on lower level adjacent to family room
- Bathrooms: 2 full bathrooms (one upper, one lower)
- Heating & cooling: Forced air heating; Electric cooling
- Interior features: Split-entry floor plan; Finished daylight basement with inside entrance; Basement bedroom; Basement family room with fireplace; Living/dining combo; Eat-in kitchen
- Laundry & utility: Laundry located in the garage
Neighborhood map
What this means for you Summary
Snapshot
- This is a 3-bed/2.0-bath townhouse listed at $150k.
Deal economics
- At list price, monthly cash flow is $504 ($6k/yr) — positive.
- The deal already cash-flows at list — no discount required.
- Meets the 1% rule at list price ($2k rent vs $150k).
- Cap rate 10.3% vs local median 3.9% in Overland Park — top-decile yield for the area; either an underpriced asset or a hidden risk that comps aren't pricing in. Stress-test before assuming the spread holds.
Location & tenants
- Location reads 80/100 on livability (#16 in KS, #1,851 nationally) — a professional / high-income tenant draw. Strengths: employment A+, housing A+, crime B; Watch: health & safety C-, commute D+.
- Shawnee Mission Pub Schools (suburban): math 38% / reading 46% proficiency, ranked #22 of 169 in KS (top 13%) — families likely to look elsewhere, expect single-tenant / working-renter base with shorter leases.
- Zoned schools: Oak Park-Carpenter Elementary (math 64% / reading 66%, grade B+, #43 of 684 statewide, top 6%, 503 students, 23% FRL).
- Zoned-school proficiency averages 65% at this address vs 42% district-wide (+23 pts) — the actual schools serving this property are materially stronger than the Shawnee Mission Pub Schools average implies; a family-tenant draw the district grade alone would hide.
- Market conditions: Rents rising fast (+5.9%/yr); 141 active listings in the ZIP; 10 comparable units currently listed for rent nearby; rentals at typical pace (median 17d on market — plan ~3-4 weeks tenant-placement turnaround); solid renter incomes; 2,969 units permitted in Johnson County in 2024 (1,066 in 5+ unit buildings).
- This rent runs 33% of the median local income ($81k/yr) — at the standard rent-burdened threshold; future hikes will face affordability resistance.
Forward outlook
- Local home prices are declining (-3.0%/yr); year-one equity from $1k of loan paydown is wiped out by about $4k of value loss. Plan a longer hold.
- Johnson County population projected at +27% by 2050 — long-run rental-demand tailwind backs the buy-and-hold thesis.
- At projected returns (-3.0% appreciation + 5.9% rent growth), your $42k cash investment doubles in ~7 years — after that, you're playing with house money.
Negotiation context
- Only 4 days on market — expect competitive offers; lowballing is unlikely to land.
- 2 sale attempts since 29y ago with the ask held roughly flat each time — persistent listings suggest the price (not the market) is what's stuck; bring a comps-based counter.
Questions for the listing agent
- Built in 1972 — when were the roof, HVAC, electrical panel, plumbing, and water heater last replaced?
- What does the HOA fee cover, when was the last increase, and are there any pending special assessments or reserve-fund shortfalls?
- Is there a deadline driving the sale (1031 exchange, divorce, estate, relocation)? That informs how much negotiation room exists.
- Schools are B-rated — typically a magnet for longer-tenancy family renters. What's the average tenant stay here, and is there a school-zone premium baked into asking?
- What's the average days-on-market for RENTAL listings here right now (not sales)? A rising rental-DOM trend means longer vacancies and softer asking-rent achievability than the comps imply.
- What's the recent tenant-quality profile in this submarket — average credit score on applications, eviction rate, late-payment / NSF rate, and stable-employment percentage? A property-management company in the area should have these aggregated.
- How much new for-sale + rental construction is in the pipeline within 1–3 miles? Heavy new supply typically softens prices + rents 12–24 months out; constrained supply supports both.
Investment metrics
- 1% rule
- 1.48% ✓
- Cap rate
- 10.33%
- Cash-on-cash
- 14.41%
- DSCR
- 1.64
- GRM
- 5.6
CMA / ARV
- ARV (on-the-fly)
- $237,010
- Comps found
- 12
Show comp detail 12 sales within ~0.75 mi
| Address | Dist | Beds/Ba | Sqft | Sold | Price | $/sf | Match |
|---|---|---|---|---|---|---|---|
| 10151 W 96th Ter | 0.00mi | 3/2.0 | 1,370 (0%) | 1mo | $150,000 | $109 | 99 |
| 9692 Wedd St | 0.07mi | 3/2.0 | 1,236 (-10%) | 1mo | $230,000 | $186 | 80 |
| 10219 W 96th Ter | 0.09mi | 2/1.5 (-1) | 1,452 (+6%) | 8mo | $249,900 | $172 | 72 |
| 9505 Perry Ln | 0.22mi | 2/1.5 (-1) | 1,452 (+6%) | 7mo | $242,000 | $167 | 67 |
| 9624 Perry Ln Unit E | 0.12mi | 2/2.0 (-1) | 1,168 (-15%) | 2mo | $172,000 | $147 | 63 |
| 9600 Perry Ln | 0.16mi | 3/2.5 | 1,560 (+14%) | 12mo | $220,000 | $141 | 58 |
| 10120 W 96th St Unit F | 0.12mi | 2/2.0 (-1) | 1,168 (-15%) | 12mo | $175,000 | $150 | 55 |
| 10920 W 96th Pl | 0.50mi | 2/2.0 (-1) | 1,257 (-8%) | 13mo | $319,900 | $254 | 47 |
| 9629 Reeder St | 0.53mi | 3/2.0 | 1,560 (+14%) | 13mo | $375,000 | $240 | 42 |
| 9415 Bluejacket St | 0.59mi | 2/2.0 (-1) | 1,212 (-12%) | 11mo | $217,500 | $179 | 39 |
| 9819 Nieman Pl | 0.66mi | 2/2.5 (-1) | 1,507 (+10%) | 8mo | $350,000 | $232 | 38 |
| 9337 Ballentine St | 0.66mi | 2/1.0 (-1) | 1,184 (-14%) | 13mo | $205,000 | $173 | 27 |
Match score weights: distance 35% · size 25% · config 20% · recency 20%. Top-matched comps best support the ARV.
Projected returns pro-forma
-3.0% appreciation · 5.91% rent growth · sell at horizon
- IRR
- 8.6%
- Equity multiple
- 1.35×
- Total profit
- $14,676
- Equity at exit
- $22,365
- IRR
- 20.4%
- Equity multiple
- 3.00×
- Total profit
- $83,993
- Equity at exit
- $12,969
Cash invested: $42,000 (down + closing). Projections, not guarantees.
Landlord ↔ Tenant lean methodology
- Overall (STATE)
- 83 Strongly Landlord-Friendly
- State Kansas
- 83 Strongly Landlord-Friendly · R+10
- County
- — inherits STATE
- City
- — inherits STATE
ZIP-level market 66212
- Rents YoY
- 5.9%
- Active inventory
- 141
- Price-to-rent
- 5.6×
Monthly cashflow live
- Estimated rent
- $2,223 high interval (Pro) →
- Mortgage (P&I)
- −$787
- Tax from tax record
- −$193 /mo · $2,316/yr
- Insurance
- −$62
- HOA
- −$210
- Vacancy / Maint / Mgmt
- −$467
- Net cashflow
- $504
Break-even live
UW: 25.0% down · 7.5% · 30yr · 1.5% tax · 5.0% vac · 8.0% maint · 8.0% mgmt
Financing live
Cash to close
- Down payment
- $37,500
- Closing costs
- $4,500
- Reserves months
- —
- Total cash needed
- —
Loan-product check · same deal, 3 products live
Conventional
25% down · 7.5% · 30yr
- Down + closing
- —
- Monthly P&I
- —
- Monthly cashflow
- —
- DSCR
- —
- Eligible?
- —
Personal DTI + credit; lowest rate.
DSCR
20% down · 8.5% · 30yr
- Down + closing
- —
- Monthly P&I
- —
- Monthly cashflow
- —
- DSCR
- —
- Eligible?
- —
No personal income docs; deal must DSCR.
Hard money
10% down · 12.0% · 12mo
- Down + closing
- —
- Monthly P&I
- —
- Monthly cashflow
- —
- DSCR
- —
- Eligible?
- —
Short-term bridge; refi at stabilization.
Rent comps 10 comps
| Address | Beds | Baths | Sqft | Rent | $/sqft | DOM | Units | Dist |
|---|---|---|---|---|---|---|---|---|
| 9108 W 95th St Overland Park, KS | 3.0 | 2.5 | 1632 | $2,200 | $1.35 | 10d | 1 | 0.68mi |
| 9010 W 101st St Overland Park, KS | 3.0 | 1.0 | 950 | $1,795 | $1.89 | 17d | 1 | 0.82mi |
| 9160 W 103rd St Overland Park, KS | 1.0–2.0 | 1.0–2.0 | 1052 | $2,933 | $2.79 | 10d | 1 | 0.83mi |
| 8900 W 102nd Ter Overland Park, KS | 1.0–3.0 | 1.0–2.0 | 1312 | $1,980 | $1.51 | 7d | 1 | 1.09mi |
| 8211 W 97th St Overland Park, KS | 4.0 | 2.5 | 1681 | $2,295 | $1.37 | 23d | 1 | 1.16mi |
| 9670 Halsey St Lenexa, KS | 1.0–3.0 | 1.0–2.0 | 1025 | $1,775 | $1.73 | 23d | 1 | 1.23mi |
| 9301 Santa Fe Ln Overland Park, KS | 1.0–2.0 | 1.0–2.0 | 982 | $3,642 | $3.71 | 10d | 1 | 1.23mi |
| 9436 Craig Dr Overland Park, KS | 3.0 | 2.5 | 1848 | $2,326 | $1.26 | 23d | 1 | 1.32mi |
| 9634 W 87th St Overland Park, KS | 2.0 | 2.5 | 1100 | $1,475 | $1.34 | 7d | 4 | 1.35mi |
| 8710 W 106th Ter Overland Park, KS | 1.0–3.0 | 1.0–2.0 | 1110 | $1,649 | $1.49 | 21d | 12 | 1.47mi |
HOA detail
- Monthly dues
- $210 · $2,520/yr
- Likely covers
- poolsecurity
Listing history 4 events
-
2026-05-08status Pending
-
2026-05-04$150,000 Active
-
1997-07-28soldstatus 322-char remark
Show marketing remark (322 chars)
* Buyer Warranty Plan * Excellent Condition * Attached Garage Loads Of Green Space * Trees * Newer Kitchen * Beautiful Deck Fenced Patio * Better Location In Gramercy Park * Sprinkler & Security System * Lovely Pool & Club House * Furnace 1994 * * * Switzer To 96 Tr East 1 Blk To Oak Tree Court Sign Right
-
1997-06-05$89,950 322-char remark
Show marketing remark (322 chars)
* Buyer Warranty Plan * Excellent Condition * Attached Garage Loads Of Green Space * Trees * Newer Kitchen * Beautiful Deck Fenced Patio * Better Location In Gramercy Park * Sprinkler & Security System * Lovely Pool & Club House * Furnace 1994 * * * Switzer To 96 Tr East 1 Blk To Oak Tree Court Sign Right
ⓘ Source: listings_history table (triggers on properties + properties_extension) + one-shot
backfill from property_details.listing_events for pre-trigger history.
Tax reassessment forecast KS · Resets to sale price
- Current annual tax
- $2,316 · $193/mo
- Projected year-2 tax
- $2,316 · $193/mo
- Expected delta
- $0/yr ($0/mo · 0.0%)
ⓘ Screening estimate from a state-policy table — verify with the county assessor before closing.
Climate risk First Street
- Flood 1/10 Low FEMA zone X (unshaded) · 0% chance over 30 yrs
- Wildfire 1/10 Low
- Heat 4/10 Moderate 7 d/yr ≥107°F today · 17 d/yr by 30 yrs out
- Wind 2/10 Low
- Air quality 2/10 Low 2 unhealthy d/yr today · 2 by 30 yrs out
Nearby sold comps map
Loading sold comps map…
Walkable amenities ~0.75 mi
Loading nearby amenities…
Taxation est. · year 1
- Rental income
- $26,679
- − Mortgage interest
- −$8,402
- − Property taxes
- −$2,316
- − Insurance
- −$750
- − Repairs & maintenance
- −$2,134
- − Management
- −$2,134
- − HOA
- −$2,520
- − Depreciation
- −$4,364
- Taxable income
- $4,059
- Est. tax owed @ 24.0%
- −$974
- After-tax cash flow
- $5,077/yr
For passive investors: Depreciation is non-cash, so a rental often shows a tax loss while cash-flowing — sheltering income. Rental losses are passive: they offset passive income freely, and up to $25,000/yr can offset ordinary (W-2) income if you actively participate and your MAGI is under $100k (phasing out to $0 by $150k); unused losses carry forward. On sale, claimed depreciation is recaptured at up to 25%, and gains may owe capital-gains tax (a 1031 exchange can defer both). Figures are a year-1 estimate at your 24.0% rate — not tax advice; consult a CPA.
Schools (NCES district)
- District
- Shawnee Mission Pub Schools
- NCES district ID
- 2011640
- Math proficiency
- 38% ▼ -6.00%
- Reading proficiency
- 46% ▼ -2.00%
- Median HH income
- $64,923
- Composite
- 37.55/100
- National rank
- #4391
- State rank
- #22 of 169 in KS
Livability — Overland Park
- Score
- 80/100
- State rank
- #16
- US rank
- #1851
Category grades
Schools grade is shown separately in the Schools card above.
Census & demographics
- Census place
- Overland Park, KS
- County
- Johnson County · 574,662 people
- City population
- 180,138
- Metro
- Kansas City, MO-KS
- Population (ZIP)
- 32,917
- Household income
- $81,477
- Rent vs Own
- Severe rent burden
- 1224.0
Population outlook (Johnson County) Hauer SSP2
- Today (2025)
- 663,396 people
- By 2030
- 702,585 · +5.9%
- By 2040
- 775,386 · +16.9%
- By 2050
- 841,772 · +26.9%
- By 2075
- 994,137 · +49.9%
- By 2100
- 1,073,036 · +61.7%
Race, ethnicity, and origin ACS 2023
- Neighborhood character
- Predominantly White (74%)
- Race & ethnicity
- White 74% Hispanic / Latino 11% Two or more races 9% Black 8% Asian 2%
- Hispanic origin (detail)
- Mexican 7%
- Common ancestry
- Italian 3% Lithuanian 2% Slovak 2%
- Foreign-born
- 10% · Canada, Vietnam
- Languages at home
- 87% English-only · Spanish 6% Other Indo-European 1% Vietnamese 1%
Political lean MEDSL · Johnson
- 2024 margin
- Lean D (+8.5) · D 53.4% · R 44.9% · Other 1.8%
- 2008→2024 swing
- +17.5pp toward D · 2008: -9.0pp · 2024: 8.5pp
- All cycles
- 2024: D+8.5 2020: D+8.2 2016: R+2.7 2012: R+17.8 2008: R+9.0
Not yet ingested
- Civics
- —
Market trends
- HPI YoY
- ▼ -268.56%
- Current HPI
- 273.2798
- Rent YoY
- ▲ 5.91%
- Metro
- Kansas City, MO-KS
- State GDP YoY
- —
- F500 in state
- 0
Price history
+66.8% since first listed4 events — show timeline
- 2026-05-08 Pending — Heartland MLS as Distributed by MLS Grid
- 2026-05-04 Listed $150,000 Heartland MLS as Distributed by MLS Grid
- 1997-07-28 Sold (MLS) — Heartland MLS as Distributed by MLS Grid
- 1997-06-05 Listed $89,950 Heartland MLS as Distributed by MLS Grid
Property tax history
+5.7%/yrLatest (2025): $2,316 · +7.6% YoY. Source: county tax records.
Cash-flow waterfall
monthlySold comps — $/sqft
last 12 mo · ≤1 miLoading sold comps…