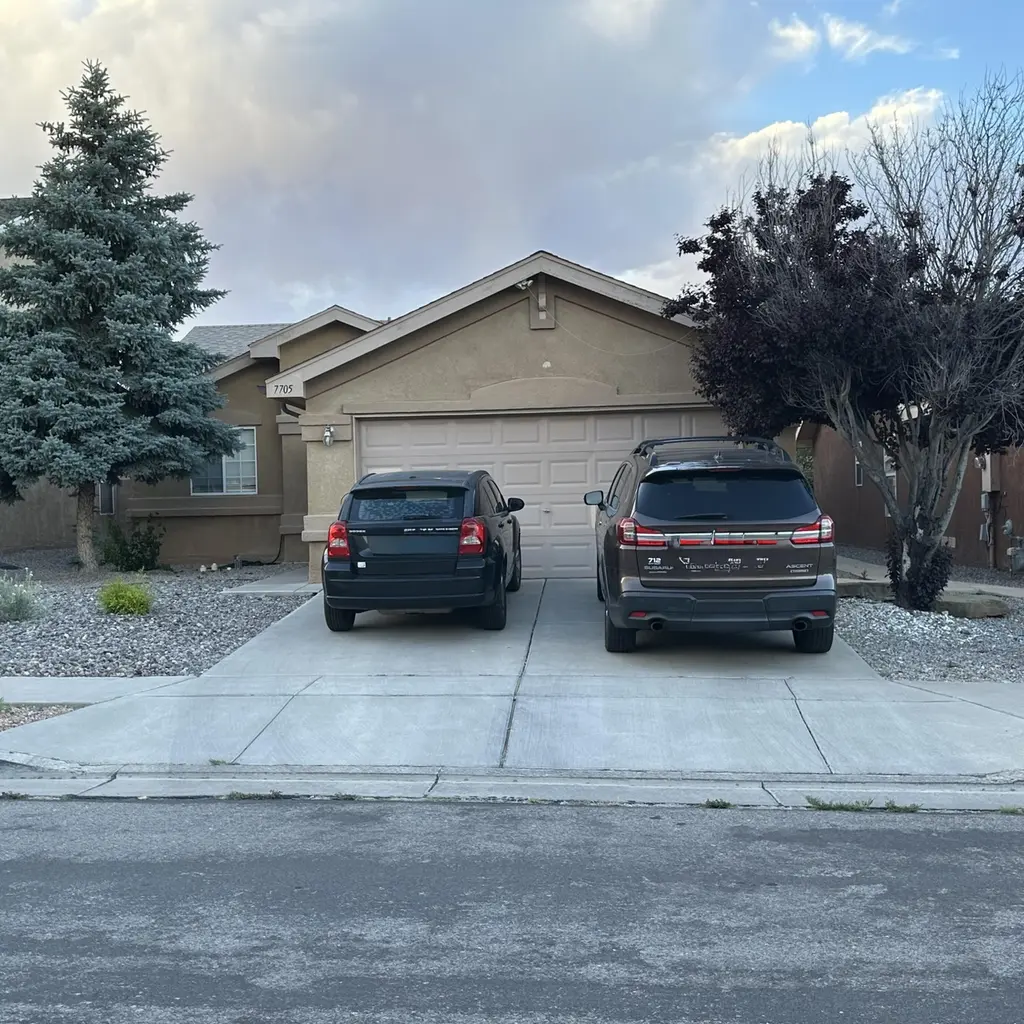
7705 Eagle Ave NW · Albuquerque, NM
Flood risk 1/10 · Minimal
- FEMA flood zone
- X (unshaded)
- Chance of flooding over 30 yrs
- 0.0%
- Est. flood insurance / yr
- $507 – $1,088
Fire risk 3/10 · Minor
- Est. fire insurance / yr
- $706 – $1,312
Heat risk 4/10 · Minor
- Hot days now (above 96°F)
- 6 days/yr
- Hot days in 30 yrs
- 15 days/yr
Wind risk 1/10 · Minimal
- Chance of severe wind over 30 yrs
- —
Air-quality risk 3/10 · Minor
- Unhealthy air days now
- 3 days/yr
- Unhealthy air days in 30 yrs
- 4 days/yr
Risk factors via First Street. Map © Google.
Why this score? — see what drove the D- grade
The composite is a weighted blend of 9 inputs, each scored 0–100. Each bar is that input's sub-score; the figure is the points it added to the 100-point composite (weight × sub-score).
- Cash flow +12.0/30.0
- ARV discount +7.5/15.0
- Schools +5.3/10.0
- DSCR +3.6/10.0
- Livability +3.6/5.0
- 1% rule +2.9/10.0
- Condition / age +2.5/5.0
- Rent growth +1.9/5.0
- Appreciation +0.0/10.0
$280,000
🖨 Deal sheet (PDF) 📄 Offer letter ✓ Due diligence
Listing remarks
Recent updates include newer roof in 2023,Newer Laminate Floors and conversion from Swamp Cooler to Refrigerated A/C. Nice desirable Ventana Ranch Area well kept. Tenants are the Buyes on this transaction. * * Sold before processing * *
Key facts
- 4,792 sq ft lot
- 2 garage spots
- Built 2003
Neighborhood map
What this means for you Summary
Snapshot
- This is a 3-bed/2.0-bath other listed at $280k.
Deal economics
- At list price, monthly cash flow is $-64 ($-771/yr) — negative.
- To cash-flow at today's rent, offer at most $269k (4.1% below list).
- To meet the 1% rule (rent ≥ 1% of price), the offer needs to be $222k (20.6% below list).
- Recommended offer: $222k (20.6% below list) — sets the bar for 1% rule.
- Cap rate 6.0% vs local median 3.6% in Albuquerque — top-decile yield for the area; either an underpriced asset or a hidden risk that comps aren't pricing in. Stress-test before assuming the spread holds.
Location & tenants
- Location reads 72/100 on livability (#13 in NM) — a middle-class / working-renter tenant base. Strengths: amenities A+, commute A+, cost of living A+; Watch: crime F.
- Albuquerque Public Schools (urban): math 51% / reading 75% proficiency, ranked #3 of 29 in NM (top 10%) — acceptable for families but not a draw, mixed tenant base, ~2y average lease; 60% free/reduced lunch — lower-income household profile, screen leases tightly.
- Zoned schools: Ventana Ranch Elementary (641 students, 37% FRL); Tony Hillerman Middle School (1,035 students, 30% FRL); Volcano Vista High (math 47% / reading 77%, grade B-, #26 of 110 statewide, top 23%, 2,216 students, 24% FRL) — zoned schools average 31% FRL vs 60% district-wide (29 pts lower); this property's tenant base skews higher-income than the district average.
- Market conditions: Rents soft (-2.5%/yr); 347 active listings in the ZIP; 8 comparable units currently listed for rent nearby; rentals at typical pace (median 23d on market — plan ~3-4 weeks tenant-placement turnaround); solid renter incomes; 1,316 units permitted in Bernalillo County in 2024 (546 in 5+ unit buildings).
- This rent runs 32% of the median local income ($84k/yr) — at the standard rent-burdened threshold; future hikes will face affordability resistance.
Forward outlook
- Local home prices are declining (-3.0%/yr); year-one equity from $2k of loan paydown is wiped out by about $8k of value loss. Plan a longer hold.
Negotiation context
- Only 0 days on market — expect competitive offers; lowballing is unlikely to land.
- 2 sale attempts since 8y ago with the ask held roughly flat each time — persistent listings suggest the price (not the market) is what's stuck; bring a comps-based counter.
Questions for the listing agent
- What do current leases actually rent for vs. the listed asking? Can we see a recent rent roll and the last 12 months of T-12 income?
- What does the HOA fee cover, when was the last increase, and are there any pending special assessments or reserve-fund shortfalls?
- Is there a deadline driving the sale (1031 exchange, divorce, estate, relocation)? That informs how much negotiation room exists.
- Schools are D-rated, which usually means shorter tenancies and higher turnover. Who's the typical renter profile here, and what's been the actual vacancy rate?
- Crime grade is F in this area — have there been break-ins, vandalism, or insurance claims at this property in the last 3 years? What carrier currently insures it and at what premium?
- The area grade is low — what's the realistic commute time and amenity access for the typical tenant pool here? Any planned neighborhood developments (good or bad) we should know about?
- What's the average days-on-market for RENTAL listings here right now (not sales)? A rising rental-DOM trend means longer vacancies and softer asking-rent achievability than the comps imply.
- What's the recent tenant-quality profile in this submarket — average credit score on applications, eviction rate, late-payment / NSF rate, and stable-employment percentage? A property-management company in the area should have these aggregated.
- How much new for-sale + rental construction is in the pipeline within 1–3 miles? Heavy new supply typically softens prices + rents 12–24 months out; constrained supply supports both.
Investment metrics
- 1% rule
- 0.79% ✗
- Cap rate
- 6.02%
- Cash-on-cash
- -0.98%
- DSCR
- 0.96
- GRM
- 10.5
CMA / ARV
No comps found within radius.
Projected returns pro-forma
-3.0% appreciation · 0.0% rent growth · sell at horizon
- IRR
- -21.1%
- Equity multiple
- 0.29×
- Total profit
- $-56,014
- Equity at exit
- $41,749
- IRR
- -23.0%
- Equity multiple
- -0.01×
- Total profit
- $-79,366
- Equity at exit
- $24,209
Cash invested: $78,400 (down + closing). Projections, not guarantees.
Landlord ↔ Tenant lean methodology
- Overall (STATE)
- 55 Moderately Landlord-Leaning
- State New Mexico
- 55 Moderately Landlord-Leaning · D+3
- County
- — inherits STATE
- City
- — inherits STATE
ZIP-level market 87114
- Rents YoY
- -2.5%
- Active inventory
- 347
- Price-to-rent
- 10.5×
Monthly cashflow live
- Estimated rent
- $2,223 high interval (Pro) →
- Mortgage (P&I)
- −$1,468
- Tax from tax record
- −$210 /mo · $2,521/yr
- Insurance
- −$117
- HOA
- −$25
- Vacancy / Maint / Mgmt
- −$467
- Net cashflow
- $-64
Break-even live
Sensitivity live
| Price | -10% $94 | -5% $15 | +0% $-64 | +5% $-143 | +10% $-223 |
|---|---|---|---|---|---|
| Rent | -10% $-240 | -5% $-152 | +0% $-64 | +5% $24 | +10% $111 |
| Rate | -1.0pp $77 | -0.5pp $7 | base $-64 | +0.5pp $-137 | +1.0pp $-211 |
UW: 25.0% down · 7.5% · 30yr · 1.5% tax · 5.0% vac · 8.0% maint · 8.0% mgmt
Financing live
Cash to close
- Down payment
- $70,000
- Closing costs
- $8,400
- Reserves months
- —
- Total cash needed
- —
Loan-product check · same deal, 3 products live
Conventional
25% down · 7.5% · 30yr
- Down + closing
- —
- Monthly P&I
- —
- Monthly cashflow
- —
- DSCR
- —
- Eligible?
- —
Personal DTI + credit; lowest rate.
DSCR
20% down · 8.5% · 30yr
- Down + closing
- —
- Monthly P&I
- —
- Monthly cashflow
- —
- DSCR
- —
- Eligible?
- —
No personal income docs; deal must DSCR.
Hard money
10% down · 12.0% · 12mo
- Down + closing
- —
- Monthly P&I
- —
- Monthly cashflow
- —
- DSCR
- —
- Eligible?
- —
Short-term bridge; refi at stabilization.
Rent comps 8 comps
| Address | Beds | Baths | Sqft | Rent | $/sqft | DOM | Units | Dist |
|---|---|---|---|---|---|---|---|---|
| 7520 Button Quail Ave NW Albuquerque, NM | 4.0 | 2.0 | 1473 | $2,295 | $1.56 | 13d | 1 | 0.19mi |
| 7605 Kentwood Ave NW Albuquerque, NM | 3.0 | 2.0 | 1700 | $1,995 | $1.17 | 23d | 1 | 0.20mi |
| 7109 Acton Ct NW Albuquerque, NM | 3.0 | 2.0 | 1500 | $2,095 | $1.40 | 45d | 1 | 0.51mi |
| 7682 Woodmont Ave NW Albuquerque, NM | 2.0–4.0 | 2.0–2.5 | 1690 | $3,310 | $1.96 | 3d | 35 | 0.68mi |
| 6619 Binbrook Rd NW Albuquerque, NM | 3.0 | 2.0 | 1800 | $2,299 | $1.28 | 45d | 1 | 0.85mi |
| 6512 Los Pueblos Pl NW Albuquerque, NM | 3.0 | 2.5 | 1865 | $2,350 | $1.26 | 16d | 1 | 1.06mi |
| 6601 Tree Line Ave NW Albuquerque, NM | 2.0–3.0 | 2.5 | 1393 | $2,380 | $1.71 | 4d | 12 | 1.32mi |
| 10439 Calle Acanta NW Albuquerque, NM | 3.0 | 2.0 | 1600 | $2,100 | $1.31 | 25d | 1 | 1.47mi |
HOA detail
- Monthly dues
- $25 · $300/yr
Listing history 9 events
-
2026-05-26historical
-
2026-05-22$280,000
-
2018-10-01historical
-
2018-08-17status Pending
-
2018-08-08price $165,000
-
2018-07-05$170,000 Active
-
2018-06-05price $175,000
-
2018-03-27price $179,900
-
2007-11-28soldstatus
ⓘ Source: listings_history table (triggers on properties + properties_extension) + one-shot
backfill from property_details.listing_events for pre-trigger history.
Tax reassessment forecast NM · Resets to sale price
- Current annual tax
- $2,521 · $210/mo
- Projected year-2 tax
- $2,521 · $210/mo
- Expected delta
- $0/yr ($0/mo · 0.0%)
ⓘ Screening estimate from a state-policy table — verify with the county assessor before closing.
Climate risk First Street
- Flood 1/10 Low FEMA zone X (unshaded) · 0% chance over 30 yrs
- Wildfire 3/10 Moderate
- Heat 4/10 Moderate 6 d/yr ≥96°F today · 15 d/yr by 30 yrs out
- Wind 1/10 Low
- Air quality 3/10 Moderate 3 unhealthy d/yr today · 4 by 30 yrs out
Nearby sold comps map
Loading sold comps map…
Walkable amenities ~0.75 mi
Loading nearby amenities…
Taxation est. · year 1
- Rental income
- $26,671
- − Mortgage interest
- −$15,684
- − Property taxes
- −$2,521
- − Insurance
- −$1,400
- − Repairs & maintenance
- −$2,134
- − Management
- −$2,134
- − HOA
- −$300
- − Depreciation
- −$8,145
- Taxable loss
- −$5,647
- Est. tax savings @ 24.0%
- +$1,355
- After-tax cash flow
- $584/yr
For passive investors: Depreciation is non-cash, so a rental often shows a tax loss while cash-flowing — sheltering income. Rental losses are passive: they offset passive income freely, and up to $25,000/yr can offset ordinary (W-2) income if you actively participate and your MAGI is under $100k (phasing out to $0 by $150k); unused losses carry forward. On sale, claimed depreciation is recaptured at up to 25%, and gains may owe capital-gains tax (a 1031 exchange can defer both). Figures are a year-1 estimate at your 24.0% rate — not tax advice; consult a CPA.
Schools (NCES district)
- District
- Albuquerque Public Schools
- NCES district ID
- 3500060
- Math proficiency
- 51% ▲ 30.00%
- Reading proficiency
- 75% ▲ 45.00%
- Median HH income
- $48,151
- Composite
- 53.29/100
- National rank
- #1487
- State rank
- #3 of 29 in NM
Livability — Albuquerque
- Score
- 72/100
- State rank
- #13
- US rank
- #6219
Category grades
Schools grade is shown separately in the Schools card above.
Census & demographics
- Census place
- Albuquerque, NM
- County
- Bernalillo County · 647,165 people
- City population
- 647,165
- Metro
- Albuquerque, NM
- Population (ZIP)
- 70,117
- Household income
- $84,277
- Rent vs Own
- Severe rent burden
- 2293.0
Population outlook (Bernalillo County) Hauer SSP2
- Today (2025)
- 704,528 people
- By 2030
- 711,723 · +1.0%
- By 2040
- 714,522 · +1.4%
- By 2050
- 709,274 · +0.7%
- By 2075
- 680,015 · -3.5%
- By 2100
- 619,879 · -12.0%
Race, ethnicity, and origin ACS 2023
- Neighborhood character
- Diverse neighborhood (Simpson 0.63)
- Race & ethnicity
- Hispanic / Latino 46% White 40% Two or more races 21% Native American 4% Black 4% Asian 2%
- Hispanic origin (detail)
- Mexican 23% Puerto Rican 1%
- Common ancestry
- Lithuanian 3% Romanian 2% Italian 2%
- Foreign-born
- 6% · Canada, China
- Languages at home
- 83% English-only · Spanish 13% Other Indo-European 1%
Political lean MEDSL · Bernalillo
- 2024 margin
- Strong D (+21.0) · D 59.2% · R 38.2% · Other 2.6%
- 2008→2024 swing
- -0.3pp no change · 2008: 21.4pp · 2024: 21.0pp
- All cycles
- 2024: D+21.0 2020: D+24.4 2016: D+17.8 2012: D+16.2 2008: D+21.4
Not yet ingested
- Civics
- —
Market trends
- HPI YoY
- ▼ -227.99%
- Current HPI
- 232.3689
- Rent YoY
- ▼ -2.45%
- Metro
- Albuquerque, NM
- State GDP YoY
- —
- F500 in state
- 0
Price history
+55.6% since first listed9 events — show timeline
- 2026-05-26 Delisted — Southwest MLS
- 2026-05-22 Listed $280,000 Southwest MLS
- 2018-10-01 Delisted — Southwest MLS
- 2018-08-17 Pending — Southwest MLS
- 2018-08-08 Price Changed $165,000 Southwest MLS
- 2018-07-05 Listed $170,000 Southwest MLS
- 2018-06-05 Price Changed $175,000 Southwest MLS
- 2018-03-27 Price Changed $179,900 Southwest MLS
- 2007-11-28 Sold (Public Records) — Public Records
Property tax history
+4.1%/yrLatest (2025): $2,521 · +3.2% YoY. Source: county tax records.
Cash-flow waterfall
monthlySold comps — $/sqft
last 12 mo · ≤1 miLoading sold comps…