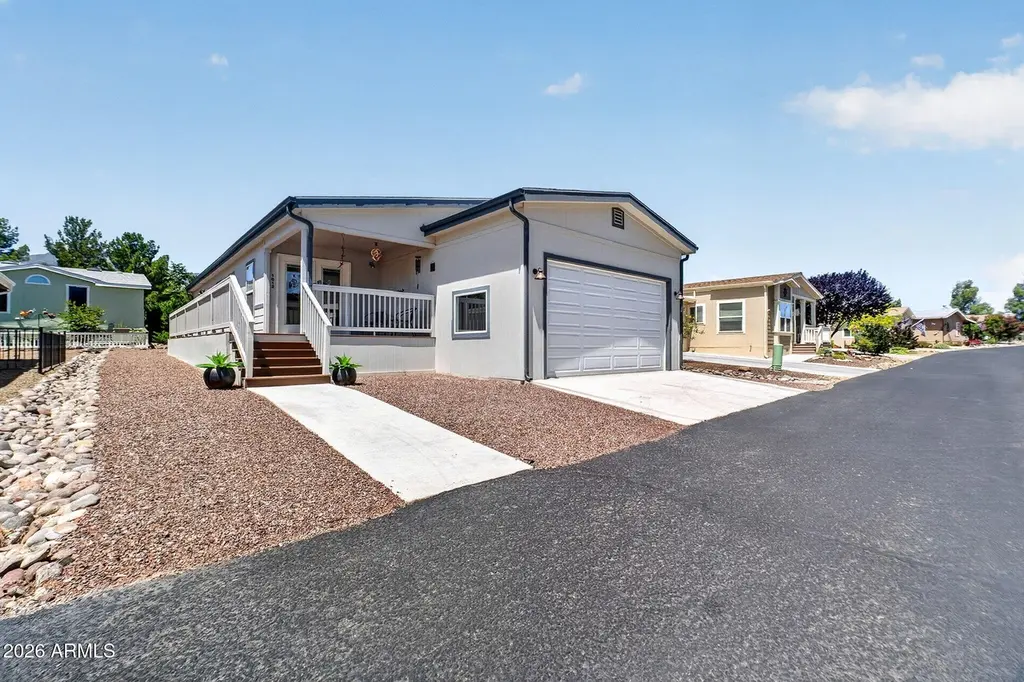
1012 Miller Dr · Cottonwood, AZ
Flood risk 1/10 · Minimal
- FEMA flood zone
- X (unshaded)
- Chance of flooding over 30 yrs
- 0.0%
- Est. flood insurance / yr
- $507 – $1,088
Fire risk 5/10 · Moderate
- Est. fire insurance / yr
- $610 – $1,132
Heat risk 6/10 · Moderate
- Hot days now (above 103°F)
- 8 days/yr
- Hot days in 30 yrs
- 20 days/yr
Wind risk 1/10 · Minimal
- Chance of severe wind over 30 yrs
- —
Air-quality risk 1/10 · Minimal
- Unhealthy air days now
- 0 days/yr
- Unhealthy air days in 30 yrs
- 0 days/yr
Risk factors via First Street. Map © Google.
Why this score? — see what drove the B grade
The composite is a weighted blend of 9 inputs, each scored 0–100. Each bar is that input's sub-score; the figure is the points it added to the 100-point composite (weight × sub-score).
- Cash flow +30.0/30.0
- ARV discount +11.3/15.0
- DSCR +10.0/10.0
- 1% rule +8.6/10.0
- Livability +4.0/5.0
- Condition / age +4.0/5.0
- Rent growth +2.4/5.0
- Schools +1.9/10.0
- Appreciation +0.0/10.0
$164,900
🖨 Deal sheet 📄 Offer letter ✓ Due diligence
Listing remarks
Nestled between Mingus Mountain and Sedona's iconic red rocks in the highly sought-after 5-star Active Adult community of On the Greens, this 1,440 sq ft home features 2 bedrooms, 2 baths, a versatile office/den, and an attached 2-car garage, providing ample parking, storage, and everyday convenience. Ideally located just a stone's throw from the clubhouse, you'll enjoy quick and easy access to the community's premier amenities and activities. Residents enjoy special rates at Coyote Trails Golf Course along with access to a clubhouse, fitness center, pool, spa, pickleball courts, game room, and more. Conveniently situated just 15 minutes from Jerome, 30 minutes from Sedona, 1 hour from Pres
Key facts
- 2 garage spots
- Community pool
- Built 2021
Property features AI
Finance
- Other: Lot size source: owner
- HOA & community: Land lease (annual: $703.46); No association fees included; Community amenities: pool, community spa, golf, pickleball, tennis courts, biking/walking path, fitness center
Exterior
- Parking: 2 covered parking spaces; 2 open parking spaces; 2-car garage with garage door opener
- Security: Gated community
- Utilities: Private water company; Public sewer
- Home design: Manufactured / Mobile home; Leasehold ownership
- Construction: Wood siding and vinyl siding; Wood frame construction; Composition roof
- Exterior features: Desert front and back yard; Private maintained road; Asphalt road access; Heated spa
Interior
- Kitchen: Kitchen island; Laminate counters; Pantry; Refrigerator; Dishwasher; Garbage disposal
- Bedrooms: 2 possible bedrooms
- Bathrooms: 2 full bathrooms
- Heating & cooling: Electric heating; Central air; Ceiling fans
- Interior features: Double vanity; Eat-in kitchen; Breakfast bar; Kitchen island; Pantry; Full bath in master bedroom; Laminate counters
- Laundry & utility: Laundry inside
Neighborhood map
What this means for you Summary
Snapshot
- This is a 2-bed/2.0-bath manufactured listed at $165k. Condition is rated good.
Deal economics
- At list price, monthly cash flow is $627 ($8k/yr) — positive.
- The deal already cash-flows at list — no discount required.
- Meets the 1% rule at list price ($2k rent vs $165k).
- Recommended offer: $162k (1.5% below list) — sets the bar for market timing.
- Cap rate 10.9% vs local median 3.8% in Cottonwood — top-decile yield for the area; either an underpriced asset or a hidden risk that comps aren't pricing in. Stress-test before assuming the spread holds.
Location & tenants
- Location reads 79/100 on livability (#7 in AZ, #2,176 nationally) — a middle-class / working-renter tenant base. Strengths: health & safety A+, commute A, cost of living A; Watch: employment D, amenities F.
- Cottonwood-Oak Creek Elementary District (4487) (town): math 17% / reading 28% proficiency, ranked #174 of 249 in AZ (top 70%) — low school quality limits family demand, transient renter base, plan for 1-2y turnover.
- Zoned schools: Oak Creek Elementary School (math 22% / reading 37%, grade F, #548 of 1,109 statewide, top 51%, 235 students, 63% FRL).
- Market conditions: Rents soft (-0.2%/yr); 266 active listings in the ZIP; 3 comparable units currently listed for rent nearby; rentals leasing fast (median 13d on market — plan ~1-2 weeks tenant-placement turnaround); 2,062 units permitted in Yavapai County in 2024 (98 in 5+ unit buildings).
- At $2,236/mo this rent would consume 47% of the median local household income ($57k/yr) (locally 894% of renters already pay >50% of income on rent) — very limited rent-growth headroom before tenants either downsize or default.
Forward outlook
- Local home prices are declining (-3.0%/yr); year-one equity from $1k of loan paydown is wiped out by about $5k of value loss. Plan a longer hold.
- Yavapai County population projected at +10% by 2050 — modest demand growth; plan on rents tracking national, not racing it.
Negotiation context
- It's been on market 15 days — a 2% lower offer ($162k) is reasonable based on typical stale-listing flexibility.
Risks & watch-outs
- Climate carrying-cost: moderate wildfire risk; extreme-heat days projected 8→20/yr by 2055 (HVAC capex compounding) — expect insurance premiums to compound above CPI over the hold.
Questions for the listing agent
- Is there a deadline driving the sale (1031 exchange, divorce, estate, relocation)? That informs how much negotiation room exists.
- What's the average days-on-market for RENTAL listings here right now (not sales)? A rising rental-DOM trend means longer vacancies and softer asking-rent achievability than the comps imply.
- What's the recent tenant-quality profile in this submarket — average credit score on applications, eviction rate, late-payment / NSF rate, and stable-employment percentage? A property-management company in the area should have these aggregated.
- How much new for-sale + rental construction is in the pipeline within 1–3 miles? Heavy new supply typically softens prices + rents 12–24 months out; constrained supply supports both.
Investment metrics
- 1% rule
- 1.36% ✓
- Cap rate
- 10.85%
- Cash-on-cash
- 16.29%
- DSCR
- 1.72
- GRM
- 6.1
CMA / ARV
- ARV (on-the-fly)
- $180,000
- Comps found
- 12
Show comp detail 12 sales within ~0.75 mi
| Address | Dist | Beds/Ba | Sqft | Sold | Price | $/sf | Match |
|---|---|---|---|---|---|---|---|
| 992 Trevino Dr | 0.15mi | 3/2.0 (+1) | 1,431 (-1%) | 3mo | $195,000 | $136 | 84 |
| 2050 W SR 89a -- #104 | 0.28mi | 2/2.0 | 1,456 (+1%) | 1mo | $118,000 | $81 | 84 |
| 1065 Crenshaw Ave | 0.21mi | 3/2.0 (+1) | 1,440 (0%) | 2mo | $180,000 | $125 | 84 |
| 972 Trevino Dr | 0.15mi | 3/2.0 (+1) | 1,382 (-4%) | 2mo | $179,900 | $130 | 80 |
| 1216 Hogan Dr | 0.12mi | 2/2.0 | 1,600 (+11%) | 1mo | $248,000 | $155 | 75 |
| 880 W On The Greens Blvd | 0.04mi | 3/2.0 (+1) | 1,620 (+12%) | 2mo | $249,900 | $154 | 71 |
| 1024 Rankin Ave | 0.12mi | 3/2.0 (+1) | 1,605 (+12%) | 2mo | $199,900 | $125 | 69 |
| 2050 W State Route 89a -- #158 | 0.28mi | 3/2.0 (+1) | 1,334 (-7%) | 5mo | $130,000 | $97 | 66 |
| 2050 W State Route 89a -- #86 | 0.49mi | 3/2.0 (+1) | 1,344 (-7%) | 2mo | $35,000 | $26 | 59 |
| 2050 W State Route 89-a -- #92 | 0.49mi | 3/2.0 (+1) | 1,344 (-7%) | 4mo | $145,000 | $108 | 58 |
| 2050 W SR 89-a -- #96 | 0.49mi | 3/2.0 (+1) | 1,568 (+9%) | 1mo | $155,000 | $99 | 56 |
| 2050 W State Route 89a -- #152 | 0.73mi | 2/2.0 | 1,344 (-7%) | 0mo | $205,000 | $153 | 55 |
Match score weights: distance 35% · size 25% · config 20% · recency 20%. Top-matched comps best support the ARV.
Projected returns pro-forma
-3.0% appreciation · 0.0% rent growth · sell at horizon
- IRR
- 3.9%
- Equity multiple
- 1.14×
- Total profit
- $6,678
- Equity at exit
- $24,587
- IRR
- 10.3%
- Equity multiple
- 1.69×
- Total profit
- $32,030
- Equity at exit
- $14,258
Cash invested: $46,172 (down + closing). Projections, not guarantees.
Landlord ↔ Tenant lean methodology
- Overall (STATE)
- 87 Strongly Landlord-Friendly
- State Arizona
- 87 Strongly Landlord-Friendly · R+3
- County
- — inherits STATE
- City
- — inherits STATE
ZIP-level market 86326
- Home prices YoY
- -32.2%
- Rents YoY
- -0.2%
- Active inventory
- 266
- Price-to-rent
- 6.1×
Monthly cashflow live
- Estimated rent
- $2,236 medium interval (Pro) →
- Mortgage (P&I)
- −$865
- Tax est. 1.5%
- −$206 /mo · $2,474/yr
- Insurance
- −$69
- HOA
- −$0
- Vacancy / Maint / Mgmt
- −$470
- Net cashflow
- $627
Break-even live
UW: 25.0% down · 7.5% · 30yr · 1.5% tax · 5.0% vac · 8.0% maint · 8.0% mgmt
Financing live
Cash to close
- Down payment
- $41,225
- Closing costs
- $4,947
- Reserves months
- —
- Total cash needed
- —
Loan-product check · same deal, 3 products live
Conventional
25% down · 7.5% · 30yr
- Down + closing
- —
- Monthly P&I
- —
- Monthly cashflow
- —
- DSCR
- —
- Eligible?
- —
Personal DTI + credit; lowest rate.
DSCR
20% down · 8.5% · 30yr
- Down + closing
- —
- Monthly P&I
- —
- Monthly cashflow
- —
- DSCR
- —
- Eligible?
- —
No personal income docs; deal must DSCR.
Hard money
10% down · 12.0% · 12mo
- Down + closing
- —
- Monthly P&I
- —
- Monthly cashflow
- —
- DSCR
- —
- Eligible?
- —
Short-term bridge; refi at stabilization.
Rent comps 3 comps
| Address | Beds | Baths | Sqft | Rent | $/sqft | DOM | Units | Dist |
|---|---|---|---|---|---|---|---|---|
| 992 Sterling Ln Cottonwood, AZ | 3.0 | 2.0 | 1652 | $2,395 | $1.45 | 20d | 1 | 0.32mi |
| 255 S Cottonwood Ranch Rd Cottonwood, AZ | 3.0 | 2.0 | 1695 | $2,195 | $1.29 | 13d | 1 | 1.11mi |
| 1910 W Trail Blazer Dr Cottonwood, AZ | 2.0 | 2.0 | 1278 | $2,900 | $2.27 | 13d | 1 | 1.12mi |
Listing history 12 events
-
2026-06-18days on market $164,900 Active 15 DOM
-
2026-06-17days on market $164,900 Active 14 DOM
-
2026-06-16days on market $164,900 Active 13 DOM
-
2026-06-15days on market $164,900 Active 12 DOM
-
2026-06-14days on market $164,900 Active 10 DOM
-
2026-06-13days on market $164,900 Active 9 DOM
-
2026-06-10days on market $164,900 Active 7 DOM
-
2026-06-09days on market $164,900 Active 6 DOM
-
2026-06-08days on market $164,900 Active 5 DOM
-
2026-06-07days on market $164,900 Active 4 DOM
-
2026-06-03remarks 699-char remark
-
2026-06-03$164,900 Active 1 DOM
ⓘ Source: listings_history table (triggers on properties + properties_extension) + one-shot
backfill from property_details.listing_events for pre-trigger history.
Climate risk First Street
- Flood 1/10 Low FEMA zone X (unshaded) · 0% chance over 30 yrs
- Wildfire 5/10 Major
- Heat 6/10 Major 8 d/yr ≥103°F today · 20 d/yr by 30 yrs out
- Wind 1/10 Low
- Air quality 1/10 Low 0 unhealthy d/yr today · 0 by 30 yrs out
Nearby sold comps map
Loading sold comps map…
Walkable amenities ~0.75 mi
Loading nearby amenities…
Taxation est. · year 1
- Rental income
- $26,830
- − Mortgage interest
- −$9,237
- − Property taxes
- −$2,474
- − Insurance
- −$824
- − Repairs & maintenance
- −$2,146
- − Management
- −$2,146
- − Depreciation
- −$4,797
- Taxable income
- $5,205
- Est. tax owed @ 24.0%
- −$1,249
- After-tax cash flow
- $6,272/yr
For passive investors: Depreciation is non-cash, so a rental often shows a tax loss while cash-flowing — sheltering income. Rental losses are passive: they offset passive income freely, and up to $25,000/yr can offset ordinary (W-2) income if you actively participate and your MAGI is under $100k (phasing out to $0 by $150k); unused losses carry forward. On sale, claimed depreciation is recaptured at up to 25%, and gains may owe capital-gains tax (a 1031 exchange can defer both). Figures are a year-1 estimate at your 24.0% rate — not tax advice; consult a CPA.
Condition & rehab AI · 13 photos
This home is in good condition with modern updates and a good location. It is ready for a new owner to move in.
Value-add opportunities
- Both Paint exterior — Enhances curb appeal and value
- Both Replace carpet with hardwood — Improves aesthetics and is easier to maintain
- Both Install smart home devices — Enhances convenience and marketability
Renovation cost estimate screening
Value-add ROI direction
- Both Paint exterior — Enhances curb appeal and value ↑
- Both Replace carpet with hardwood — Improves aesthetics and is easier to maintain ↑
- Both Install smart home devices — Enhances convenience and marketability ↑
ⓘ Cost ranges are severity-bucket heuristics (US national rule-of-thumb). Get contractor quotes + a written scope before underwriting a rehab budget.
Schools (NCES district)
- District
- Cottonwood-Oak Creek Elementary District (4487)
- NCES district ID
- 0402370
- Math proficiency
- 17% ▼ -10.00%
- Reading proficiency
- 28% ▼ -7.00%
- Median HH income
- $41,740
- Composite
- 19.16/100
- National rank
- #8822
- State rank
- #174 of 249 in AZ
Livability — Cottonwood
- Score
- 79/100
- State rank
- #7
- US rank
- #2176
Category grades
Schools grade is shown separately in the Schools card above.
Census & demographics
- Census place
- Cottonwood, AZ
- County
- Yavapai County · 190,406 people
- City population
- 24,852
- Metro
- Prescott Valley-Prescott, AZ
- Population (ZIP)
- 24,852
- Household income
- $57,378
- Rent vs Own
- Severe rent burden
- 894.0
Population outlook (Yavapai County) Hauer SSP2
- Today (2025)
- 241,389 people
- By 2030
- 249,523 · +3.4%
- By 2040
- 259,966 · +7.7%
- By 2050
- 264,736 · +9.7%
- By 2075
- 269,334 · +11.6%
- By 2100
- 256,505 · +6.3%
Race, ethnicity, and origin ACS 2023
- Neighborhood character
- Predominantly White (73%)
- Race & ethnicity
- White 73% Hispanic / Latino 20% Two or more races 14% Native American 1%
- Hispanic origin (detail)
- Mexican 17%
- Common ancestry
- Italian 3% Romanian 3% Lithuanian 2%
- Foreign-born
- 12% · Canada
- Languages at home
- 84% English-only · Spanish 14% German/W. Germanic 1%
Political lean MEDSL · Yavapai
- 2024 margin
- Solid R (+33.9) · D 32.6% · R 66.5%
- 2008→2024 swing
- -9.5pp toward R · 2008: -24.4pp · 2024: -33.9pp
- All cycles
- 2024: R+33.9 2020: R+29.3 2016: R+31.4 2012: R+30.7 2008: R+24.4
Not yet ingested
- Civics
- —
Market trends
- HPI YoY
- ▼ -165.27%
- Current HPI
- 347.5058
- Rent YoY
- ▼ -0.22%
- Metro
- Prescott Valley-Prescott, AZ
- State GDP YoY
- ▲ 4.54%
- F500 in state
- 20
Industry mix (Fortune 500 HQ in AZ)
| Industry | F500 HQs | Revenue |
|---|---|---|
| Technology | 2 | $13B |
|
||
| Mining / Metals | 1 | $23B |
|
||
| Environmental Services | 1 | $16B |
|
||
| Metals / Steel | 1 | $14B |
|
||
| Technology Distribution | 1 | $9B |
|
||
| Homebuilding | 1 | $8B |
|
||
Price history
1 event — show timeline
- 2026-06-03 Listed $164,900 ARMLS
Cash-flow waterfall
monthlySold comps — $/sqft
last 12 mo · ≤1 miLoading sold comps…