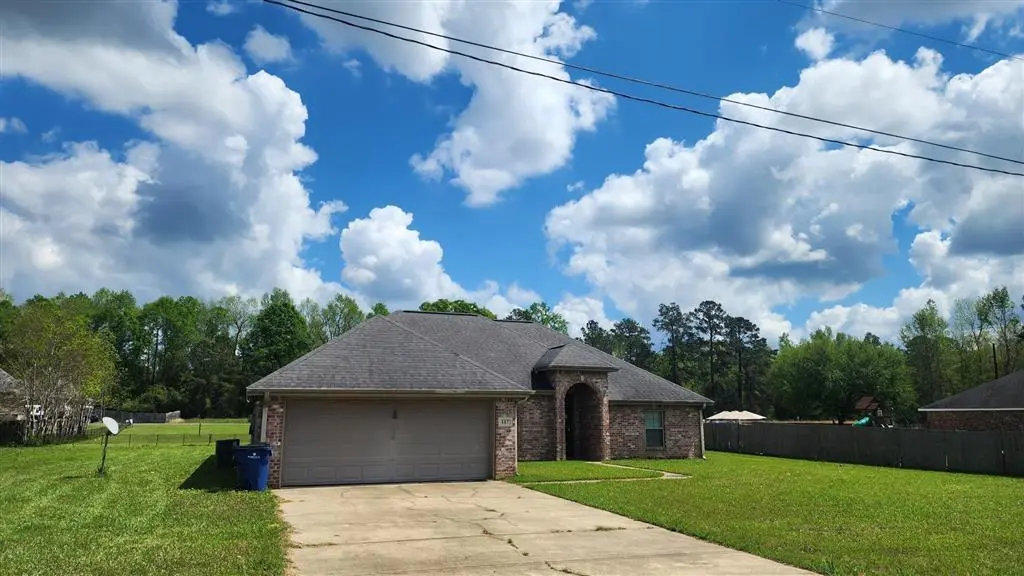
117 W Tyler Ln W · Rosepine, LA
Flood risk 1/10 · Minimal
- FEMA flood zone
- A
- Chance of flooding over 30 yrs
- 0.0%
- Est. flood insurance / yr
- $1,009 – $1,996
Fire risk 5/10 · Moderate
- Est. fire insurance / yr
- $1,269 – $2,357
Heat risk 8/10 · Major
- Hot days now (above 110°F)
- 7 days/yr
- Hot days in 30 yrs
- 21 days/yr
Wind risk 8/10 · Major
- Chance of severe wind over 30 yrs
- 99.0%
Air-quality risk 2/10 · Minimal
- Unhealthy air days now
- 1 days/yr
- Unhealthy air days in 30 yrs
- 1 days/yr
Risk factors via First Street. Map © Google.
Why this score? — see what drove the D+ grade
The composite is a weighted blend of 9 inputs, each scored 0–100. Each bar is that input's sub-score; the figure is the points it added to the 100-point composite (weight × sub-score).
- ARV discount +13.8/15.0
- Cash flow +11.1/30.0
- Rent growth +4.9/5.0
- Schools +3.6/10.0
- DSCR +3.2/10.0
- Livability +3.2/5.0
- 1% rule +3.0/10.0
- Condition / age +2.5/5.0
- Appreciation +0.0/10.0
$241,000
🖨 Deal sheet (PDF) 📄 Offer letter ✓ Due diligence
Listing remarks MLS
This charming brick home features a 4-bedroom, 2-bath layout on nearly half an acre in Rosepine. Don’t miss the chance to see it—schedule your showing today!
Key facts
- 0.46 acre lot
- 2 garage spots
- Built 2011
Neighborhood map
What this means for you Summary
Snapshot
- This is a 4-bed/2.0-bath single-family listed at $241k.
Deal economics
- At list price, monthly cash flow is $-224 ($-3k/yr) — negative.
- To cash-flow at today's rent, offer at most $201k (16.4% below list).
- To meet the 1% rule (rent ≥ 1% of price), the offer needs to be $192k (20.5% below list).
- Recommended offer: $192k (20.5% below list) — sets the bar for 1% rule.
Location & tenants
- Location reads 64/100 on livability (#180 in LA) — a middle-class / working-renter tenant base. Strengths: cost of living A+, housing A+, crime A-; Watch: amenities F, commute F, employment D-.
- Vernon Parish (rural): math 35% / reading 51% proficiency, ranked #18 of 98 in LA (top 18%) — families likely to look elsewhere, expect single-tenant / working-renter base with shorter leases.
- Zoned schools: Rosepine Elementary School (math 25% / reading 50%, grade F, #247 of 646 statewide, top 39%, 830 students, 55% FRL); Vernon Middle School (math 30% / reading 41%, grade F, #91 of 218 statewide, top 42%, 477 students, 60% FRL); Leesville High School (math 32% / reading 54%, grade F, #66 of 265 statewide, top 25%, 884 students, 47% FRL).
- Market conditions: Rents rising fast (+9.6%/yr); 210 active listings in the ZIP; 2 comparable units currently listed for rent nearby; 26 units permitted in Vernon Parish in 2024 (0 in 5+ unit buildings).
- This rent runs 41% of the median local income ($56k/yr) — at the standard rent-burdened threshold; future hikes will face affordability resistance.
Forward outlook
- Local home prices are declining (-3.0%/yr); year-one equity from $2k of loan paydown is wiped out by about $7k of value loss. Plan a longer hold.
- Vernon County population projected at -25% by 2050 — secular population decline; favor cash flow + early exit over multi-decade hold.
Negotiation context
- It's been on market 74 days — a 6% lower offer ($227k) is reasonable based on typical stale-listing flexibility.
- 2 sale attempts since 2y ago; this cycle's ask has dropped $25k (9%) from the opening price — seller is motivated, your offer sets the floor, not the list.
Risks & watch-outs
- Watch-outs: flood insurance adds $125/mo.
- Climate carrying-cost: in FEMA flood zone A (mandatory federal flood insurance); severe wind risk, 99% chance of damaging wind over 30y; moderate wildfire risk; extreme-heat days projected 7→21/yr by 2055 (HVAC capex compounding) — expect insurance premiums to compound above CPI over the hold.
Questions for the listing agent
- What do current leases actually rent for vs. the listed asking? Can we see a recent rent roll and the last 12 months of T-12 income?
- It's been on market 74 days. Have you received any prior offers? Is the seller open to a 20% concession, seller financing, or rate buy-down credit?
- What's the actual annual flood-insurance premium (NFIP or private), and is the property in a SFHA with mandatory coverage?
- Why hasn't it sold? Are there any deal-killer items the seller is aware of (foundation, flood, title, zoning, code violations)?
- Is there a deadline driving the sale (1031 exchange, divorce, estate, relocation)? That informs how much negotiation room exists.
- Schools are A-rated — typically a magnet for longer-tenancy family renters. What's the average tenant stay here, and is there a school-zone premium baked into asking?
- The area grade is low — what's the realistic commute time and amenity access for the typical tenant pool here? Any planned neighborhood developments (good or bad) we should know about?
- What's the average days-on-market for RENTAL listings here right now (not sales)? A rising rental-DOM trend means longer vacancies and softer asking-rent achievability than the comps imply.
- What's the recent tenant-quality profile in this submarket — average credit score on applications, eviction rate, late-payment / NSF rate, and stable-employment percentage? A property-management company in the area should have these aggregated.
- How much new for-sale + rental construction is in the pipeline within 1–3 miles? Heavy new supply typically softens prices + rents 12–24 months out; constrained supply supports both.
Investment metrics
- 1% rule
- 0.80% ✗
- Cap rate
- 5.80%
- Cash-on-cash
- -1.76%
- DSCR
- 0.92
- GRM
- 10.5
CMA / ARV
- ARV (median comp)
- $279,915
- List price
- $241,000
- Delta
- -13.90%
- Verdict
- UNDERPRICED
- Comps
- 20 within 1.0 mi
Show comp detail 9 sales within ~0.75 mi
| Address | Dist | Beds/Ba | Sqft | Sold | Price | $/sf | Match |
|---|---|---|---|---|---|---|---|
| 510 Woodland Pkwy | 0.10mi | 4/2.0 | 2,012 (+3%) | 4mo | $285,000 | $142 | 86 |
| 115 W Tyler Lane (rosepine) | 0.03mi | 4/2.0 | 1,969 (+1%) | 23mo | $270,000 | $137 | 78 |
| 106 W Tyler Ln | 0.15mi | 3/2.0 (-1) | 1,911 (-2%) | 21mo | $275,000 | $144 | 68 |
| 504 Woodland Pkwy | 0.18mi | 3/2.0 (-1) | 1,713 (-12%) | 4mo | $260,000 | $152 | 63 |
| 247 Joyce | 0.19mi | 3/2.0 (-1) | 1,785 (-8%) | 12mo | $135,000 | $76 | 62 |
| 513 Woodland Pkwy | 0.08mi | 4/2.0 | 2,178 (+12%) | 21mo | $289,000 | $133 | 59 |
| 245 Ambler Rd | 0.64mi | 3/2.0 (-1) | 2,175 (+12%) | 1mo | $235,000 | $108 | 45 |
| 203 Sugar Ln | 0.56mi | 3/2.0 (-1) | 1,799 (-8%) | 19mo | $243,000 | $135 | 40 |
| 104 Sugar Ln | 0.69mi | 3/2.0 (-1) | 1,799 (-8%) | 24mo | $269,900 | $150 | 30 |
Match score weights: distance 35% · size 25% · config 20% · recency 20%. Top-matched comps best support the ARV.
Projected returns pro-forma
-3.0% appreciation · 8.0% rent growth · sell at horizon
- IRR
- -17.3%
- Equity multiple
- 0.36×
- Total profit
- $-43,115
- Equity at exit
- $35,934
- IRR
- -1.7%
- Equity multiple
- 0.86×
- Total profit
- $-9,525
- Equity at exit
- $20,837
Cash invested: $67,480 (down + closing). Projections, not guarantees.
Landlord ↔ Tenant lean methodology
- Overall (STATE)
- 90 Strongly Landlord-Friendly
- State Louisiana
- 90 Strongly Landlord-Friendly · R+12
- County
- — inherits STATE
- City
- — inherits STATE
ZIP-level market 71446
- Home prices YoY
- -32.1%
- Rents YoY
- 9.6%
- Active inventory
- 210
- Price-to-rent
- 10.5×
Monthly cashflow live
- Estimated rent
- $1,916 medium interval (Pro) →
- Mortgage (P&I)
- −$1,264
- Tax from tax record
- −$248 /mo · $2,977/yr
- Insurance
- −$100
- Flood insurance flood zone
- −$125 /mo · $1,502/yr
- HOA
- −$0
- Vacancy / Maint / Mgmt
- −$402
- Net cashflow
- $-224
Break-even live
Sensitivity live
| Price | -10% $-87 | -5% $-156 | +0% $-224 | +5% $-292 | +10% $-360 |
|---|---|---|---|---|---|
| Rent | -10% $-375 | -5% $-300 | +0% $-224 | +5% $-148 | +10% $-73 |
| Rate | -1.0pp $-103 | -0.5pp $-163 | base $-224 | +0.5pp $-286 | +1.0pp $-350 |
UW: 25.0% down · 7.5% · 30yr · 1.5% tax · 5.0% vac · 8.0% maint · 8.0% mgmt
Financing live
Cash to close
- Down payment
- $60,250
- Closing costs
- $7,230
- Reserves months
- —
- Total cash needed
- —
Loan-product check · same deal, 3 products live
Conventional
25% down · 7.5% · 30yr
- Down + closing
- —
- Monthly P&I
- —
- Monthly cashflow
- —
- DSCR
- —
- Eligible?
- —
Personal DTI + credit; lowest rate.
DSCR
20% down · 8.5% · 30yr
- Down + closing
- —
- Monthly P&I
- —
- Monthly cashflow
- —
- DSCR
- —
- Eligible?
- —
No personal income docs; deal must DSCR.
Hard money
10% down · 12.0% · 12mo
- Down + closing
- —
- Monthly P&I
- —
- Monthly cashflow
- —
- DSCR
- —
- Eligible?
- —
Short-term bridge; refi at stabilization.
Rent comps 2 comps
| Address | Beds | Baths | Sqft | Rent | $/sqft | DOM | Units | Dist |
|---|---|---|---|---|---|---|---|---|
| 1742 Byron Dr Deridder, LA | 3.0 | 2.0 | 1500 | $1,400 | $0.93 | 45d | 1 | 0.95mi |
| 1595 Louisiana Ave Deridder, LA | 4.0 | 2.0 | 1997 | $1,795 | $0.90 | 45d | 1 | 0.96mi |
Listing history 21 events
-
2026-06-19days on market $241,000 Active 74 DOM
-
2026-06-18days on market $241,000 Active 73 DOM
-
2026-06-17days on market $241,000 Active 72 DOM
-
2026-06-16days on market $241,000 Active 71 DOM
-
2026-06-15days on market $241,000 Active 70 DOM
-
2026-06-14days on market $241,000 Active 68 DOM
-
2026-06-12days on market $241,000 Active 67 DOM
-
2026-06-09pricedays on market $241,000 Active 64 DOM
-
2026-06-08days on market $253,000 Active 63 DOM
-
2026-06-07days on market $253,000 Active 62 DOM
-
2026-06-07days on market $253,000 Active 61 DOM
-
2026-06-04days on market $253,000 Active 58 DOM
-
2026-06-02days on market $253,000 Active 57 DOM
-
2026-06-01days on market $253,000 Active 56 DOM
-
2026-05-31days on market $253,000 Active 55 DOM
-
2026-05-31days on market $253,000 Active 54 DOM
-
2026-05-11price $253,000 169-char remark
Show marketing remark (169 chars)
This charming brick home features a 4-bedroom, 2-bath layout on nearly half an acre in Rosepine. Don’t miss the chance to see it—schedule your showing today!
-
2026-04-06$266,000 Active 169-char remark
Show marketing remark (169 chars)
This charming brick home features a 4-bedroom, 2-bath layout on nearly half an acre in Rosepine. Don’t miss the chance to see it—schedule your showing today!
-
2024-07-10$295,000 Active
-
2021-09-30soldstatus $255,000
-
2009-08-14soldstatus $200,000
ⓘ Source: listings_history table (triggers on properties + properties_extension) + one-shot
backfill from property_details.listing_events for pre-trigger history.
Tax reassessment forecast LA · Resets to sale price
- Current annual tax
- $2,977 · $248/mo
- Projected year-2 tax
- $2,977 · $248/mo
- Expected delta
- $0/yr ($0/mo · 0.0%)
ⓘ Screening estimate from a state-policy table — verify with the county assessor before closing.
Climate risk First Street
- Flood 1/10 Low FEMA zone A · 0% chance over 30 yrs
- Wildfire 5/10 Major
- Heat 8/10 Severe 7 d/yr ≥110°F today · 21 d/yr by 30 yrs out
- Wind 8/10 Severe 99% chance of damaging wind over 30 yrs
- Air quality 2/10 Low 1 unhealthy d/yr today · 1 by 30 yrs out
Nearby sold comps map
Loading sold comps map…
Walkable amenities ~0.75 mi
Loading nearby amenities…
Taxation est. · year 1
- Rental income
- $22,992
- − Mortgage interest
- −$13,500
- − Property taxes
- −$2,977
- − Insurance
- −$2,708
- − Repairs & maintenance
- −$1,839
- − Management
- −$1,839
- − Depreciation
- −$7,011
- Taxable loss
- −$6,882
- Est. tax savings @ 24.0%
- +$1,652
- After-tax cash flow
- $-1,035/yr
For passive investors: Depreciation is non-cash, so a rental often shows a tax loss while cash-flowing — sheltering income. Rental losses are passive: they offset passive income freely, and up to $25,000/yr can offset ordinary (W-2) income if you actively participate and your MAGI is under $100k (phasing out to $0 by $150k); unused losses carry forward. On sale, claimed depreciation is recaptured at up to 25%, and gains may owe capital-gains tax (a 1031 exchange can defer both). Figures are a year-1 estimate at your 24.0% rate — not tax advice; consult a CPA.
Schools (NCES district)
- District
- Vernon Parish
- NCES district ID
- 2201830
- Math proficiency
- 35% ▼ -42.00%
- Reading proficiency
- 51% ▼ -32.00%
- Median HH income
- $44,822
- Composite
- 36.42/100
- National rank
- #4674
- State rank
- #18 of 98 in LA
Livability — Rosepine
- Score
- 64/100
- State rank
- #180
- US rank
- #14736
Category grades
Schools grade is shown separately in the Schools card above.
Census & demographics
- Census place
- Rosepine, LA
- County
- Vernon Parish · 21,275 people
- City population
- 1,543
- Metro
- Fort Polk South, LA
- Population (ZIP)
- 21,275
- Household income
- $55,925
- Rent vs Own
- Severe rent burden
- 659.0
Population outlook (Vernon County) Hauer SSP2
- Today (2025)
- 45,401 people
- By 2030
- 43,015 · -5.3%
- By 2040
- 38,171 · -15.9%
- By 2050
- 34,087 · -24.9%
- By 2075
- 28,267 · -37.7%
- By 2100
- 25,486 · -43.9%
Race, ethnicity, and origin ACS 2023
- Neighborhood character
- Predominantly White (72%)
- Race & ethnicity
- White 72% Black 16% Hispanic / Latino 6% Two or more races 5% Asian 2% Native American 1%
- Hispanic origin (detail)
- Mexican 3% Puerto Rican 1%
- Common ancestry
- Lithuanian 3% Slovak 1% Romanian 1%
- Foreign-born
- 3% · Canada, South Korea, Vietnam
- Languages at home
- 94% English-only · Spanish 3% French/Haitian/Cajun 1%
Political lean MEDSL · Vernon
- 2024 margin
- Solid R (+67.9) · D 15.6% · R 83.4% · Other 1.0%
- 2008→2024 swing
- -14.5pp toward R · 2008: -53.4pp · 2024: -67.9pp
- All cycles
- 2024: R+67.9 2020: R+64.9 2016: R+65.0 2012: R+57.5 2008: R+53.4
Not yet ingested
- Civics
- —
Market trends
- HPI YoY
- ▼ -61.06%
- Current HPI
- 128.8849
- Rent YoY
- ▲ 9.60%
- Metro
- Fort Polk South, LA
- State GDP YoY
- ▲ 3.29%
- F500 in state
- 10
Industry mix (Fortune 500 HQ in LA)
| Industry | F500 HQs | Revenue |
|---|---|---|
| Telecommunications | 2 | $23B |
|
||
| Utilities | 1 | $12B |
|
||
| Wholesale / Distribution | 1 | $5B |
|
||
| Advertising | 1 | $2B |
|
||
Price history
+26.5% since first listed5 events — show timeline
- 2026-05-11 Price Changed $253,000 SWLAR
- 2026-04-06 Listed $266,000 SWLAR
- 2024-07-10 Listed $295,000 GFPAR
- 2021-09-30 Sold (Public Records) $255,000 Public Records
- 2009-08-14 Sold (Public Records) $200,000 Public Records
Property tax history
+2.0%/yrLatest (2025): $2,977 · +0.4% YoY. Source: county tax records.
Cash-flow waterfall
monthlySold comps — $/sqft
last 12 mo · ≤1 miLoading sold comps…