12776 SE 110th Ct · Happy Valley, OR
Flood risk 1/10 · Minimal
- FEMA flood zone
- X (unshaded)
- Chance of flooding over 30 yrs
- 0.0%
- Est. flood insurance / yr
- $507 – $1,088
Fire risk 1/10 · Minimal
- Est. fire insurance / yr
- $498 – $926
Heat risk 3/10 · Minor
- Hot days now (above 93°F)
- 7 days/yr
- Hot days in 30 yrs
- 14 days/yr
Wind risk 1/10 · Minimal
- Chance of severe wind over 30 yrs
- —
Air-quality risk 10/10 · Severe
- Unhealthy air days now
- 18 days/yr
- Unhealthy air days in 30 yrs
- 20 days/yr
Risk factors via First Street. Map © Google.
Why this score? — see what drove the D grade
The composite is a weighted blend of 9 inputs, each scored 0–100. Each bar is that input's sub-score; the figure is the points it added to the 100-point composite (weight × sub-score).
- ARV discount +15.0/15.0
- Cash flow +7.9/30.0
- 1% rule +4.6/10.0
- Livability +3.8/5.0
- Schools +3.2/10.0
- Rent growth +3.1/5.0
- Condition / age +2.5/5.0
- DSCR +2.0/10.0
- Appreciation +0.0/10.0
$178,000
🖨 Deal sheet (PDF) 📄 Offer letter ✓ Due diligence
Listing remarks MLS
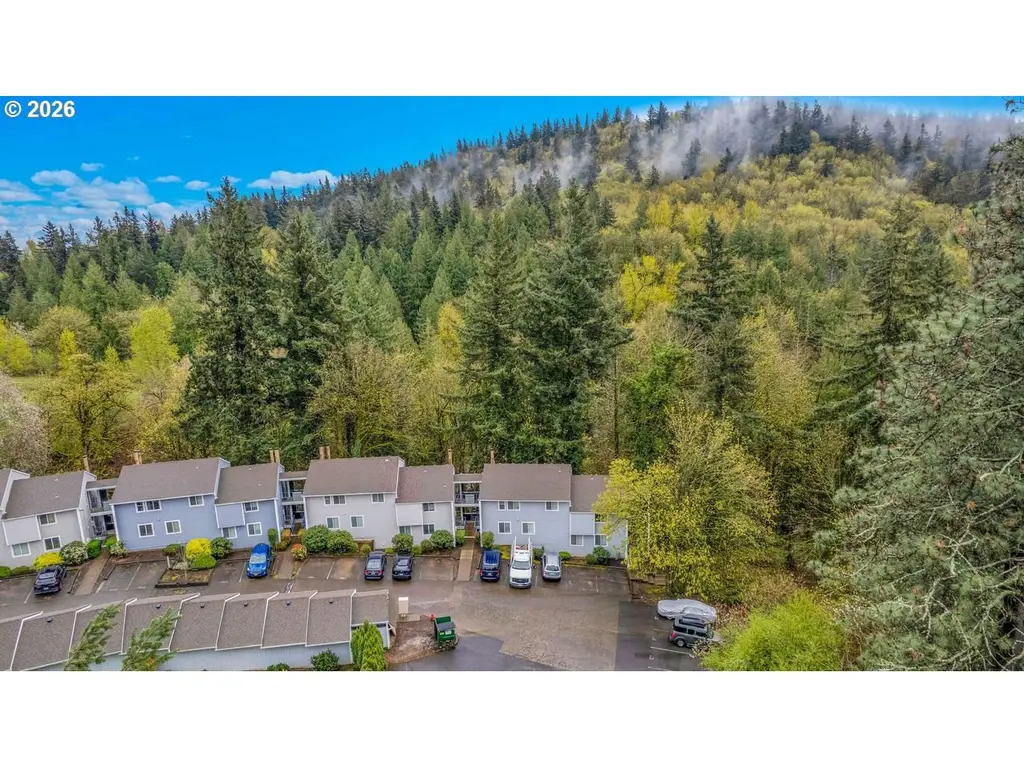
Beautifully located end-unit condo in one of the most private and quiet settings in the community, backing to Mt. Talbert and Mt. Scott Creek. Just 1.3 miles to Clackamas Town Center, MAX Station, and Costco with easy access to freeways, hospital, and shopping. Features include two bedrooms, cozy wood burning fireplace, and green space views. Unique to this unit is a front patio area, plus a deck for outdoor living. No rental cap. Excellent value in a prime location, and access to walking trails from your front door. HOA covers pool, sewer, trash, water, basketball court, and exterior maintenance. Washer, dryer, fridge, and all appliances are included.
Key facts
- Hoa covers pool
- Front patio area
- $439 HOA
Tags
Neighborhood map
What this means for you Summary
Snapshot
- This is a 2-bed/1.0-bath condo listed at $178k.
Deal economics
- At list price, monthly cash flow is $-190 ($-2k/yr) — negative.
- To cash-flow at today's rent, offer at most $144k (18.9% below list).
- To meet the 1% rule (rent ≥ 1% of price), the offer needs to be $171k (3.9% below list).
- Recommended offer: $144k (18.9% below list) — sets the bar for cash-flow.
- Cap rate 5.0% vs local median 2.5% in Happy Valley — top-decile yield for the area; either an underpriced asset or a hidden risk that comps aren't pricing in. Stress-test before assuming the spread holds.
Location & tenants
- Location reads 76/100 on livability (#76 in OR, #3,386 nationally) — a middle-class / working-renter tenant base. Strengths: employment A+, housing A+, crime A; Watch: amenities F, cost of living F.
- North Clackamas SD 12 (suburban): math 29% / reading 43% proficiency, ranked #22 of 58 in OR (top 38%) — families likely to look elsewhere, expect single-tenant / working-renter base with shorter leases.
- Zoned schools: Milwaukie El Puente Elementary School (math 34% / reading 15%, grade F, #309 of 412 statewide, top 77%, 418 students, 0% FRL); Happy Valley Middle School (math 41% / reading 56%, grade C-, #29 of 128 statewide, top 22%, 1,021 students, 25% FRL); Clackamas High School (math 52% / reading 67%, grade C+, #23 of 143 statewide, top 19%, 1,224 students, 27% FRL) — zoned schools average 17% FRL vs 34% district-wide (17 pts lower); this property's tenant base skews higher-income than the district average.
- Market conditions: Rents rising (+2.5%/yr); 124 active listings in the ZIP; 12 comparable units currently listed for rent nearby; rentals leasing fast (median 1d on market — plan ~1-2 weeks tenant-placement turnaround); solid renter incomes; 946 units permitted in Clackamas County in 2024 (188 in 5+ unit buildings).
Forward outlook
- Local home prices are declining (-3.0%/yr); year-one equity from $1k of loan paydown is wiped out by about $5k of value loss. Plan a longer hold.
- Clackamas County population projected at +25% by 2050 — long-run rental-demand tailwind backs the buy-and-hold thesis.
Negotiation context
- It's been on market 80 days — a 6% lower offer ($167k) is reasonable based on typical stale-listing flexibility.
- 7 sale attempts since 23y ago; this cycle's ask has dropped $42k (19%) from the opening price — seller is motivated, your offer sets the floor, not the list.
Risks & watch-outs
- Watch-outs: HOA is 26% of rent.
Questions for the listing agent
- What do current leases actually rent for vs. the listed asking? Can we see a recent rent roll and the last 12 months of T-12 income?
- It's been on market 80 days. Have you received any prior offers? Is the seller open to a 19% concession, seller financing, or rate buy-down credit?
- What does the HOA fee cover, when was the last increase, and are there any pending special assessments or reserve-fund shortfalls?
- Any open or pending special assessments — roof, HVAC, plumbing, elevator, façade? What's the per-unit balance and payoff schedule, and is the seller paying it off at close or rolling it to the buyer?
- Why hasn't it sold? Are there any deal-killer items the seller is aware of (foundation, flood, title, zoning, code violations)?
- Is there a deadline driving the sale (1031 exchange, divorce, estate, relocation)? That informs how much negotiation room exists.
- Schools are A-rated — typically a magnet for longer-tenancy family renters. What's the average tenant stay here, and is there a school-zone premium baked into asking?
- The area grade is low — what's the realistic commute time and amenity access for the typical tenant pool here? Any planned neighborhood developments (good or bad) we should know about?
- What's the average days-on-market for RENTAL listings here right now (not sales)? A rising rental-DOM trend means longer vacancies and softer asking-rent achievability than the comps imply.
- What's the recent tenant-quality profile in this submarket — average credit score on applications, eviction rate, late-payment / NSF rate, and stable-employment percentage? A property-management company in the area should have these aggregated.
- How much new apartment / multifamily construction is in the pipeline within 1–3 miles? Heavy new supply (>2% of stock underway) typically softens rents 12–24 months out; light construction supports rent growth.
Investment metrics
- 1% rule
- 0.96% ✗
- Cap rate
- 5.01%
- Cash-on-cash
- -4.58%
- DSCR
- 0.80
- GRM
- 8.7
CMA / ARV
- ARV (median comp)
- $214,020
- List price
- $178,000
- Delta
- -16.83%
- Verdict
- UNDERPRICED
- Comps
- 20 within 1.0 mi
Projected returns pro-forma
-3.0% appreciation · 2.48% rent growth · sell at horizon
- IRR
- -24.6%
- Equity multiple
- 0.16×
- Total profit
- $-41,621
- Equity at exit
- $26,540
- IRR
- -21.8%
- Equity multiple
- -0.09×
- Total profit
- $-54,562
- Equity at exit
- $15,390
Cash invested: $49,840 (down + closing). Projections, not guarantees.
Landlord ↔ Tenant lean methodology
- Overall (STATE)
- 28 Tenant-Leaning
- State Oregon
- 28 Tenant-Leaning · D+6
- County
- — inherits STATE
- City
- — inherits STATE
ZIP-level market 97015
- Rents YoY
- 2.5%
- Active inventory
- 124
- Price-to-rent
- 8.7×
Monthly cashflow live
- Estimated rent
- $1,711 high interval (Pro) →
- Mortgage (P&I)
- −$933
- Tax from tax record
- −$95 /mo · $1,145/yr
- Insurance
- −$74
- HOA
- −$439
- Vacancy / Maint / Mgmt
- −$359
- Net cashflow
- $-190
Break-even live
Sensitivity live
| Price | -10% $-89 | -5% $-140 | +0% $-190 | +5% $-240 | +10% $-291 |
|---|---|---|---|---|---|
| Rent | -10% $-325 | -5% $-258 | +0% $-190 | +5% $-122 | +10% $-55 |
| Rate | -1.0pp $-100 | -0.5pp $-145 | base $-190 | +0.5pp $-236 | +1.0pp $-283 |
UW: 25.0% down · 7.5% · 30yr · 1.5% tax · 5.0% vac · 8.0% maint · 8.0% mgmt
Financing live
Cash to close
- Down payment
- $44,500
- Closing costs
- $5,340
- Reserves months
- —
- Total cash needed
- —
Loan-product check · same deal, 3 products live
Conventional
25% down · 7.5% · 30yr
- Down + closing
- —
- Monthly P&I
- —
- Monthly cashflow
- —
- DSCR
- —
- Eligible?
- —
Personal DTI + credit; lowest rate.
DSCR
20% down · 8.5% · 30yr
- Down + closing
- —
- Monthly P&I
- —
- Monthly cashflow
- —
- DSCR
- —
- Eligible?
- —
No personal income docs; deal must DSCR.
Hard money
10% down · 12.0% · 12mo
- Down + closing
- —
- Monthly P&I
- —
- Monthly cashflow
- —
- DSCR
- —
- Eligible?
- —
Short-term bridge; refi at stabilization.
Rent comps 12 comps
| Address | Beds | Baths | Sqft | Rent | $/sqft | DOM | Units | Dist |
|---|---|---|---|---|---|---|---|---|
| 12500 SE 110th Ct Clackamas, OR | 2.0 | 1.0 | 675 | $1,595 | $2.36 | 4d | 1 | 0.06mi |
| 11480 SE Sunnyside Rd Clackamas, OR | 1.0–3.0 | 1.0–2.0 | 936 | $1,910 | $2.04 | 0d | 17 | 0.20mi |
| 9977 SE Talbert St Clackamas, OR | 1.0 | 1.0 | 610 | $1,495 | $2.45 | 0d | 1 | 0.58mi |
| 9840 SE Talbert St Clackamas, OR | 1.0–3.0 | 1.0–2.0 | 907 | $1,774 | $1.96 | 0d | 25 | 0.62mi |
| 11430 SE Stevens Rd Happy Valley, OR | 1.0–3.0 | 1.0–2.0 | 1010 | $2,150 | $2.13 | 0d | 8 | 0.80mi |
| 13300 SE 122nd Ave Clackamas, OR | 1.0–3.0 | 1.0–2.0 | 975 | $1,874 | $1.92 | 0d | 6 | 0.80mi |
| 11299 SE Stevens Rd Unit 65-303 Happy Valley, OR | 1.0 | 1.0 | 620 | $1,440 | $2.32 | 25d | 1 | 0.83mi |
| 10555 SE Mather Rd Clackamas, OR | 1.0–3.0 | 1.0–2.0 | 822 | $1,712 | $2.08 | 45d | 1 | 0.84mi |
| 11408 SE 90th Ave Unit 1320 Happy Valley, OR | 1.0 | 1.0 | 532 | $1,200 | $2.26 | 25d | 1 | 1.08mi |
| 9009 SE Causey Ave Happy Valley, OR | 1.0–2.0 | 1.0–2.0 | 863 | $1,535 | $1.78 | 45d | 1 | 1.17mi |
| 8640 SE Causey Ave Happy Valley, OR | 1.0–3.0 | 1.0–2.0 | 925 | $1,649 | $1.78 | 0d | 12 | 1.25mi |
| 11282 SE Causey Cir Happy Valley, OR | 1.0–3.0 | 1.0–2.5 | 1097 | $2,114 | $1.93 | 0d | 8 | 1.30mi |
HOA detail condo
- Monthly dues
- $439 · $5,268/yr
- Likely covers
- watersewertrashexterior maint.pool
- Assessments
- None detected in remarks — confirm with the listing agent.
Listing history 38 events
-
2026-06-22price $178,000 Active 80 DOM
-
2026-06-21days on market $198,000 Active 80 DOM
-
2026-06-18days on market $198,000 Active 77 DOM
-
2026-06-17days on market $198,000 Active 76 DOM
-
2026-06-16days on market $198,000 Active 75 DOM
-
2026-06-15days on market $198,000 Active 74 DOM
-
2026-06-13days on market $198,000 Active 72 DOM
-
2026-06-09days on market $198,000 Active 68 DOM
-
2026-06-08days on market $198,000 Active 67 DOM
-
2026-06-07days on market $198,000 Active 66 DOM
-
2026-06-05days on market $198,000 Active 63 DOM
-
2026-06-03pricedays on market $198,000 Active 62 DOM
-
2026-06-02days on market $215,000 Active 61 DOM
-
2026-06-01days on market $215,000 Active 60 DOM
-
2026-05-31days on market $215,000 Active 59 DOM
-
2026-05-13price $215,000 660-char remark
Show marketing remark (660 chars)
Beautifully located end-unit condo in one of the most private and quiet settings in the community, backing to Mt. Talbert and Mt. Scott Creek. Just 1.3 miles to Clackamas Town Center, MAX Station, and Costco with easy access to freeways, hospital, and shopping. Features include two bedrooms, cozy wood burning fireplace, and green space views. Unique to this unit is a front patio area, plus a deck for outdoor living. No rental cap. Excellent value in a prime location, and access to walking trails from your front door. HOA covers pool, sewer, trash, water, basketball court, and exterior maintenance. Washer, dryer, fridge, and all appliances are included.
-
2026-04-02$220,000 Active 660-char remark
Show marketing remark (660 chars)
Beautifully located end-unit condo in one of the most private and quiet settings in the community, backing to Mt. Talbert and Mt. Scott Creek. Just 1.3 miles to Clackamas Town Center, MAX Station, and Costco with easy access to freeways, hospital, and shopping. Features include two bedrooms, cozy wood burning fireplace, and green space views. Unique to this unit is a front patio area, plus a deck for outdoor living. No rental cap. Excellent value in a prime location, and access to walking trails from your front door. HOA covers pool, sewer, trash, water, basketball court, and exterior maintenance. Washer, dryer, fridge, and all appliances are included.
-
2019-01-04soldstatus $175,000 Sold 457-char remark
Show marketing remark (457 chars)
Best location w/in development at end making it private & quiet. Backs to Mt Talbert & Mt Scott creek. 1.3 miles to Clackamas Town Center, MAX Station & Costco. Easy commute to freeways, hospital & shopping as well. Condo features many updates including; quartz countertops, manufactured laminate flooring, new lighting. Unit also has additional storage that other units don't plus 2 decks/patios. Low HOA's & taxes make this a must see!
-
2019-01-04soldstatus $175,000
Show marketing remark (457 chars)
Best location w/in development at end making it private & quiet. Backs to Mt Talbert & Mt Scott creek. 1.3 miles to Clackamas Town Center, MAX Station & Costco. Easy commute to freeways, hospital & shopping as well. Condo features many updates including; quartz countertops, manufactured laminate flooring, new lighting. Unit also has additional storage that other units don't plus 2 decks/patios. Low HOA's & taxes make this a must see!
-
2018-12-18status Pending 457-char remark
Show marketing remark (457 chars)
Best location w/in development at end making it private & quiet. Backs to Mt Talbert & Mt Scott creek. 1.3 miles to Clackamas Town Center, MAX Station & Costco. Easy commute to freeways, hospital & shopping as well. Condo features many updates including; quartz countertops, manufactured laminate flooring, new lighting. Unit also has additional storage that other units don't plus 2 decks/patios. Low HOA's & taxes make this a must see!
-
2018-11-30$179,950 Active 457-char remark
Show marketing remark (457 chars)
Best location w/in development at end making it private & quiet. Backs to Mt Talbert & Mt Scott creek. 1.3 miles to Clackamas Town Center, MAX Station & Costco. Easy commute to freeways, hospital & shopping as well. Condo features many updates including; quartz countertops, manufactured laminate flooring, new lighting. Unit also has additional storage that other units don't plus 2 decks/patios. Low HOA's & taxes make this a must see!
-
2018-11-27status Active
-
2018-11-26Active
-
2018-11-26historical
-
2018-11-26historical
-
2016-02-26soldstatus $125,000 Sold
-
2016-02-26soldstatus $125,000
-
2016-01-12status Pending
-
2016-01-10$120,000 Active
-
2007-07-18soldstatus $102,000
-
2007-07-17soldstatus $102,000
-
2007-06-20historical
-
2007-06-11$99,000
-
2004-06-11soldstatus $59,500
-
2004-05-13historical
-
2003-10-09$59,500
-
1993-06-25soldstatus $916,300
-
1989-07-01soldstatus $1,250,000
ⓘ Source: listings_history table (triggers on properties + properties_extension) + one-shot
backfill from property_details.listing_events for pre-trigger history.
Tax reassessment forecast OR · Resets to sale price
- Current annual tax
- $1,145 · $95/mo
- Projected year-2 tax
- $1,727 · $144/mo
- Expected delta
- +$582/yr (+$48/mo · 50.8%)
ⓘ Screening estimate from a state-policy table — verify with the county assessor before closing.
Climate risk First Street
- Flood 1/10 Low FEMA zone X (unshaded) · 0% chance over 30 yrs
- Wildfire 1/10 Low
- Heat 3/10 Moderate 7 d/yr ≥93°F today · 14 d/yr by 30 yrs out
- Wind 1/10 Low
- Air quality 10/10 Extreme 18 unhealthy d/yr today · 20 by 30 yrs out
Nearby sold comps map
Loading sold comps map…
Walkable amenities ~0.75 mi
Loading nearby amenities…
Taxation est. · year 1
- Rental income
- $20,536
- − Mortgage interest
- −$9,971
- − Property taxes
- −$1,145
- − Insurance
- −$890
- − Repairs & maintenance
- −$1,643
- − Management
- −$1,643
- − HOA
- −$5,268
- − Depreciation
- −$5,178
- Taxable loss
- −$5,201
- Est. tax savings @ 24.0%
- +$1,248
- After-tax cash flow
- $-1,032/yr
For passive investors: Depreciation is non-cash, so a rental often shows a tax loss while cash-flowing — sheltering income. Rental losses are passive: they offset passive income freely, and up to $25,000/yr can offset ordinary (W-2) income if you actively participate and your MAGI is under $100k (phasing out to $0 by $150k); unused losses carry forward. On sale, claimed depreciation is recaptured at up to 25%, and gains may owe capital-gains tax (a 1031 exchange can defer both). Figures are a year-1 estimate at your 24.0% rate — not tax advice; consult a CPA.
Schools (NCES district)
- District
- North Clackamas SD 12
- NCES district ID
- 4108830
- Math proficiency
- 29% ▼ -14.00%
- Reading proficiency
- 43% ▼ -13.00%
- Median HH income
- $60,217
- Composite
- 32.1/100
- National rank
- #5807
- State rank
- #22 of 58 in OR
Livability — Happy Valley
- Score
- 76/100
- State rank
- #76
- US rank
- #3386
Category grades
Schools grade is shown separately in the Schools card above.
Census & demographics
- County
- Clackamas County · 361,406 people
- City population
- 34,567
- Metro
- Portland-Vancouver-Hillsboro, OR-WA
- Population (ZIP)
- 24,433
- Household income
- $87,333
- Rent vs Own
- Severe rent burden
- 1166.0
Population outlook (Clackamas County) Hauer SSP2
- Today (2025)
- 458,456 people
- By 2030
- 485,185 · +5.8%
- By 2040
- 532,932 · +16.2%
- By 2050
- 574,445 · +25.3%
- By 2075
- 665,497 · +45.2%
- By 2100
- 697,488 · +52.1%
Race, ethnicity, and origin ACS 2023
- Neighborhood character
- Predominantly White (66%)
- Race & ethnicity
- White 66% Hispanic / Latino 15% Two or more races 12% Asian 11% Black 2%
- Hispanic origin (detail)
- Mexican 13%
- Common ancestry
- Italian 4% Scotch-Irish 4% Lithuanian 3%
- Foreign-born
- 15% · Canada, China, Vietnam
- Languages at home
- 74% English-only · Spanish 11% Chinese 5% Russian/Polish/Slavic 3%
Political lean MEDSL · Clackamas
- 2024 margin
- Lean D (+9.7) · D 53.4% · R 43.6% · Other 3.0%
- 2008→2024 swing
- -0.6pp no change · 2008: 10.4pp · 2024: 9.7pp
- All cycles
- 2024: D+9.7 2020: D+11.1 2016: D+6.1 2012: D+3.5 2008: D+10.4
Not yet ingested
- Civics
- —
Market trends
- HPI YoY
- ▼ -170.50%
- Current HPI
- 295.7295
- Rent YoY
- ▲ 2.48%
- Metro
- Portland-Vancouver-Hillsboro, OR-WA
- State GDP YoY
- ▲ 2.05%
- F500 in state
- 2
Industry mix (Fortune 500 HQ in OR)
| Industry | F500 HQs | Revenue |
|---|---|---|
| Consumer Goods | 1 | $51B |
|
||
Price history
-82.8% since first listed23 events — show timeline
- 2026-05-13 Price Changed $215,000 RMLS
- 2026-04-02 Listed $220,000 RMLS
- 2019-01-04 Sold (Public Records) $175,000 Public Records
- 2019-01-04 Sold (MLS) $175,000 RMLS
- 2018-12-18 Pending — RMLS
- 2018-11-30 Listed $179,950 RMLS
- 2018-11-27 Relisted — RMLS
- 2018-11-26 Delisted — RMLS
- 2018-11-26 Delisted — RMLS
- 2018-11-26 Listed — RMLS
- 2016-02-26 Sold (Public Records) $125,000 Public Records
- 2016-02-26 Sold (MLS) $125,000 RMLS
- 2016-01-12 Pending — RMLS
- 2016-01-10 Listed $120,000 RMLS
- 2007-07-18 Sold (MLS) $102,000 RMLS
- 2007-07-17 Sold (Public Records) $102,000 Public Records
- 2007-06-20 Delisted — RMLS
- 2007-06-11 Listed $99,000 RMLS
- 2004-06-11 Sold (MLS) $59,500 RMLS
- 2004-05-13 Delisted — RMLS
- 2003-10-09 Listed $59,500 RMLS
- 1993-06-25 Sold (Public Records) $916,300 Public Records
- 1989-07-01 Sold (Public Records) $1,250,000 Public Records
Property tax history
+3.8%/yrLatest (2025): $1,145 · +3.7% YoY. Source: county tax records.
Cash-flow waterfall
monthlySold comps — $/sqft
last 12 mo · ≤1 miLoading sold comps…