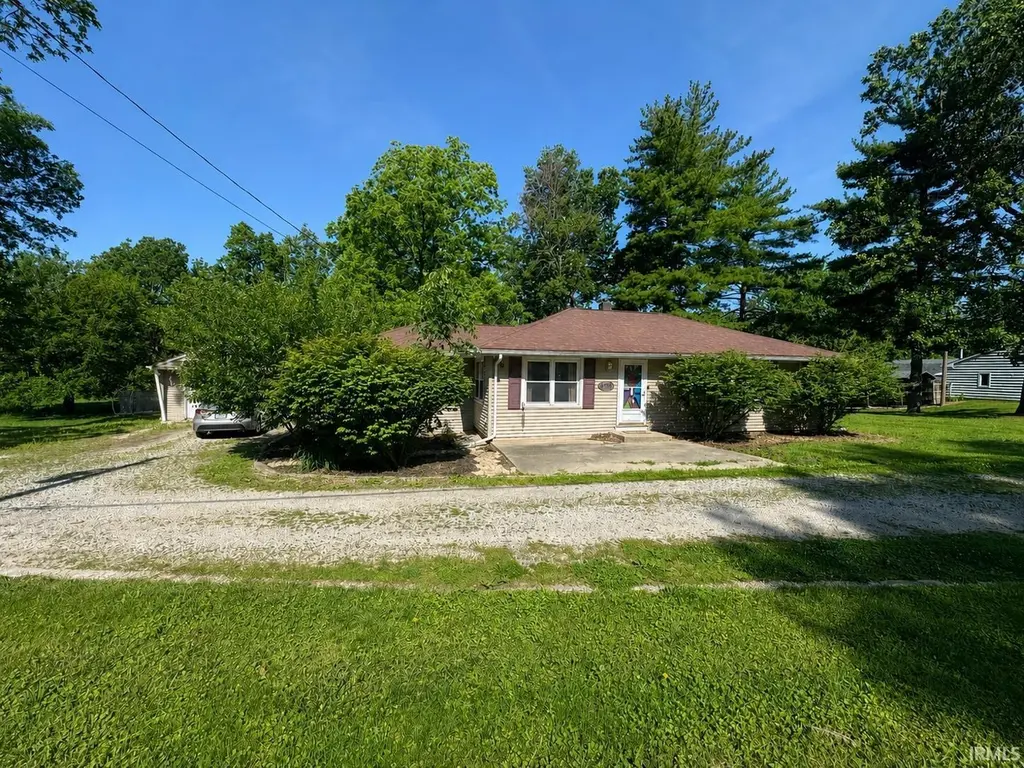
695 S 300 W · Kokomo, IN
Flood risk 1/10 · Minimal
- FEMA flood zone
- X (unshaded)
- Chance of flooding over 30 yrs
- 0.0%
- Est. flood insurance / yr
- $507 – $1,088
Fire risk 1/10 · Minimal
- Est. fire insurance / yr
- $717 – $1,331
Heat risk 3/10 · Minor
- Hot days now (above 102°F)
- 7 days/yr
- Hot days in 30 yrs
- 17 days/yr
Wind risk 2/10 · Minimal
- Chance of severe wind over 30 yrs
- 1.0%
Air-quality risk 3/10 · Minor
- Unhealthy air days now
- 1 days/yr
- Unhealthy air days in 30 yrs
- 3 days/yr
Risk factors via First Street. Map © Google.
Why this score? — see what drove the D+ grade
The composite is a weighted blend of 9 inputs, each scored 0–100. Each bar is that input's sub-score; the figure is the points it added to the 100-point composite (weight × sub-score).
- Cash flow +13.2/30.0
- ARV discount +12.5/15.0
- Schools +4.4/10.0
- DSCR +4.0/10.0
- Livability +3.4/5.0
- Rent growth +3.0/5.0
- 1% rule +2.5/10.0
- Condition / age +2.5/5.0
- Appreciation +0.0/10.0
$179,900
🖨 Deal sheet 📄 Offer letter ✓ Due diligence
Listing remarks MLS
Nice home located in Western School District. Home has had many updates including newer kitchen, flooring, newer interior doors, updated bath. Roof is 3 yrs od and crawl space is encapsulated. Beautiful tiered backyard with fire pit on nearly 3/4 acre lot. Country living with city amenities. Possible Immediate Possession
Key facts
- Park-like setting
- Updated kitchen
- Over a half acre
Tags
Property features AI
Finance
- Financial info: Annual tax information available
Exterior
- Parking: Detached 2-car garage
- Utilities: Public water; Septic tank sewer
- Home design: Single-family, site-built home; One-story
- Construction: Vinyl siding; Shingle roof
- Exterior features: Lot dimensions approximately 169 x 196.75; Lot size about 0.69 acre
Interior
- Bedrooms: Total of 5 rooms (bedrooms included)
- Bathrooms: One full bathroom (main level)
- Heating & cooling: Central air conditioning; Natural gas forced-air heating
- Interior features: Crawl space basement
- Laundry & utility: Main-level laundry
Neighborhood map
What this means for you Summary
Snapshot
- This is a 3-bed/1.0-bath single-family listed at $180k.
Deal economics
- At list price, monthly cash flow is $-5 ($-56/yr) — negative.
- To cash-flow at today's rent, offer at most $179k (0.5% below list).
- To meet the 1% rule (rent ≥ 1% of price), the offer needs to be $135k (24.9% below list).
- Recommended offer: $135k (24.9% below list) — sets the bar for 1% rule.
Location & tenants
- Location reads 68/100 on livability (#227 in IN) — a middle-class / working-renter tenant base. Strengths: cost of living A+, housing A+, health & safety A; Watch: crime D, amenities F, commute F.
- Western School Corporation (rural): math 48% / reading 52% proficiency, ranked #44 of 301 in IN (top 15%) — acceptable for families but not a draw, mixed tenant base, ~2y average lease.
- Zoned schools: Western Primary School (576 students, 42% FRL); Western Middle School (math 43% / reading 54%, grade C-, #56 of 330 statewide, top 18%, 569 students, 36% FRL); Western High School (math 40% / reading 67%, grade C-, #97 of 369 statewide, top 26%, 824 students, 30% FRL).
- Market conditions: Rents rising (+1.8%/yr); 232 active listings in the ZIP; 194 units permitted in Howard County in 2024 (0 in 5+ unit buildings).
Forward outlook
- Local home prices are declining (-3.0%/yr); year-one equity from $1k of loan paydown is wiped out by about $5k of value loss. Plan a longer hold.
- Howard County population projected at -11% by 2050 — secular population decline; favor cash flow + early exit over multi-decade hold.
Negotiation context
- It's been on market 20 days — a 2% lower offer ($177k) is reasonable based on typical stale-listing flexibility.
- 2 sale attempts since 5y ago; this cycle's ask has dropped $10k (5%) from the opening price — seller is motivated, your offer sets the floor, not the list.
- Current owner paid $150k; 20% above their basis — modest negotiation headroom, anchor on the comps not their cost.
Risks & watch-outs
- Watch-outs: built in 1948 — expect roof / HVAC / electrical / plumbing capex.
Questions for the listing agent
- What do current leases actually rent for vs. the listed asking? Can we see a recent rent roll and the last 12 months of T-12 income?
- Built in 1948 — when were the roof, HVAC, electrical panel, plumbing, and water heater last replaced?
- Is there a deadline driving the sale (1031 exchange, divorce, estate, relocation)? That informs how much negotiation room exists.
- Schools are F-rated, which usually means shorter tenancies and higher turnover. Who's the typical renter profile here, and what's been the actual vacancy rate?
- Crime grade is D in this area — have there been break-ins, vandalism, or insurance claims at this property in the last 3 years? What carrier currently insures it and at what premium?
- The area grade is low — what's the realistic commute time and amenity access for the typical tenant pool here? Any planned neighborhood developments (good or bad) we should know about?
- What's the average days-on-market for RENTAL listings here right now (not sales)? A rising rental-DOM trend means longer vacancies and softer asking-rent achievability than the comps imply.
- What's the recent tenant-quality profile in this submarket — average credit score on applications, eviction rate, late-payment / NSF rate, and stable-employment percentage? A property-management company in the area should have these aggregated.
- How much new for-sale + rental construction is in the pipeline within 1–3 miles? Heavy new supply typically softens prices + rents 12–24 months out; constrained supply supports both.
Investment metrics
- 1% rule
- 0.75% ✗
- Cap rate
- 6.26%
- Cash-on-cash
- -0.11%
- DSCR
- 1.00
- GRM
- 11.1
CMA / ARV
- ARV (on-the-fly)
- $202,240
- Comps found
- 6
Show comp detail 6 sales within ~0.75 mi
| Address | Dist | Beds/Ba | Sqft | Sold | Price | $/sf | Match |
|---|---|---|---|---|---|---|---|
| 2790 Bridgestone Cir | 0.44mi | 2/2.0 (-1) | 1,382 (+9%) | 7mo | $252,294 | $183 | 49 |
| 3107 W Boulevard St | 0.61mi | 3/1.5 | 1,314 (+4%) | 20mo | $215,000 | $164 | 46 |
| 134 St Louis Ct | 0.71mi | 3/2.0 | 1,368 (+8%) | 13mo | $190,000 | $139 | 38 |
| 2403 Burgundy Dr | 0.71mi | 4/1.5 (+1) | 1,368 (+8%) | 12mo | $193,000 | $141 | 36 |
| 101 St Louis Ct | 0.74mi | 3/1.5 | 1,448 (+15%) | 14mo | $145,000 | $100 | 28 |
| 3382 Weathered Rock Cir | 0.61mi | 2/2.0 (-1) | 1,434 (+13%) | 22mo | $230,000 | $160 | 22 |
Match score weights: distance 35% · size 25% · config 20% · recency 20%. Top-matched comps best support the ARV.
Projected returns pro-forma
-3.0% appreciation · 1.8% rent growth · sell at horizon
- IRR
- -17.7%
- Equity multiple
- 0.38×
- Total profit
- $-31,145
- Equity at exit
- $26,824
- IRR
- -12.0%
- Equity multiple
- 0.32×
- Total profit
- $-34,304
- Equity at exit
- $15,554
Cash invested: $50,372 (down + closing). Projections, not guarantees.
Landlord ↔ Tenant lean methodology
- Overall (STATE)
- 90 Strongly Landlord-Friendly
- State Indiana
- 90 Strongly Landlord-Friendly · R+11
- County
- — inherits STATE
- City
- — inherits STATE
ZIP-level market 46902
- Home prices YoY
- -20.7%
- Rents YoY
- 1.8%
- Active inventory
- 232
- Price-to-rent
- 11.1×
Monthly cashflow live
- Estimated rent
- $1,351 medium interval (Pro) →
- Mortgage (P&I)
- −$943
- Tax from tax record
- −$53 /mo · $640/yr
- Insurance
- −$75
- HOA
- −$0
- Vacancy / Maint / Mgmt
- −$284
- Net cashflow
- $-5
Break-even live
UW: 25.0% down · 7.5% · 30yr · 1.5% tax · 5.0% vac · 8.0% maint · 8.0% mgmt
Financing live
Cash to close
- Down payment
- $44,975
- Closing costs
- $5,397
- Reserves months
- —
- Total cash needed
- —
Loan-product check · same deal, 3 products live
Conventional
25% down · 7.5% · 30yr
- Down + closing
- —
- Monthly P&I
- —
- Monthly cashflow
- —
- DSCR
- —
- Eligible?
- —
Personal DTI + credit; lowest rate.
DSCR
20% down · 8.5% · 30yr
- Down + closing
- —
- Monthly P&I
- —
- Monthly cashflow
- —
- DSCR
- —
- Eligible?
- —
No personal income docs; deal must DSCR.
Hard money
10% down · 12.0% · 12mo
- Down + closing
- —
- Monthly P&I
- —
- Monthly cashflow
- —
- DSCR
- —
- Eligible?
- —
Short-term bridge; refi at stabilization.
Listing history 15 events
-
2026-06-19days on market $179,900 Active 20 DOM
-
2026-06-18days on market $179,900 Active 19 DOM
-
2026-06-17days on market $179,900 Active 18 DOM
-
2026-06-16pricedays on market $179,900 Active 17 DOM
-
2026-06-15days on market $184,900 Active 16 DOM
-
2026-06-14days on market $184,900 Active 14 DOM
-
2026-06-13days on market $184,900 Active 13 DOM
-
2026-06-10days on market $184,900 Active 11 DOM
-
2026-06-09days on market $184,900 Active 10 DOM
-
2026-06-08days on market $184,900 Active 9 DOM
-
2026-06-07pricedays on market $184,900 Active 8 DOM
-
2026-06-02days on market $189,900 Active 3 DOM
-
2026-06-01days on market $189,900 Active 2 DOM
-
2026-05-31remarks 699-char remark
-
2026-05-31$189,900 Active 1 DOM
ⓘ Source: listings_history table (triggers on properties + properties_extension) + one-shot
backfill from property_details.listing_events for pre-trigger history.
Tax reassessment forecast IN · Partial reset (capped growth)
- Current annual tax
- $640 · $53/mo
- Projected year-2 tax
- $1,085 · $90/mo
- Expected delta
- +$444/yr (+$37/mo · 69.4%)
ⓘ Screening estimate from a state-policy table — verify with the county assessor before closing.
Climate risk First Street
- Flood 1/10 Low FEMA zone X (unshaded) · 0% chance over 30 yrs
- Wildfire 1/10 Low
- Heat 3/10 Moderate 7 d/yr ≥102°F today · 17 d/yr by 30 yrs out
- Wind 2/10 Low 100% chance of damaging wind over 30 yrs
- Air quality 3/10 Moderate 1 unhealthy d/yr today · 3 by 30 yrs out
Nearby sold comps map
Loading sold comps map…
Walkable amenities ~0.75 mi
Loading nearby amenities…
Taxation est. · year 1
- Rental income
- $16,209
- − Mortgage interest
- −$10,077
- − Property taxes
- −$640
- − Insurance
- −$900
- − Repairs & maintenance
- −$1,297
- − Management
- −$1,297
- − Depreciation
- −$5,233
- Taxable loss
- −$3,235
- Est. tax savings @ 24.0%
- +$776
- After-tax cash flow
- $721/yr
For passive investors: Depreciation is non-cash, so a rental often shows a tax loss while cash-flowing — sheltering income. Rental losses are passive: they offset passive income freely, and up to $25,000/yr can offset ordinary (W-2) income if you actively participate and your MAGI is under $100k (phasing out to $0 by $150k); unused losses carry forward. On sale, claimed depreciation is recaptured at up to 25%, and gains may owe capital-gains tax (a 1031 exchange can defer both). Figures are a year-1 estimate at your 24.0% rate — not tax advice; consult a CPA.
Schools (NCES district)
- District
- Western School Corporation
- NCES district ID
- 1804470
- Math proficiency
- 48% ▼ -12.00%
- Reading proficiency
- 52% ▼ -8.00%
- Median HH income
- $62,856
- Composite
- 44.0/100
- National rank
- #2891
- State rank
- #44 of 301 in IN
Livability — Kokomo
- Score
- 68/100
- State rank
- #227
- US rank
- #9912
Category grades
Schools grade is shown separately in the Schools card above.
Census & demographics
- County
- Howard County · 75,099 people
- City population
- 75,099
- Metro
- Kokomo, IN
- Population (ZIP)
- 37,017
- Household income
- $62,126
- Rent vs Own
- Severe rent burden
- 1262.0
Population outlook (Howard County) Hauer SSP2
- Today (2025)
- 81,522 people
- By 2030
- 80,104 · -1.7%
- By 2040
- 76,708 · -5.9%
- By 2050
- 72,880 · -10.6%
- By 2075
- 64,016 · -21.5%
- By 2100
- 51,705 · -36.6%
Race, ethnicity, and origin ACS 2023
- Neighborhood character
- Predominantly White (81%)
- Race & ethnicity
- White 81% Black 9% Two or more races 5% Hispanic / Latino 4% Asian 3%
- Common ancestry
- Italian 2% Lithuanian 1% Slovak 1%
- Foreign-born
- 3% · Canada, Vietnam, China
- Languages at home
- 96% English-only · Vietnamese 1% Other Asian/Pacific 1% Spanish 1%
Political lean MEDSL · Howard
- 2024 margin
- Solid R (+35.3) · D 31.4% · R 66.7% · Other 1.8%
- 2008→2024 swing
- -29.1pp toward R · 2008: -6.2pp · 2024: -35.3pp
- All cycles
- 2024: R+35.3 2020: R+32.4 2016: R+33.9 2012: R+14.3 2008: R+6.2
Not yet ingested
- Civics
- —
Market trends
- HPI YoY
- ▼ -61.76%
- Current HPI
- 236.8237
- Rent YoY
- ▲ 1.80%
- Metro
- Kokomo, IN
- State GDP YoY
- ▲ 2.90%
- F500 in state
- 18
Industry mix (Fortune 500 HQ in IN)
| Industry | F500 HQs | Revenue |
|---|---|---|
| Industrial Machinery | 2 | $37B |
|
||
| Healthcare | 1 | $177B |
|
||
| Pharmaceuticals | 1 | $45B |
|
||
| Metals / Steel | 1 | $18B |
|
||
| Agriculture | 1 | $17B |
|
||
| Packaging | 1 | $12B |
|
||
Price history
+22.6% since first listed3 events — show timeline
- 2026-05-29 Listed $189,900 IRMLS
- 2022-02-22 Sold (MLS) $150,000 IRMLS
- 2021-10-16 Listed $154,900 IRMLS
Property tax history
+11.5%/yrLatest (2024): $640 · +17.3% YoY. Source: county tax records.
Cash-flow waterfall
monthlySold comps — $/sqft
last 12 mo · ≤1 miLoading sold comps…