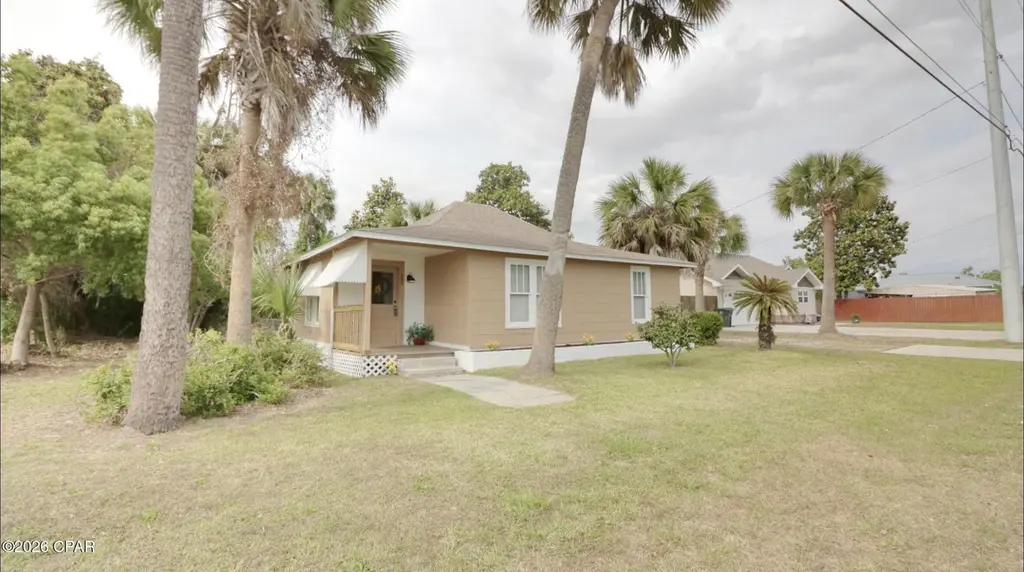
200 E 5th St · Lynn Haven, FL
Flood risk 7/10 · Major
- FEMA flood zone
- X (unshaded)
- Chance of flooding over 30 yrs
- 0.74%
- Est. flood insurance / yr
- $507 – $1,088
Fire risk 1/10 · Minimal
- Est. fire insurance / yr
- $947 – $1,759
Heat risk 10/10 · Severe
- Hot days now (above 104°F)
- 7 days/yr
- Hot days in 30 yrs
- 21 days/yr
Wind risk 9/10 · Severe
- Chance of severe wind over 30 yrs
- 99.0%
Air-quality risk 1/10 · Minimal
- Unhealthy air days now
- 0 days/yr
- Unhealthy air days in 30 yrs
- 0 days/yr
Risk factors via First Street. Map © Google.
Why this score? — see what drove the D grade
The composite is a weighted blend of 9 inputs, each scored 0–100. Each bar is that input's sub-score; the figure is the points it added to the 100-point composite (weight × sub-score).
- Cash flow +14.3/30.0
- ARV discount +7.7/15.0
- DSCR +4.3/10.0
- Schools +4.3/10.0
- Livability +4.0/5.0
- Rent growth +3.1/5.0
- 1% rule +3.0/10.0
- Condition / age +2.5/5.0
- Appreciation +0.0/10.0
$202,400
🖨 Deal sheet (PDF) 📄 Offer letter ✓ Due diligence
Listing remarks
Experience the best of Lynn Haven living in this charming Home, perfectly positioned for a relaxed and convenient lifestyle. Imagine strolling to local restaurants and shops, enjoying the vibrant community atmosphere. With a park and boat access just two blocks away, weekends can be filled with outdoor adventures and water-filled fun! This 2-bedroom, 1-bathroom home sits on a lovely corner lot, with beautiful magnolia and palm trees for a southern coastal feel. The interior offers a cozy yet functional layout, ideal for comfortable living. Whether you're a first-time homebuyer, downsizing, or looking for a smart investment, this property offers endless possibilities. Don't miss the oppor
Key facts
- Boat access
- Palm trees
- Corner lot
Tags
Property features AI
Exterior
- Parking: 1-car garage
- Utilities: Electricity available; Public sewer
- Home design: Single-family residence (zoned residential single family)
- Exterior features: Chain link fence; City street frontage; Publicly maintained road
Interior
- Kitchen: Electric oven
- Bedrooms: Primary bedroom on the main level; Additional bedroom on the main level
- Bathrooms: 1 full bathroom
- Heating & cooling: Central heating (electric); Central air conditioning; Ceiling fans
- Interior features: Main level primary bedroom
Neighborhood map
What this means for you Summary
Snapshot
- This is a 2-bed/1.0-bath single-family listed at $202k.
Deal economics
- At list price, monthly cash flow is $-31 ($-366/yr) — negative.
- To cash-flow at today's rent, offer at most $197k (2.7% below list).
- To meet the 1% rule (rent ≥ 1% of price), the offer needs to be $163k (19.7% below list).
- Recommended offer: $163k (19.7% below list) — sets the bar for 1% rule.
- Cap rate 6.5% vs local median 3.5% in Lynn Haven — top-decile yield for the area; either an underpriced asset or a hidden risk that comps aren't pricing in. Stress-test before assuming the spread holds.
Location & tenants
- Location reads 81/100 on livability (#96 in FL, #1,472 nationally) — a professional / high-income tenant draw. Strengths: crime A+, housing A+, health & safety A+; Watch: amenities D+, commute F.
- Bay (suburban): math 51% / reading 51% proficiency, ranked #29 of 73 in FL (top 40%) — acceptable for families but not a draw, mixed tenant base, ~2y average lease.
- Zoned schools: Lynn Haven Elementary School (math 63% / reading 54%, grade B-, #735 of 2,144 statewide, top 35%, 699 students, 46% FRL); Mowat Middle School (math 49% / reading 51%, grade C, #254 of 571 statewide, top 45%, 868 students, 49% FRL); A. Crawford Mosley High School (math 51% / reading 55%, grade C-, #148 of 667 statewide, top 23%, 1,901 students, 36% FRL) — zoned schools at 44% FRL track the district average.
- Market conditions: Rents rising (+2.5%/yr); 199 active listings in the ZIP; 1 comparable units currently listed for rent nearby; solid renter incomes; 2,473 units permitted in Bay County in 2024 (559 in 5+ unit buildings).
Forward outlook
- Local home prices are declining (-3.0%/yr); year-one equity from $1k of loan paydown is wiped out by about $6k of value loss. Plan a longer hold.
- Bay County population projected at +24% by 2050 — long-run rental-demand tailwind backs the buy-and-hold thesis.
Negotiation context
- It's been on market 43 days — a 3% lower offer ($196k) is reasonable based on typical stale-listing flexibility.
- 7 sale attempts since 25y ago with the ask held roughly flat each time — persistent listings suggest the price (not the market) is what's stuck; bring a comps-based counter.
- Current owner paid $45k; list at $202k implies a 350% gain — meaningful room to come down on a strong offer.
Risks & watch-outs
- Watch-outs: flood insurance adds $66/mo; built in 1935 — expect roof / HVAC / electrical / plumbing capex.
- Climate carrying-cost: major flood risk; severe wind risk, 99% chance of damaging wind over 30y; extreme-heat days projected 7→21/yr by 2055 (HVAC capex compounding) — expect insurance premiums to compound above CPI over the hold.
Questions for the listing agent
- What do current leases actually rent for vs. the listed asking? Can we see a recent rent roll and the last 12 months of T-12 income?
- It's been on market 43 days. Have you received any prior offers? Is the seller open to a 20% concession, seller financing, or rate buy-down credit?
- Built in 1935 — when were the roof, HVAC, electrical panel, plumbing, and water heater last replaced?
- What's the actual annual flood-insurance premium (NFIP or private), and is the property in a SFHA with mandatory coverage?
- Is there a deadline driving the sale (1031 exchange, divorce, estate, relocation)? That informs how much negotiation room exists.
- Schools are B-rated — typically a magnet for longer-tenancy family renters. What's the average tenant stay here, and is there a school-zone premium baked into asking?
- The area grade is low — what's the realistic commute time and amenity access for the typical tenant pool here? Any planned neighborhood developments (good or bad) we should know about?
- What's the average days-on-market for RENTAL listings here right now (not sales)? A rising rental-DOM trend means longer vacancies and softer asking-rent achievability than the comps imply.
- What's the recent tenant-quality profile in this submarket — average credit score on applications, eviction rate, late-payment / NSF rate, and stable-employment percentage? A property-management company in the area should have these aggregated.
- How much new for-sale + rental construction is in the pipeline within 1–3 miles? Heavy new supply typically softens prices + rents 12–24 months out; constrained supply supports both.
Investment metrics
- 1% rule
- 0.80% ✗
- Cap rate
- 6.51%
- Cash-on-cash
- 0.76%
- DSCR
- 1.03
- GRM
- 10.4
CMA / ARV
- ARV (median comp)
- $203,414
- List price
- $202,400
- Delta
- -0.50%
- Verdict
- FAIR
- Comps
- 20 within 1.0 mi
Show comp detail 6 sales within ~0.75 mi
| Address | Dist | Beds/Ba | Sqft | Sold | Price | $/sf | Match |
|---|---|---|---|---|---|---|---|
| 312 Illinois Ave | 0.27mi | 2/1.0 | 902 (-6%) | 9mo | $150,000 | $166 | 71 |
| 918 Virginia Ave | 0.63mi | 2/1.0 | 955 (-0%) | 22mo | $196,000 | $205 | 53 |
| 1003 E 8th St | 0.63mi | 2/2.0 | 916 (-4%) | 12mo | $247,200 | $270 | 50 |
| 706 Alabama Ave | 0.43mi | 3/1.0 (+1) | 1,010 (+6%) | 19mo | $209,000 | $207 | 50 |
| 716 New York Ave | 0.34mi | 3/1.0 (+1) | 1,080 (+13%) | 16mo | $159,900 | $148 | 44 |
| 1112 Indiana Ave | 0.64mi | 3/1.0 (+1) | 1,093 (+14%) | 11mo | $192,000 | $176 | 32 |
Match score weights: distance 35% · size 25% · config 20% · recency 20%. Top-matched comps best support the ARV.
Projected returns pro-forma
-3.0% appreciation · 2.52% rent growth · sell at horizon
- IRR
- -17.9%
- Equity multiple
- 0.37×
- Total profit
- $-35,550
- Equity at exit
- $30,178
- IRR
- -11.0%
- Equity multiple
- 0.35×
- Total profit
- $-36,744
- Equity at exit
- $17,500
Cash invested: $56,672 (down + closing). Projections, not guarantees.
Landlord ↔ Tenant lean methodology
- Overall (STATE)
- 87 Strongly Landlord-Friendly
- State Florida
- 87 Strongly Landlord-Friendly · R+3
- County
- — inherits STATE
- City
- — inherits STATE
ZIP-level market 32444
- Home prices YoY
- -29.1%
- Rents YoY
- 2.5%
- Active inventory
- 199
- Price-to-rent
- 10.4×
Monthly cashflow live
- Estimated rent
- $1,626 medium interval (Pro) →
- Mortgage (P&I)
- −$1,061
- Tax from tax record
- −$103 /mo · $1,237/yr
- Insurance
- −$84
- Flood insurance flood zone
- −$66 /mo · $798/yr
- HOA
- −$0
- Vacancy / Maint / Mgmt
- −$342
- Net cashflow
- $-31
Break-even live
Sensitivity live
| Price | -10% $84 | -5% $27 | +0% $-31 | +5% $-88 | +10% $-145 |
|---|---|---|---|---|---|
| Rent | -10% $-159 | -5% $-95 | +0% $-31 | +5% $34 | +10% $98 |
| Rate | -1.0pp $71 | -0.5pp $21 | base $-31 | +0.5pp $-83 | +1.0pp $-136 |
UW: 25.0% down · 7.5% · 30yr · 1.5% tax · 5.0% vac · 8.0% maint · 8.0% mgmt
Financing live
Cash to close
- Down payment
- $50,600
- Closing costs
- $6,072
- Reserves months
- —
- Total cash needed
- —
Loan-product check · same deal, 3 products live
Conventional
25% down · 7.5% · 30yr
- Down + closing
- —
- Monthly P&I
- —
- Monthly cashflow
- —
- DSCR
- —
- Eligible?
- —
Personal DTI + credit; lowest rate.
DSCR
20% down · 8.5% · 30yr
- Down + closing
- —
- Monthly P&I
- —
- Monthly cashflow
- —
- DSCR
- —
- Eligible?
- —
No personal income docs; deal must DSCR.
Hard money
10% down · 12.0% · 12mo
- Down + closing
- —
- Monthly P&I
- —
- Monthly cashflow
- —
- DSCR
- —
- Eligible?
- —
Short-term bridge; refi at stabilization.
Rent comps 1 comps
| Address | Beds | Baths | Sqft | Rent | $/sqft | DOM | Units | Dist |
|---|---|---|---|---|---|---|---|---|
| 1409 Florida Ave Lynn Haven, FL | 2.0 | 1.0 | 800 | $1,276 | $1.59 | 22d | 1 | 0.99mi |
Listing history 26 events
-
2026-06-21days on market $202,400 Active 43 DOM
-
2026-06-19days on market $202,400 Active 41 DOM
-
2026-06-18days on market $202,400 Active 40 DOM
-
2026-06-17days on market $202,400 Active 39 DOM
-
2026-06-16days on market $202,400 Active 38 DOM
-
2026-06-15days on market $202,400 Active 37 DOM
-
2026-06-14days on market $202,400 Active 35 DOM
-
2026-06-13statusdays on market $202,400 Active 34 DOM
-
2026-06-02status $202,400 Pending 33 DOM
-
2026-06-01days on market $202,400 Active 33 DOM
-
2026-05-31days on market $202,400 Active 32 DOM
-
2026-05-30days on market $202,400 Active 31 DOM
-
2026-04-28$202,400 Active 782-char remark
-
2021-12-14historical
-
2021-12-09historical
-
2012-04-27soldstatus $45,000
-
2012-04-20soldstatus $45,000
-
2011-10-05$45,000
-
2009-10-03$118,000
-
2007-07-07$137,900
-
2006-08-21soldstatus $108,500
-
2006-08-17soldstatus $108,500
-
2006-08-07$115,000
-
2001-08-21soldstatus $40,000
-
2001-08-17soldstatus $40,000
-
2001-07-21$45,000
ⓘ Source: listings_history table (triggers on properties + properties_extension) + one-shot
backfill from property_details.listing_events for pre-trigger history.
Tax reassessment forecast FL · Resets to sale price
- Current annual tax
- $1,237 · $103/mo
- Projected year-2 tax
- $1,680 · $140/mo
- Expected delta
- +$443/yr (+$37/mo · 35.8%)
ⓘ Screening estimate from a state-policy table — verify with the county assessor before closing.
Climate risk First Street
- Flood 7/10 Severe FEMA zone X (unshaded) · 74% chance over 30 yrs
- Wildfire 1/10 Low
- Heat 10/10 Extreme 7 d/yr ≥104°F today · 21 d/yr by 30 yrs out
- Wind 9/10 Extreme 99% chance of damaging wind over 30 yrs
- Air quality 1/10 Low 0 unhealthy d/yr today · 0 by 30 yrs out
Nearby sold comps map
Loading sold comps map…
Walkable amenities ~0.75 mi
Loading nearby amenities…
Taxation est. · year 1
- Rental income
- $19,515
- − Mortgage interest
- −$11,338
- − Property taxes
- −$1,237
- − Insurance
- −$1,810
- − Repairs & maintenance
- −$1,561
- − Management
- −$1,561
- − Depreciation
- −$5,888
- Taxable loss
- −$3,879
- Est. tax savings @ 24.0%
- +$931
- After-tax cash flow
- $565/yr
For passive investors: Depreciation is non-cash, so a rental often shows a tax loss while cash-flowing — sheltering income. Rental losses are passive: they offset passive income freely, and up to $25,000/yr can offset ordinary (W-2) income if you actively participate and your MAGI is under $100k (phasing out to $0 by $150k); unused losses carry forward. On sale, claimed depreciation is recaptured at up to 25%, and gains may owe capital-gains tax (a 1031 exchange can defer both). Figures are a year-1 estimate at your 24.0% rate — not tax advice; consult a CPA.
Schools (NCES district)
- District
- Bay
- NCES district ID
- 1200090
- Math proficiency
- 51% ▼ -8.00%
- Reading proficiency
- 51% ▼ -7.00%
- Median HH income
- $47,740
- Composite
- 43.41/100
- National rank
- #3014
- State rank
- #29 of 73 in FL
Livability — Lynn Haven
- Score
- 81/100
- State rank
- #96
- US rank
- #1472
Category grades
Schools grade is shown separately in the Schools card above.
Census & demographics
- Census place
- Lynn Haven, FL
- County
- Bay County · 163,593 people
- City population
- 21,459
- Metro
- Panama City, FL
- Population (ZIP)
- 21,459
- Household income
- $83,160
- Rent vs Own
- Severe rent burden
- 430.0
Population outlook (Bay County) Hauer SSP2
- Today (2025)
- 206,264 people
- By 2030
- 217,740 · +5.6%
- By 2040
- 238,738 · +15.7%
- By 2050
- 255,545 · +23.9%
- By 2075
- 288,295 · +39.8%
- By 2100
- 288,638 · +39.9%
Race, ethnicity, and origin ACS 2023
- Neighborhood character
- Predominantly White (75%)
- Race & ethnicity
- White 75% Two or more races 11% Hispanic / Latino 10% Black 6% Asian 3%
- Hispanic origin (detail)
- Mexican 2% Puerto Rican 2%
- Common ancestry
- Lithuanian 3% Romanian 3% Serbian 2%
- Foreign-born
- 10% · Canada, Vietnam, South Korea
- Languages at home
- 87% English-only · Spanish 8% Russian/Polish/Slavic 1% Other Indo-European 1%
Political lean MEDSL · Bay
- 2024 margin
- Solid R (+47.4) · D 25.8% · R 73.1% · Other 1.1%
- 2008→2024 swing
- -6.6pp toward R · 2008: -40.7pp · 2024: -47.4pp
- All cycles
- 2024: R+47.4 2020: R+43.5 2016: R+46.3 2012: R+43.6 2008: R+40.7
Not yet ingested
- Civics
- —
Market trends
- HPI YoY
- ▼ -108.08%
- Current HPI
- 263.5418
- Rent YoY
- ▲ 2.52%
- Metro
- Panama City, FL
- State GDP YoY
- ▲ 3.28%
- F500 in state
- 36
Industry mix (Fortune 500 HQ in FL)
| Industry | F500 HQs | Revenue |
|---|---|---|
| Industrial Technology | 2 | $29B |
|
||
| Insurance | 2 | $17B |
|
||
| Retail | 1 | $60B |
|
||
| Technology Distribution | 1 | $58B |
|
||
| Homebuilding | 1 | $35B |
|
||
| Technology Manufacturing | 1 | $35B |
|
||
Price history
+349.8% since first listed16 events — show timeline
- 2026-06-11 Relisted — CPARMLS
- 2026-06-01 Pending — CPARMLS
- 2026-04-28 Listed $202,400 CPARMLS
- 2021-12-14 Listing Removed — CPARMLS
- 2021-12-09 Listing Removed — CPARMLS
- 2012-04-27 Sold (Public Records) $45,000 Public Records
- 2012-04-20 Sold (MLS) $45,000 CPARMLS
- 2011-10-05 Listed $45,000 CPARMLS
- 2009-10-03 Listed $118,000 CPARMLS
- 2007-07-07 Listed $137,900 CPARMLS
- 2006-08-21 Sold (Public Records) $108,500 Public Records
- 2006-08-17 Sold (MLS) $108,500 CPARMLS
- 2006-08-07 Listed $115,000 CPARMLS
- 2001-08-21 Sold (Public Records) $40,000 Public Records
- 2001-08-17 Sold (MLS) $40,000 CPARMLS
- 2001-07-21 Listed $45,000 CPARMLS
Property tax history
+4.4%/yrLatest (2025): $1,237 · +2.2% YoY. Source: county tax records.
Cash-flow waterfall
monthlySold comps — $/sqft
last 12 mo · ≤1 miLoading sold comps…