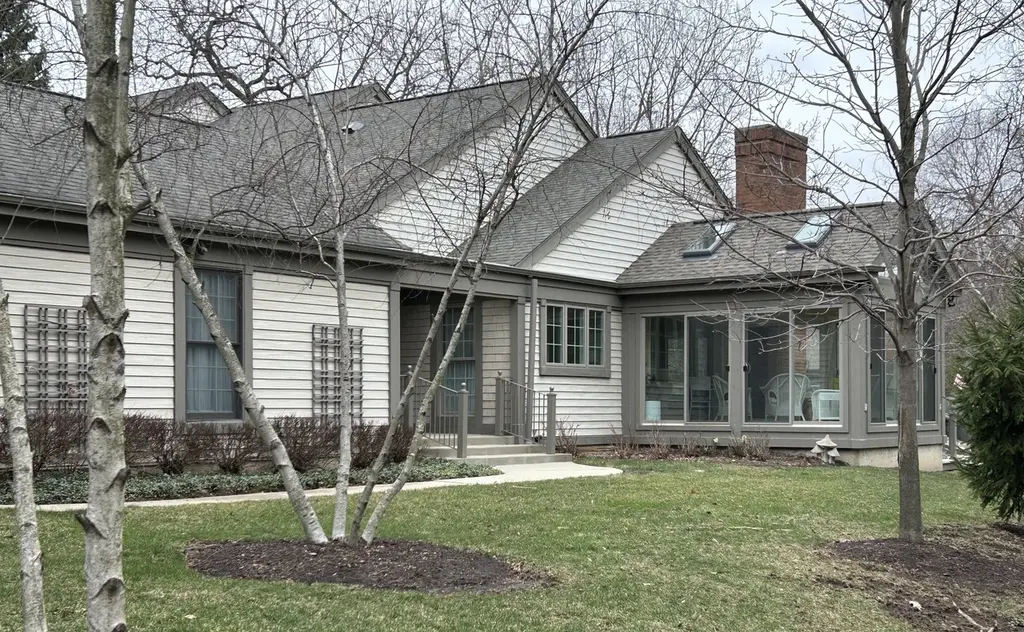
12 Warrington Dr · Lake Bluff, IL
Flood risk 1/10 · Minimal
- FEMA flood zone
- X (unshaded)
- Chance of flooding over 30 yrs
- 0.0%
- Est. flood insurance / yr
- $473 – $860
Fire risk 1/10 · Minimal
- Est. fire insurance / yr
- $804 – $1,492
Heat risk 2/10 · Minimal
- Hot days now (above 98°F)
- 7 days/yr
- Hot days in 30 yrs
- 14 days/yr
Wind risk 2/10 · Minimal
- Chance of severe wind over 30 yrs
- —
Air-quality risk 4/10 · Minor
- Unhealthy air days now
- 4 days/yr
- Unhealthy air days in 30 yrs
- 5 days/yr
Risk factors via First Street. Map © Google.
Why this score? — see what drove the F grade
The composite is a weighted blend of 9 inputs, each scored 0–100. Each bar is that input's sub-score; the figure is the points it added to the 100-point composite (weight × sub-score).
- Schools +6.6/10.0
- Livability +4.1/5.0
- Rent growth +2.5/5.0
- Condition / age +2.5/5.0
- Cash flow +0.0/30.0
- 1% rule +0.0/10.0
- DSCR +0.0/10.0
- ARV discount +0.0/15.0
- Appreciation +0.0/10.0
$899,000
🖨 Deal sheet (PDF) 📄 Offer letter ✓ Due diligence
Listing remarks
Welcome to your new sanctuary. This refined unit has been meticulously renovated over time, transforming it into a magnificent open space that offers expansive views from virtually every angle. The scenic pond can be observed from the primary bedroom, kitchen, family room, enclosed porch, and dining room. This residence boasts numerous features designed for effortless living. Highlights include a spacious kitchen equipped with a center island, a breakfast bar, and abundant storage. The main level hosts the primary suite, which overlooks the deck and features an updated full bathroom and a walk-in closet. The main level den, complete with a charming bay window, is versatile and can serve as
Key facts
- Walk-in closet
- Spacious kitchen
- Abundant storage
Tags
Property features AI
Finance
- Other: Two-unit building; Approximately 1,024 finished square feet (total finished/unfinished reported); Not currently leased; Subdivision: Armour Woods
- HOA & community: Quarterly association fee; Association covers insurance and lawn care; Self-managed association; Pets allowed (cats and dogs); large maximum pet weight permitted
Exterior
- Parking: Attached garage (2 spaces); 2 total parking spaces
- Utilities: Water: Lake Michigan and public supply; Sewer: Public sewer and storm sewer; Electric: Circuit breakers
- Home design: Attached single (1/2 duplex); Entry level: 1; Fee simple ownership with HOA; Rehab completed in 2015
- Construction: Frame construction; Asphalt roof; Approximately 31-40 years old; Below-grade finished area (partially finished basement)
- Exterior features: Partially finished basement; Enclosed heated porch; Combined dining and family room; Lake Michigan access/view (waterfront); School bus and commuter train access; close to interstate
Interior
- Kitchen: Eating area with breakfast bar; Island; Custom cabinetry; Granite counters; Updated kitchen; Gas cooktop; Range; Range hood; Microwave; Dishwasher; Refrigerator; Disposal; Stainless steel appliances
- Bedrooms: 3 bedrooms total; Master bedroom on main level; Second-level bedrooms with carpeted floors
- Flooring: Hardwood flooring in main living areas and master bedroom; Carpet in upstairs bedrooms; Tile in enclosed heated porch
- Bathrooms: 2 full bathrooms; 1 half bathroom; Master bedroom includes a full bath
- Heating & cooling: Natural gas forced-air heating; Central air conditioning
- Interior features: First-floor bedroom; First-floor full bath; Storage; Walk-in closet(s); Open floor plan; Granite counters; Skylight(s)
- Laundry & utility: Main-level laundry; Washer hookup in unit
Neighborhood map
What this means for you Summary
Snapshot
- This is a 3-bed/2.5-bath single-family listed at $899k.
Deal economics
- At list price, monthly cash flow is $-4k ($-54k/yr) — negative.
- To cash-flow at today's rent, offer at most $220k (75.5% below list).
- To meet the 1% rule (rent ≥ 1% of price), the offer needs to be $220k (75.6% below list).
- Recommended offer: $220k (75.6% below list) — sets the bar for 1% rule.
- Cap rate 0.3% vs local median 3.0% in Lake Bluff — below-typical yield; the buyer is paying a premium for something (appreciation thesis, condition, location) that the cap rate doesn't capture.
Location & tenants
- Location reads 82/100 on livability (#76 in IL, #1,225 nationally) — a professional / high-income tenant draw. Strengths: crime A+, employment A+, housing A+; Watch: amenities F, cost of living F.
- Lake Forest Chsd 115 (suburban): math 66% / reading 68% proficiency, ranked #9 of 620 in IL (top 2%) — acceptable for families but not a draw, mixed tenant base, ~2y average lease.
- Zoned schools: Lake Bluff Elem Sch (math 70% / reading 50%, grade B-, #68 of 2,056 statewide, top 4%, 570 students, 0% FRL); Lake Bluff Middle School (math 50% / reading 50%, grade C, #51 of 665 statewide, top 9%, 288 students, 0% FRL); Lake Forest High School (math 66% / reading 68%, grade B, #10 of 693 statewide, top 1%, 1,438 students, 0% FRL).
- Market conditions: 37 active listings in the ZIP; 1 comparable units currently listed for rent nearby; 948 units permitted in Lake County in 2024 (424 in 5+ unit buildings).
Forward outlook
- Local home prices are declining (-3.0%/yr); year-one equity from $6k of loan paydown is wiped out by about $27k of value loss. Plan a longer hold.
- Lake County population projected to shrink 8% by 2050 — rents likely to lag national; underwrite the cash flow, not the appreciation.
Negotiation context
- It's been on market 82 days — a 6% lower offer ($845k) is reasonable based on typical stale-listing flexibility.
- 3 sale attempts since 14y ago; this cycle's ask has dropped $50k (5%) from the opening price — seller is motivated, your offer sets the floor, not the list.
- Current owner paid $290k; list at $899k implies a 210% gain — meaningful room to come down on a strong offer.
Questions for the listing agent
- What do current leases actually rent for vs. the listed asking? Can we see a recent rent roll and the last 12 months of T-12 income?
- It's been on market 82 days. Have you received any prior offers? Is the seller open to a 76% concession, seller financing, or rate buy-down credit?
- What does the HOA fee cover, when was the last increase, and are there any pending special assessments or reserve-fund shortfalls?
- Why hasn't it sold? Are there any deal-killer items the seller is aware of (foundation, flood, title, zoning, code violations)?
- Is there a deadline driving the sale (1031 exchange, divorce, estate, relocation)? That informs how much negotiation room exists.
- Schools are A-rated — typically a magnet for longer-tenancy family renters. What's the average tenant stay here, and is there a school-zone premium baked into asking?
- The area grade is low — what's the realistic commute time and amenity access for the typical tenant pool here? Any planned neighborhood developments (good or bad) we should know about?
- What's the average days-on-market for RENTAL listings here right now (not sales)? A rising rental-DOM trend means longer vacancies and softer asking-rent achievability than the comps imply.
- What's the recent tenant-quality profile in this submarket — average credit score on applications, eviction rate, late-payment / NSF rate, and stable-employment percentage? A property-management company in the area should have these aggregated.
- How much new for-sale + rental construction is in the pipeline within 1–3 miles? Heavy new supply typically softens prices + rents 12–24 months out; constrained supply supports both.
Investment metrics
- 1% rule
- 0.24% ✗
- Cap rate
- 0.32%
- Cash-on-cash
- -21.32%
- DSCR
- 0.05
- GRM
- 34.1
CMA / ARV
- ARV (on-the-fly)
- $634,490
- Comps found
- 12
Show comp detail 12 sales within ~0.75 mi
| Address | Dist | Beds/Ba | Sqft | Sold | Price | $/sf | Match |
|---|---|---|---|---|---|---|---|
| 230 W Center Ave | 0.75mi | 3/2.5 | 1,896 (+0%) | 0mo | $824,000 | $435 | 65 |
| 315 W Washington Ave | 0.48mi | 2/2.0 (-1) | 1,910 (+1%) | 8mo | $630,000 | $330 | 62 |
| 320 Signe Ct | 0.21mi | 4/2.5 (+1) | 2,140 (+13%) | 12mo | $745,000 | $348 | 53 |
| 228 Juneway Ter | 0.52mi | 3/2.5 | 2,153 (+14%) | 2mo | $585,000 | $272 | 51 |
| 663 Mawman Ave | 0.71mi | 3/2.0 | 1,859 (-2%) | 17mo | $450,000 | $242 | 48 |
| 231 Bayshore Dr | 0.41mi | 3/1.0 | 1,686 (-11%) | 10mo | $355,000 | $211 | 48 |
| 239 Buckminster Ct | 0.38mi | 3/2.0 | 2,141 (+13%) | 13mo | $825,000 | $385 | 48 |
| 665 Pine Ct | 0.59mi | 3/2.0 | 1,749 (-8%) | 15mo | $607,500 | $347 | 45 |
| 650 Garfield Ave | 0.61mi | 3/2.0 | 1,780 (-6%) | 20mo | $545,000 | $306 | 43 |
| 200 Melvin Dr | 0.42mi | 4/2.0 (+1) | 2,058 (+9%) | 22mo | $525,000 | $255 | 41 |
| 660 Lincoln Ave | 0.60mi | 4/2.5 (+1) | 2,137 (+13%) | 12mo | $716,000 | $335 | 36 |
| 14 E Woodland Rd | 0.74mi | 2/2.0 (-1) | 1,698 (-10%) | 9mo | $596,000 | $351 | 34 |
Match score weights: distance 35% · size 25% · config 20% · recency 20%. Top-matched comps best support the ARV.
Projected returns pro-forma
-3.0% appreciation · 3.0% rent growth · sell at horizon
- IRR
- -61.4%
- Equity multiple
- -0.71×
- Total profit
- $-430,484
- Equity at exit
- $134,044
- IRR
- —
- Equity multiple
- -1.95×
- Total profit
- $-741,512
- Equity at exit
- $77,729
Cash invested: $251,720 (down + closing). Projections, not guarantees.
Landlord ↔ Tenant lean methodology
- Overall (STATE)
- 43 Moderately Tenant-Leaning
- State Illinois
- 43 Moderately Tenant-Leaning · D+7
- County
- — inherits STATE
- City
- — inherits STATE
ZIP-level market 60044
- Active inventory
- 37
- Price-to-rent
- 34.1×
Monthly cashflow live
- Estimated rent
- $2,195 medium interval (Pro) →
- Mortgage (P&I)
- −$4,714
- Tax from tax record
- −$916 /mo · $10,994/yr
- Insurance
- −$375
- HOA
- −$201
- Vacancy / Maint / Mgmt
- −$461
- Net cashflow
- $-4,472
Break-even live
Sensitivity live
| Price | -10% $-3,963 | -5% $-4,218 | +0% $-4,472 | +5% $-4,727 | +10% $-4,981 |
|---|---|---|---|---|---|
| Rent | -10% $-4,646 | -5% $-4,559 | +0% $-4,472 | +5% $-4,385 | +10% $-4,299 |
| Rate | -1.0pp $-4,019 | -0.5pp $-4,244 | base $-4,472 | +0.5pp $-4,705 | +1.0pp $-4,942 |
UW: 25.0% down · 7.5% · 30yr · 1.5% tax · 5.0% vac · 8.0% maint · 8.0% mgmt
Financing live
Cash to close
- Down payment
- $224,750
- Closing costs
- $26,970
- Reserves months
- —
- Total cash needed
- —
Loan-product check · same deal, 3 products live
Conventional
25% down · 7.5% · 30yr
- Down + closing
- —
- Monthly P&I
- —
- Monthly cashflow
- —
- DSCR
- —
- Eligible?
- —
Personal DTI + credit; lowest rate.
DSCR
20% down · 8.5% · 30yr
- Down + closing
- —
- Monthly P&I
- —
- Monthly cashflow
- —
- DSCR
- —
- Eligible?
- —
No personal income docs; deal must DSCR.
Hard money
10% down · 12.0% · 12mo
- Down + closing
- —
- Monthly P&I
- —
- Monthly cashflow
- —
- DSCR
- —
- Eligible?
- —
Short-term bridge; refi at stabilization.
Rent comps 1 comps
| Address | Beds | Baths | Sqft | Rent | $/sqft | DOM | Units | Dist |
|---|---|---|---|---|---|---|---|---|
| 627 Smith Ave Lake Bluff, IL | 3.0 | 1.5 | 1456 | $2,195 | $1.51 | 5d | 1 | 1.04mi |
HOA detail
- Monthly dues
- $201 · $2,412/yr
Listing history 26 events
-
2026-06-21days on market $899,000 Active 82 DOM
-
2026-06-18days on market $899,000 Active 79 DOM
-
2026-06-17days on market $899,000 Active 78 DOM
-
2026-06-16days on market $899,000 Active 77 DOM
-
2026-06-15days on market $899,000 Active 76 DOM
-
2026-06-13days on market $899,000 Active 74 DOM
-
2026-06-13days on market $899,000 Active 73 DOM
-
2026-06-09days on market $899,000 Active 70 DOM
-
2026-06-08days on market $899,000 Active 69 DOM
-
2026-06-07days on market $899,000 Active 68 DOM
-
2026-06-04days on market $899,000 Active 65 DOM
-
2026-06-03days on market $899,000 Active 64 DOM
-
2026-06-02days on market $899,000 Active 63 DOM
-
2026-06-01days on market $899,000 Active 62 DOM
-
2026-05-31days on market $899,000 Active 61 DOM
-
2026-04-27price $899,000
-
2026-04-11status Active
-
2026-04-06historical Contingent - Continue to Show
-
2026-03-31$949,000 Active
-
2012-09-27soldstatus $290,000 Closed Sale
-
2012-09-11historical Contingent
-
2012-08-21price $315,000 Price Change
-
2012-06-13$349,000 New
-
1998-05-27soldstatus $345,000
-
1996-09-09soldstatus $335,000
-
1988-11-01soldstatus $315,000
ⓘ Source: listings_history table (triggers on properties + properties_extension) + one-shot
backfill from property_details.listing_events for pre-trigger history.
Tax reassessment forecast IL · Partial reset (capped growth)
- Current annual tax
- $10,994 · $916/mo
- Projected year-2 tax
- $15,701 · $1,308/mo
- Expected delta
- +$4,706/yr (+$392/mo · 42.8%)
ⓘ Screening estimate from a state-policy table — verify with the county assessor before closing.
Climate risk First Street
- Flood 1/10 Low FEMA zone X (unshaded) · 0% chance over 30 yrs
- Wildfire 1/10 Low
- Heat 2/10 Low 7 d/yr ≥98°F today · 14 d/yr by 30 yrs out
- Wind 2/10 Low
- Air quality 4/10 Moderate 4 unhealthy d/yr today · 5 by 30 yrs out
Nearby sold comps map
Loading sold comps map…
Walkable amenities ~0.75 mi
Loading nearby amenities…
Taxation est. · year 1
- Rental income
- $26,340
- − Mortgage interest
- −$50,358
- − Property taxes
- −$10,994
- − Insurance
- −$4,495
- − Repairs & maintenance
- −$2,107
- − Management
- −$2,107
- − HOA
- −$2,412
- − Depreciation
- −$26,153
- Taxable loss
- −$72,287
- Est. tax savings @ 24.0%
- +$17,349
- After-tax cash flow
- $-36,318/yr
For passive investors: Depreciation is non-cash, so a rental often shows a tax loss while cash-flowing — sheltering income. Rental losses are passive: they offset passive income freely, and up to $25,000/yr can offset ordinary (W-2) income if you actively participate and your MAGI is under $100k (phasing out to $0 by $150k); unused losses carry forward. On sale, claimed depreciation is recaptured at up to 25%, and gains may owe capital-gains tax (a 1031 exchange can defer both). Figures are a year-1 estimate at your 24.0% rate — not tax advice; consult a CPA.
Schools (NCES district)
- District
- Lake Forest Chsd 115
- NCES district ID
- 1721780
- Math proficiency
- 66% ▼ -9.00%
- Reading proficiency
- 68% ▼ -14.00%
- Median HH income
- $147,281
- Composite
- 66.18/100
- National rank
- #433
- State rank
- #9 of 620 in IL
Livability — Lake Bluff
- Score
- 82/100
- State rank
- #76
- US rank
- #1225
Category grades
Schools grade is shown separately in the Schools card above.
Census & demographics
- Census place
- Lake Bluff, IL
- City population
- 10,289
- Population (ZIP)
- 10,289
Population outlook (Lake County) Hauer SSP2
- Today (2025)
- 700,217 people
- By 2030
- 693,290 · -1.0%
- By 2040
- 673,588 · -3.8%
- By 2050
- 643,556 · -8.1%
- By 2075
- 562,792 · -19.6%
- By 2100
- 457,715 · -34.6%
Race, ethnicity, and origin ACS 2023
- Neighborhood character
- Predominantly White (76%)
- Race & ethnicity
- White 76% Hispanic / Latino 10% Asian 9% Two or more races 9% Black 2%
- Hispanic origin (detail)
- Mexican 4% Puerto Rican 4%
- Common ancestry
- Romanian 5% Slovak 3% Lithuanian 2%
- Foreign-born
- 16% · Canada, China, South Korea
- Languages at home
- 78% English-only · Spanish 7% Other Indo-European 5% Chinese 3%
Political lean MEDSL · Lake
- 2024 margin
- Strong D (+20.8) · D 59.7% · R 38.9% · Other 1.4%
- 2008→2024 swing
- +1.1pp toward D · 2008: 19.6pp · 2024: 20.8pp
- All cycles
- 2024: D+20.8 2020: D+24.1 2016: D+20.3 2012: D+8.1 2008: D+19.6
Not yet ingested
- Civics
- —
Market trends
- HPI YoY
- ▼ -189.28%
- Current HPI
- 206.2806
- Rent YoY
- —
- Metro
- —
- State GDP YoY
- ▲ 1.59%
- F500 in state
- 60
Industry mix (Fortune 500 HQ in IL)
| Industry | F500 HQs | Revenue |
|---|---|---|
| Insurance | 4 | $201B |
|
||
| Consumer Goods | 4 | $87B |
|
||
| Industrial Machinery | 3 | $64B |
|
||
| Healthcare | 2 | $55B |
|
||
| Retail / Pharmacy | 1 | $148B |
|
||
| Agriculture / Food | 1 | $86B |
|
||
Price history
+185.4% since first listed11 events — show timeline
- 2026-04-27 Price Changed $899,000 MRED as Distributed by MLS Grid
- 2026-04-11 Relisted — MRED as Distributed by MLS Grid
- 2026-04-06 Contingent — MRED as Distributed by MLS Grid
- 2026-03-31 Listed $949,000 MRED as Distributed by MLS Grid
- 2012-09-27 Sold (MLS) $290,000 MRED as Distributed by MLS Grid
- 2012-09-11 Contingent — MRED as Distributed by MLS Grid
- 2012-08-21 Price Changed $315,000 MRED as Distributed by MLS Grid
- 2012-06-13 Listed $349,000 MRED as Distributed by MLS Grid
- 1998-05-27 Sold (Public Records) $345,000 Public Records
- 1996-09-09 Sold (Public Records) $335,000 Public Records
- 1988-11-01 Sold (Public Records) $315,000 Public Records
Property tax history
+1.3%/yrLatest (2024): $10,994 · +3.3% YoY. Source: county tax records.
Cash-flow waterfall
monthlySold comps — $/sqft
last 12 mo · ≤1 miLoading sold comps…