19635 E 800th St · Sciota, IL
Flood risk 1/10 · Minimal
- FEMA flood zone
- X
- Chance of flooding over 30 yrs
- 0.0%
- Est. flood insurance / yr
- $507 – $1,088
Fire risk 1/10 · Minimal
- Est. fire insurance / yr
- $804 – $1,492
Heat risk 3/10 · Minor
- Hot days now (above 106°F)
- 7 days/yr
- Hot days in 30 yrs
- 17 days/yr
Wind risk 2/10 · Minimal
- Chance of severe wind over 30 yrs
- 1.0%
Air-quality risk 2/10 · Minimal
- Unhealthy air days now
- 0 days/yr
- Unhealthy air days in 30 yrs
- 1 days/yr
Risk factors via First Street. Map © Google.
Why this score? — see what drove the D- grade
The composite is a weighted blend of 9 inputs, each scored 0–100. Each bar is that input's sub-score; the figure is the points it added to the 100-point composite (weight × sub-score).
- Cash flow +9.3/30.0
- ARV discount +7.5/15.0
- Appreciation +5.0/10.0
- Livability +3.5/5.0
- DSCR +2.6/10.0
- Rent growth +2.5/5.0
- Condition / age +2.5/5.0
- 1% rule +2.0/10.0
- Schools +1.9/10.0
$149,999
🖨 Deal sheet (PDF) 📄 Offer letter ✓ Due diligence
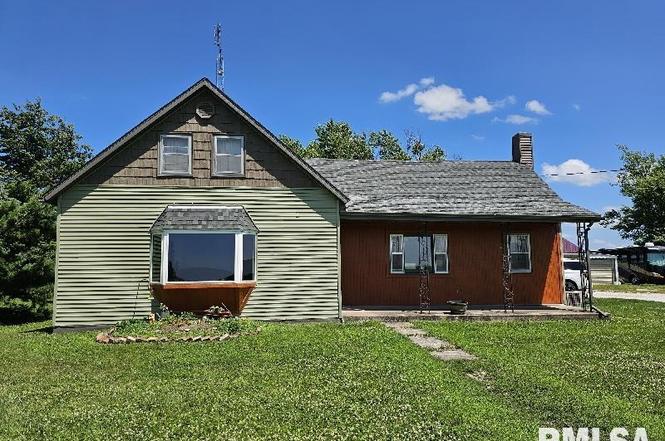
Listing remarks
Spacious Country Property with Room to Live, Work & Play – Almost 2 Acres! Welcome to your own private retreat! Sitting on nearly 2 acres, this versatile property is packed with features that make country living easy and enjoyable. Outside, you'll find a 30x40 metal building with 12-foot side walls and a 12-foot roll-up door, perfect for storage, or a workshop. There’s also a 4-car garage, shed, greenhouse, and a chicken coop—ideal for anyone interested in homesteading or hobbies. Enjoy summer days in the above-ground pool, or host family and friends on the spacious covered deck that overlooks the property—perfect for entertaining or relaxing in peace. Inside,
Key facts
- 1.85 acre lot
- 4 garage spots
- Pool
Neighborhood map
What this means for you Summary
Snapshot
- This is a 3-bed/1.0-bath single-family listed at $150k.
Deal economics
- At list price, monthly cash flow is $-111 ($-1k/yr) — negative.
- To cash-flow at today's rent, offer at most $130k (13.0% below list).
- To meet the 1% rule (rent ≥ 1% of price), the offer needs to be $105k (29.9% below list).
- Recommended offer: $105k (29.9% below list) — sets the bar for 1% rule.
Location & tenants
- Location reads 70/100 on livability (#370 in IL) — a middle-class / working-renter tenant base. Strengths: employment A+, cost of living A+, housing A+; Watch: crime C-, health & safety C-, amenities F.
- West Prairie CUSD 103 (rural): math 20% / reading 23% proficiency, ranked #408 of 620 in IL (top 66%) — low school quality limits family demand, transient renter base, plan for 1-2y turnover.
- Zoned schools: West Prairie North Elementary Sch (math 34% / reading 15%, grade F, #844 of 2,056 statewide, top 41%, 174 students, 0% FRL); West Prairie Junior High School (math 8% / reading 17%, grade F, #550 of 665 statewide, top 84%, 99 students, 0% FRL); West Prairie Senior High School (math 10% / reading 30%, grade F, #357 of 693 statewide, top 54%, 162 students, 0% FRL) — zoned schools average 0% FRL vs 43% district-wide (43 pts lower); this property's tenant base skews higher-income than the district average.
- Market conditions: 2 active listings in the ZIP.
Forward outlook
- In year one you build about $6k of equity ($1k loan paydown + $4k appreciation (3.0% local appreciation)).
- By year 7, paydown + projected appreciation supports a ~$35k cash-out refi (75% LTV) — recoverable capital for the next deal without selling this one.
Negotiation context
- It's been on market 272 days — a 12% lower offer ($132k) is reasonable based on typical stale-listing flexibility.
- 2 sale attempts; this cycle's ask has dropped $30k (17%) from the opening price — seller is motivated, your offer sets the floor, not the list.
Risks & watch-outs
- Watch-outs: built in 1930 — expect roof / HVAC / electrical / plumbing capex.
Questions for the listing agent
- What do current leases actually rent for vs. the listed asking? Can we see a recent rent roll and the last 12 months of T-12 income?
- It's been on market 272 days. Have you received any prior offers? Is the seller open to a 30% concession, seller financing, or rate buy-down credit?
- Built in 1930 — when were the roof, HVAC, electrical panel, plumbing, and water heater last replaced?
- Why hasn't it sold? Are there any deal-killer items the seller is aware of (foundation, flood, title, zoning, code violations)?
- Is there a deadline driving the sale (1031 exchange, divorce, estate, relocation)? That informs how much negotiation room exists.
- Schools are D-rated, which usually means shorter tenancies and higher turnover. Who's the typical renter profile here, and what's been the actual vacancy rate?
- The area grade is low — what's the realistic commute time and amenity access for the typical tenant pool here? Any planned neighborhood developments (good or bad) we should know about?
- What's the average days-on-market for RENTAL listings here right now (not sales)? A rising rental-DOM trend means longer vacancies and softer asking-rent achievability than the comps imply.
- What's the recent tenant-quality profile in this submarket — average credit score on applications, eviction rate, late-payment / NSF rate, and stable-employment percentage? A property-management company in the area should have these aggregated.
- How much new for-sale + rental construction is in the pipeline within 1–3 miles? Heavy new supply typically softens prices + rents 12–24 months out; constrained supply supports both.
Investment metrics
- 1% rule
- 0.70% ✗
- Cap rate
- 5.41%
- Cash-on-cash
- -3.16%
- DSCR
- 0.86
- GRM
- 11.9
CMA / ARV
No comps found within radius.
Projected returns pro-forma
3.0% appreciation · 3.0% rent growth · sell at horizon
- IRR
- 4.5%
- Equity multiple
- 1.26×
- Total profit
- $10,976
- Equity at exit
- $67,446
- IRR
- 7.7%
- Equity multiple
- 2.16×
- Total profit
- $48,919
- Equity at exit
- $103,942
Cash invested: $42,000 (down + closing). Projections, not guarantees.
Landlord ↔ Tenant lean methodology
- Overall (STATE)
- 43 Moderately Tenant-Leaning
- State Illinois
- 43 Moderately Tenant-Leaning · D+7
- County
- — inherits STATE
- City
- — inherits STATE
ZIP-level market 61475
- Active inventory
- 2
- Price-to-rent
- 11.9×
Monthly cashflow live
- Estimated rent
- $1,051 medium interval (Pro) →
- Mortgage (P&I)
- −$787
- Tax from tax record
- −$92 /mo · $1,101/yr
- Insurance
- −$62
- HOA
- −$0
- Vacancy / Maint / Mgmt
- −$221
- Net cashflow
- $-111
Break-even live
Sensitivity live
| Price | -10% $-26 | -5% $-68 | +0% $-111 | +5% $-153 | +10% $-196 |
|---|---|---|---|---|---|
| Rent | -10% $-194 | -5% $-152 | +0% $-111 | +5% $-69 | +10% $-28 |
| Rate | -1.0pp $-35 | -0.5pp $-73 | base $-111 | +0.5pp $-150 | +1.0pp $-189 |
UW: 25.0% down · 7.5% · 30yr · 1.5% tax · 5.0% vac · 8.0% maint · 8.0% mgmt
Financing live
Cash to close
- Down payment
- $37,500
- Closing costs
- $4,500
- Reserves months
- —
- Total cash needed
- —
Loan-product check · same deal, 3 products live
Conventional
25% down · 7.5% · 30yr
- Down + closing
- —
- Monthly P&I
- —
- Monthly cashflow
- —
- DSCR
- —
- Eligible?
- —
Personal DTI + credit; lowest rate.
DSCR
20% down · 8.5% · 30yr
- Down + closing
- —
- Monthly P&I
- —
- Monthly cashflow
- —
- DSCR
- —
- Eligible?
- —
No personal income docs; deal must DSCR.
Hard money
10% down · 12.0% · 12mo
- Down + closing
- —
- Monthly P&I
- —
- Monthly cashflow
- —
- DSCR
- —
- Eligible?
- —
Short-term bridge; refi at stabilization.
Listing history 7 events
-
2026-04-02status Pending
-
2026-02-06price $149,999
-
2026-01-02status Active
-
2025-12-24historical
-
2025-09-04price $169,000
-
2025-08-10price $170,000
-
2025-06-23$180,000 Active
ⓘ Source: listings_history table (triggers on properties + properties_extension) + one-shot
backfill from property_details.listing_events for pre-trigger history.
Tax reassessment forecast IL · Partial reset (capped growth)
- Current annual tax
- $1,101 · $92/mo
- Projected year-2 tax
- $2,253 · $188/mo
- Expected delta
- +$1,152/yr (+$96/mo · 104.6%)
ⓘ Screening estimate from a state-policy table — verify with the county assessor before closing.
Climate risk First Street
- Flood 1/10 Low FEMA zone X · 0% chance over 30 yrs
- Wildfire 1/10 Low
- Heat 3/10 Moderate 7 d/yr ≥106°F today · 17 d/yr by 30 yrs out
- Wind 2/10 Low 100% chance of damaging wind over 30 yrs
- Air quality 2/10 Low 0 unhealthy d/yr today · 1 by 30 yrs out
Nearby sold comps map
Loading sold comps map…
Walkable amenities ~0.75 mi
Loading nearby amenities…
Taxation est. · year 1
- Rental income
- $12,610
- − Mortgage interest
- −$8,402
- − Property taxes
- −$1,101
- − Insurance
- −$750
- − Repairs & maintenance
- −$1,009
- − Management
- −$1,009
- − Depreciation
- −$4,364
- Taxable loss
- −$4,024
- Est. tax savings @ 24.0%
- +$966
- After-tax cash flow
- $-363/yr
For passive investors: Depreciation is non-cash, so a rental often shows a tax loss while cash-flowing — sheltering income. Rental losses are passive: they offset passive income freely, and up to $25,000/yr can offset ordinary (W-2) income if you actively participate and your MAGI is under $100k (phasing out to $0 by $150k); unused losses carry forward. On sale, claimed depreciation is recaptured at up to 25%, and gains may owe capital-gains tax (a 1031 exchange can defer both). Figures are a year-1 estimate at your 24.0% rate — not tax advice; consult a CPA.
Schools (NCES district)
- District
- West Prairie CUSD 103
- NCES district ID
- 1700314
- Math proficiency
- 20% ▬ 0.00%
- Reading proficiency
- 23% ▼ -8.00%
- Median HH income
- $44,721
- Composite
- 18.65/100
- National rank
- #8890
- State rank
- #408 of 620 in IL
Livability — Sciota
- Score
- 70/100
- State rank
- #370
- US rank
- #7710
Category grades
Schools grade is shown separately in the Schools card above.
Census & demographics
- Population (ZIP)
- 211
Population outlook (McDonough County) Hauer SSP2
- Today (2025)
- 33,242 people
- By 2030
- 33,318 · +0.2%
- By 2040
- 33,520 · +0.8%
- By 2050
- 33,630 · +1.2%
- By 2075
- 33,657 · +1.2%
- By 2100
- 33,127 · -0.3%
Race, ethnicity, and origin ACS 2023
- Neighborhood character
- Predominantly White (100%)
- Race & ethnicity
- White 100%
- Common ancestry
- Slovak 7% Iranian 4% Portuguese 4%
Political lean MEDSL · McDonough
- 2024 margin
- R (+18.9) · D 39.7% · R 58.5% · Other 1.8%
- 2008→2024 swing
- -24.4pp toward R · 2008: 5.6pp · 2024: -18.9pp
- All cycles
- 2024: R+18.9 2020: R+16.6 2016: R+11.7 2012: R+1.5 2008: D+5.6
Not yet ingested
- Civics
- —
Market trends
- HPI YoY
- —
- Current HPI
- —
- Rent YoY
- —
- Metro
- —
- State GDP YoY
- ▲ 1.59%
- F500 in state
- 60
Industry mix (Fortune 500 HQ in IL)
| Industry | F500 HQs | Revenue |
|---|---|---|
| Insurance | 4 | $201B |
|
||
| Consumer Goods | 4 | $87B |
|
||
| Industrial Machinery | 3 | $64B |
|
||
| Healthcare | 2 | $55B |
|
||
| Retail / Pharmacy | 1 | $148B |
|
||
| Agriculture / Food | 1 | $86B |
|
||
Price history
-16.7% since first listed7 events — show timeline
- 2026-04-02 Pending — RMLSA as Distributed by MLS Grid
- 2026-02-06 Price Changed $149,999 RMLSA as Distributed by MLS Grid
- 2026-01-02 Relisted — RMLSA as Distributed by MLS Grid
- 2025-12-24 Listing Removed — RMLSA as Distributed by MLS Grid
- 2025-09-04 Price Changed $169,000 RMLSA as Distributed by MLS Grid
- 2025-08-10 Price Changed $170,000 RMLSA as Distributed by MLS Grid
- 2025-06-23 Listed $180,000 RMLSA as Distributed by MLS Grid
Property tax history
+23.7%/yrLatest (2024): $1,101 · +9.3% YoY. Source: county tax records.
Cash-flow waterfall
monthlySold comps — $/sqft
last 12 mo · ≤1 miLoading sold comps…