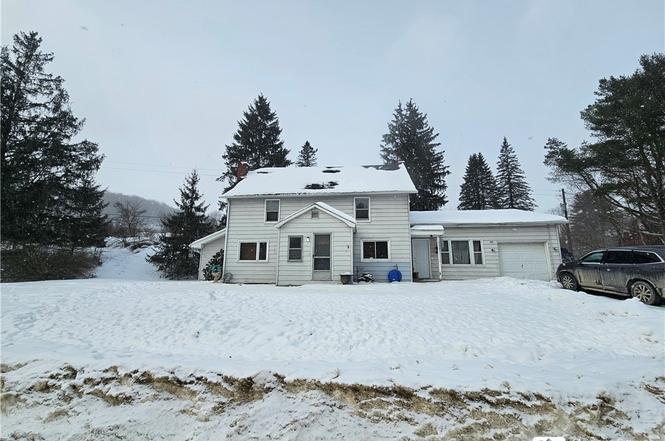
4449 Gile Hollow Rd · Weston Mills, NY
Flood risk 9/10 · Severe
- FEMA flood zone
- X
- Chance of flooding over 30 yrs
- 0.99%
- Est. flood insurance / yr
- $473 – $860
Fire risk 3/10 · Minor
- Est. fire insurance / yr
- $691 – $1,283
Heat risk 1/10 · Minimal
- Hot days now (above 90°F)
- 7 days/yr
- Hot days in 30 yrs
- 17 days/yr
Wind risk 1/10 · Minimal
- Chance of severe wind over 30 yrs
- —
Air-quality risk 1/10 · Minimal
- Unhealthy air days now
- 0 days/yr
- Unhealthy air days in 30 yrs
- 0 days/yr
Risk factors via First Street. Map © Google.
Why this score? — see what drove the D grade
The composite is a weighted blend of 9 inputs, each scored 0–100. Each bar is that input's sub-score; the figure is the points it added to the 100-point composite (weight × sub-score).
- Appreciation +9.2/10.0
- Cash flow +8.1/30.0
- ARV discount +7.5/15.0
- Schools +5.2/10.0
- Livability +3.2/5.0
- 1% rule +3.1/10.0
- Rent growth +2.5/5.0
- Condition / age +2.5/5.0
- DSCR +2.1/10.0
$159,000
🖨 Deal sheet (PDF) 📄 Offer letter ✓ Due diligence
Listing remarks
This spacious 4-bedroom, 2-bath home sits on a peaceful 4.41-acre lot in Hinsdale, offering the perfect blend of comfort, privacy, and room to roam. The main floor features a desirable first-floor layout with two bedrooms and two full bathrooms, including a primary suite complete with a walk-in closet, private full bath, and direct access to the backyard—ideal for enjoying quiet mornings or evening sunsets. The open living area flows into a bright kitchen with an island, making it great for everyday living and entertaining. Hardwood floors run throughout most of the home, adding warmth and character. Upstairs, you’ll find two additional bedrooms, perfect for family, guests, or h
Key facts
- Bright kitchen
- Primary suite
- Open living area
Tags
Neighborhood map
What this means for you Summary
Snapshot
- This is a 3-bed/2.0-bath single-family listed at $159k.
Deal economics
- At list price, monthly cash flow is $-211 ($-3k/yr) — negative.
- To cash-flow at today's rent, offer at most $122k (23.4% below list).
- To meet the 1% rule (rent ≥ 1% of price), the offer needs to be $128k (19.5% below list).
- Recommended offer: $122k (23.4% below list) — sets the bar for cash-flow.
Location & tenants
- Location reads 65/100 on livability (#667 in NY) — a middle-class / working-renter tenant base. Strengths: cost of living A+, housing A+, crime A; Watch: health & safety C-, schools F, amenities F.
- Hinsdale Central School District (town): math 60% / reading 59% proficiency, ranked #297 of 755 in NY (top 39%) — acceptable for families but not a draw, mixed tenant base, ~2y average lease.
- Market conditions: 18 active listings in the ZIP; 128 units permitted in Cattaraugus County in 2024 (21 in 5+ unit buildings).
Forward outlook
- In year one you build about $14k of equity ($1k loan paydown + $13k appreciation (8.3% local appreciation)).
- Cattaraugus County population projected at -28% by 2050 — secular population decline; favor cash flow + early exit over multi-decade hold.
- By year 3, paydown + projected appreciation supports a ~$36k cash-out refi (75% LTV) — recoverable capital for the next deal without selling this one.
Negotiation context
- It's been on market 45 days — a 3% lower offer ($154k) is reasonable based on typical stale-listing flexibility.
- 7 sale attempts since 13y ago with the ask held roughly flat each time — persistent listings suggest the price (not the market) is what's stuck; bring a comps-based counter.
- Current owner paid $94k; list at $159k implies a 69% gain — meaningful room to come down on a strong offer.
Risks & watch-outs
- Watch-outs: flood insurance adds $56/mo; built in 1900 — expect roof / HVAC / electrical / plumbing capex.
- Climate carrying-cost: severe flood risk — expect insurance premiums to compound above CPI over the hold.
Questions for the listing agent
- What do current leases actually rent for vs. the listed asking? Can we see a recent rent roll and the last 12 months of T-12 income?
- It's been on market 45 days. Have you received any prior offers? Is the seller open to a 23% concession, seller financing, or rate buy-down credit?
- Built in 1900 — when were the roof, HVAC, electrical panel, plumbing, and water heater last replaced?
- What's the actual annual flood-insurance premium (NFIP or private), and is the property in a SFHA with mandatory coverage?
- Is there a deadline driving the sale (1031 exchange, divorce, estate, relocation)? That informs how much negotiation room exists.
- Schools are F-rated, which usually means shorter tenancies and higher turnover. Who's the typical renter profile here, and what's been the actual vacancy rate?
- The area grade is low — what's the realistic commute time and amenity access for the typical tenant pool here? Any planned neighborhood developments (good or bad) we should know about?
- What's the average days-on-market for RENTAL listings here right now (not sales)? A rising rental-DOM trend means longer vacancies and softer asking-rent achievability than the comps imply.
- What's the recent tenant-quality profile in this submarket — average credit score on applications, eviction rate, late-payment / NSF rate, and stable-employment percentage? A property-management company in the area should have these aggregated.
- How much new for-sale + rental construction is in the pipeline within 1–3 miles? Heavy new supply typically softens prices + rents 12–24 months out; constrained supply supports both.
Investment metrics
- 1% rule
- 0.81% ✗
- Cap rate
- 5.12%
- Cash-on-cash
- -4.19%
- DSCR
- 0.81
- GRM
- 10.3
CMA / ARV
No comps found within radius.
Projected returns pro-forma
8.31% appreciation · 3.0% rent growth · sell at horizon
- IRR
- 16.5%
- Equity multiple
- 2.24×
- Total profit
- $55,320
- Equity at exit
- $124,165
- IRR
- 15.8%
- Equity multiple
- 4.84×
- Total profit
- $170,867
- Equity at exit
- $249,751
Cash invested: $44,520 (down + closing). Projections, not guarantees.
Landlord ↔ Tenant lean methodology
- Overall (STATE)
- 15 Strongly Tenant-Friendly
- State New York
- 15 Strongly Tenant-Friendly · D+10
- County
- — inherits STATE
- City
- — inherits STATE
ZIP-level market 14743
- Home prices YoY
- 2.6%
- Active inventory
- 18
- Price-to-rent
- 10.3×
Monthly cashflow live
- Estimated rent
- $1,280 medium interval (Pro) →
- Mortgage (P&I)
- −$834
- Tax from tax record
- −$267 /mo · $3,202/yr
- Insurance
- −$66
- Flood insurance flood zone
- −$56 /mo · $666/yr
- HOA
- −$0
- Vacancy / Maint / Mgmt
- −$269
- Net cashflow
- $-211
Break-even live
Sensitivity live
| Price | -10% $-121 | -5% $-166 | +0% $-211 | +5% $-256 | +10% $-301 |
|---|---|---|---|---|---|
| Rent | -10% $-312 | -5% $-262 | +0% $-211 | +5% $-160 | +10% $-110 |
| Rate | -1.0pp $-131 | -0.5pp $-171 | base $-211 | +0.5pp $-252 | +1.0pp $-294 |
UW: 25.0% down · 7.5% · 30yr · 1.5% tax · 5.0% vac · 8.0% maint · 8.0% mgmt
Financing live
Cash to close
- Down payment
- $39,750
- Closing costs
- $4,770
- Reserves months
- —
- Total cash needed
- —
Loan-product check · same deal, 3 products live
Conventional
25% down · 7.5% · 30yr
- Down + closing
- —
- Monthly P&I
- —
- Monthly cashflow
- —
- DSCR
- —
- Eligible?
- —
Personal DTI + credit; lowest rate.
DSCR
20% down · 8.5% · 30yr
- Down + closing
- —
- Monthly P&I
- —
- Monthly cashflow
- —
- DSCR
- —
- Eligible?
- —
No personal income docs; deal must DSCR.
Hard money
10% down · 12.0% · 12mo
- Down + closing
- —
- Monthly P&I
- —
- Monthly cashflow
- —
- DSCR
- —
- Eligible?
- —
Short-term bridge; refi at stabilization.
Listing history 24 events
-
2026-03-23status Pending
-
2026-03-06price $159,000
-
2026-02-06$165,000 Active
-
2025-10-21historical
-
2025-08-10price $159,900
-
2025-07-09price $174,900
-
2025-04-21$199,900 Active
-
2019-07-31historical
-
2018-09-05price $89,900
-
2018-06-15$94,900 Active
-
2017-07-19historical
-
2017-01-20$95,000 Active
-
2016-12-31historical
-
2016-08-31price $95,000
-
2016-05-06$88,500 Active
-
2016-05-01historical
-
2015-09-17price $89,900
-
2015-06-18price $93,000
-
2015-05-13$99,900 Active
-
2013-11-27soldstatus $93,810
-
2013-11-27soldstatus $93,810
-
2013-09-09$95,000
-
2007-09-13soldstatus $95,000
-
2007-02-09soldstatus $105,000
ⓘ Source: listings_history table (triggers on properties + properties_extension) + one-shot
backfill from property_details.listing_events for pre-trigger history.
Tax reassessment forecast NY · Partial reset (capped growth)
- Current annual tax
- $3,202 · $267/mo
- Projected year-2 tax
- $3,202 · $267/mo
- Expected delta
- $0/yr ($0/mo · 0.0%)
ⓘ Screening estimate from a state-policy table — verify with the county assessor before closing.
Climate risk First Street
- Flood 9/10 Extreme FEMA zone X · 99% chance over 30 yrs
- Wildfire 3/10 Moderate
- Heat 1/10 Low 7 d/yr ≥90°F today · 17 d/yr by 30 yrs out
- Wind 1/10 Low
- Air quality 1/10 Low 0 unhealthy d/yr today · 0 by 30 yrs out
Nearby sold comps map
Loading sold comps map…
Walkable amenities ~0.75 mi
Loading nearby amenities…
Taxation est. · year 1
- Rental income
- $15,363
- − Mortgage interest
- −$8,906
- − Property taxes
- −$3,202
- − Insurance
- −$1,462
- − Repairs & maintenance
- −$1,229
- − Management
- −$1,229
- − Depreciation
- −$4,625
- Taxable loss
- −$5,290
- Est. tax savings @ 24.0%
- +$1,270
- After-tax cash flow
- $-1,263/yr
For passive investors: Depreciation is non-cash, so a rental often shows a tax loss while cash-flowing — sheltering income. Rental losses are passive: they offset passive income freely, and up to $25,000/yr can offset ordinary (W-2) income if you actively participate and your MAGI is under $100k (phasing out to $0 by $150k); unused losses carry forward. On sale, claimed depreciation is recaptured at up to 25%, and gains may owe capital-gains tax (a 1031 exchange can defer both). Figures are a year-1 estimate at your 24.0% rate — not tax advice; consult a CPA.
Schools (NCES district)
- District
- Hinsdale Central School District
- NCES district ID
- 3614490
- Math proficiency
- 60% ▲ 1.00%
- Reading proficiency
- 59% ▬ 0.00%
- Median HH income
- $43,001
- Composite
- 51.63/100
- National rank
- #3630
- State rank
- #297 of 755 in NY
Livability — Weston Mills
- Score
- 65/100
- State rank
- #667
- US rank
- #12400
Category grades
Schools grade is shown separately in the Schools card above.
Census & demographics
- City population
- 95
- Population (ZIP)
- 2,095
Population outlook (Cattaraugus County) Hauer SSP2
- Today (2025)
- 71,623 people
- By 2030
- 67,751 · -5.4%
- By 2040
- 59,488 · -16.9%
- By 2050
- 51,601 · -28.0%
- By 2075
- 35,025 · -51.1%
- By 2100
- 21,243 · -70.3%
Race, ethnicity, and origin ACS 2023
- Neighborhood character
- Predominantly White (91%)
- Race & ethnicity
- White 91% Two or more races 9%
- Common ancestry
- Romanian 6% Lithuanian 2% Italian 2%
- Foreign-born
- 1% · Canada
Political lean MEDSL · Cattaraugus
- 2024 margin
- Solid R (+32.8) · D 33.6% · R 66.4%
- 2008→2024 swing
- -22.2pp toward R · 2008: -10.6pp · 2024: -32.8pp
- All cycles
- 2024: R+32.8 2020: R+29.5 2016: R+34.4 2012: R+13.4 2008: R+10.6
Not yet ingested
- Civics
- —
Market trends
- HPI YoY
- ▲ 8.31%
- Current HPI
- 321.4238
- Rent YoY
- —
- Metro
- —
- State GDP YoY
- ▲ 2.60%
- F500 in state
- 92
Industry mix (Fortune 500 HQ in NY)
| Industry | F500 HQs | Revenue |
|---|---|---|
| Financial Services | 10 | $950B |
|
||
| Consumer Goods | 9 | $162B |
|
||
| Insurance | 4 | $225B |
|
||
| Telecommunications | 2 | $144B |
|
||
| Pharmaceuticals | 2 | $112B |
|
||
| Media / Entertainment | 2 | $69B |
|
||
Price history
+51.4% since first listed24 events — show timeline
- 2026-03-23 Pending — UNYREIS
- 2026-03-06 Price Changed $159,000 UNYREIS
- 2026-02-06 Listed $165,000 UNYREIS
- 2025-10-21 Listing Removed — UNYREIS
- 2025-08-10 Price Changed $159,900 UNYREIS
- 2025-07-09 Price Changed $174,900 UNYREIS
- 2025-04-21 Listed $199,900 UNYREIS
- 2019-07-31 Listing Removed — WNYREIS
- 2018-09-05 Price Changed $89,900 WNYREIS
- 2018-06-15 Listed $94,900 WNYREIS
- 2017-07-19 Listing Removed — WNYREIS
- 2017-01-20 Listed $95,000 WNYREIS
- 2016-12-31 Listing Removed — WNYREIS
- 2016-08-31 Price Changed $95,000 WNYREIS
- 2016-05-06 Listed $88,500 WNYREIS
- 2016-05-01 Listing Removed — WNYREIS
- 2015-09-17 Price Changed $89,900 WNYREIS
- 2015-06-18 Price Changed $93,000 WNYREIS
- 2015-05-13 Listed $99,900 WNYREIS
- 2013-11-27 Sold (Public Records) $93,810 Public Records
- 2013-11-27 Sold (MLS) $93,810 WNYREIS
- 2013-09-09 Listed $95,000 WNYREIS
- 2007-09-13 Sold (Public Records) $95,000 Public Records
- 2007-02-09 Sold (Public Records) $105,000 Public Records
Property tax history
+0.1%/yrLatest (2025): $3,202 · +7.7% YoY. Source: county tax records.
Cash-flow waterfall
monthlySold comps — $/sqft
last 12 mo · ≤1 miLoading sold comps…