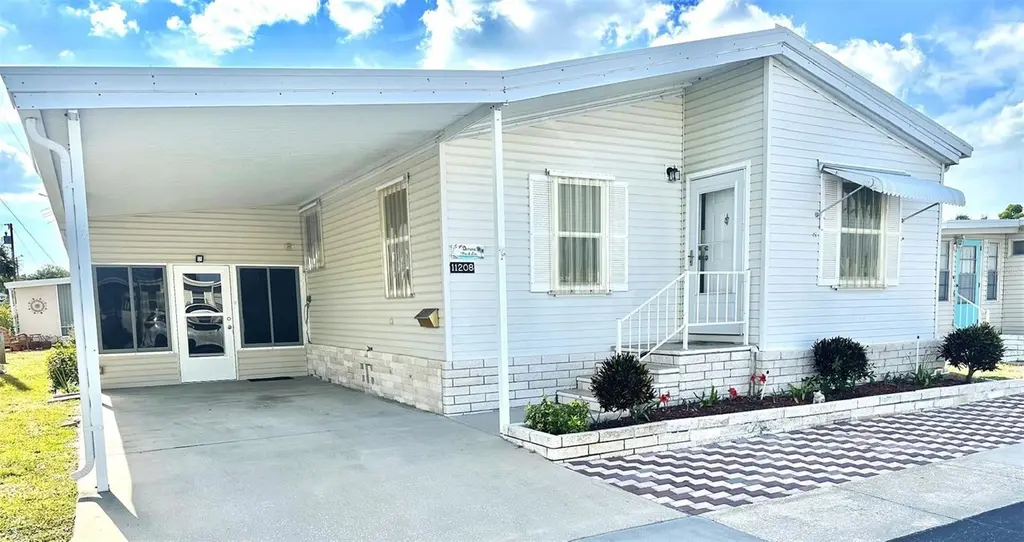
11208 101st St #115 · Largo, FL
Flood risk 9/10 · Severe
- FEMA flood zone
- AE
- Chance of flooding over 30 yrs
- 0.99%
- Est. flood insurance / yr
- $1,737 – $8,500
Fire risk 3/10 · Minor
- Est. fire insurance / yr
- $947 – $1,759
Heat risk 10/10 · Severe
- Hot days now (above 107°F)
- 6 days/yr
- Hot days in 30 yrs
- 21 days/yr
Wind risk 10/10 · Severe
- Chance of severe wind over 30 yrs
- 99.0%
Air-quality risk 3/10 · Minor
- Unhealthy air days now
- 2 days/yr
- Unhealthy air days in 30 yrs
- 3 days/yr
Risk factors via First Street. Map © Google.
Why this score? — see what drove the C grade
The composite is a weighted blend of 9 inputs, each scored 0–100. Each bar is that input's sub-score; the figure is the points it added to the 100-point composite (weight × sub-score).
- Cash flow +22.0/30.0
- ARV discount +8.2/15.0
- DSCR +7.0/10.0
- 1% rule +6.1/10.0
- Schools +4.3/10.0
- Livability +4.1/5.0
- Condition / age +2.5/5.0
- Rent growth +1.7/5.0
- Appreciation +0.0/10.0
$196,500
🖨 Deal sheet 📄 Offer letter ✓ Due diligence
Listing remarks
Hurry to see this Impressive 1997 2 bedroom, 2 bath, 1296 sq. ft. Palm Harbor Model Home, with all the upgrades! Inviting Glass enclosed 12x20 Florida Room, to enjoy your mornings! Spacious 12x12 Workshop/Shed, with updated Washer/Dryer! All attractive laminate flooring throughout, cathedral ceilings, newly added double pane tinted windows, and updated insulated metal Roof Over! All brand new Central Air/Heat Unit, with warranty! Convenient plexiglass storm window awnings included! Large Master bedroom ensuite, with built-in dressing table and private shower/commode area. All drywall interior, inside bonus room - optional laundry. So many upgrades to see! Large & Open Designer Kitchen
Key facts
- Updated washer dryer
- 2 parking spots
- Community pool
Tags
Property features AI
Finance
- Other: Property is homesteaded; Zoning: R-6
- Financial info: Total monthly HOA fees $212 (total annual fees $2,544); Lease restrictions apply
- HOA & community: HOA (Marlaine) with required monthly fee of $212; HOA amenities: Clubhouse, Laundry, Pool, Spa/Hot Tub, Shuffleboard court, Lobby key required; Association approval required; Senior community; Pets allowed (dogs and cats) with weight limit up to 30 lbs and number limit
Exterior
- Parking: Carport with 2 spaces
- Utilities: Public water; Public sewer; Electricity connected; Cable available; Water connected; Sewer connected
- Home design: Manufactured double-wide residential home; One level; Faces east
- Construction: Vinyl siding; Roof over; Crawlspace foundation
- Exterior features: Awning(s); Exterior lighting; Sidewalk; Storage; Paved lot
Interior
- Kitchen: Range; Refrigerator; Electric water heater
- Bedrooms: 2 bedrooms
- Flooring: Laminate
- Bathrooms: 2 full bathrooms
- Heating & cooling: Electric heating; Central air conditioning
- Interior features: Ceiling fans; Eat-in kitchen; Vaulted ceilings; Window treatments; Blinds
- Laundry & utility: Washer hookup; Dryer hookup; Electric dryer hookup
Neighborhood map
What this means for you Summary
Snapshot
- This is a 2-bed/2.0-bath manufactured listed at $196k.
Deal economics
- At list price, monthly cash flow is $-114 ($-1k/yr) — negative.
- To cash-flow at today's rent, offer at most $176k (10.3% below list).
- Meets the 1% rule at list price ($2k rent vs $196k).
- Recommended offer: $176k (10.3% below list) — sets the bar for cash-flow.
- Cap rate 8.2% vs local median 4.2% in Largo — top-decile yield for the area; either an underpriced asset or a hidden risk that comps aren't pricing in. Stress-test before assuming the spread holds.
Location & tenants
- Location reads 82/100 on livability (#82 in FL, #1,240 nationally) — a professional / high-income tenant draw. Strengths: commute A+, cost of living A+, housing A+; Watch: employment D+, amenities F.
- Pinellas (suburban): math 51% / reading 51% proficiency, ranked #31 of 73 in FL (top 42%) — acceptable for families but not a draw, mixed tenant base, ~2y average lease.
- Market conditions: Rents falling (-3.4%/yr); 118 active listings in the ZIP; 34 comparable units currently listed for rent nearby; rentals leasing fast (median 4d on market — plan ~1-2 weeks tenant-placement turnaround); solid renter incomes; 2,676 units permitted in Pinellas County in 2024 (1,422 in 5+ unit buildings).
- This rent runs 34% of the median local income ($77k/yr) — at the standard rent-burdened threshold; future hikes will face affordability resistance.
Forward outlook
- Local home prices are declining (-3.0%/yr); year-one equity from $1k of loan paydown is wiped out by about $6k of value loss. Plan a longer hold.
- Pinellas County population projected at +14% by 2050 — modest demand growth; plan on rents tracking national, not racing it.
Negotiation context
- It's been on market 29 days — a 2% lower offer ($194k) is reasonable based on typical stale-listing flexibility.
- Current owner paid $28k; list at $196k implies a 602% gain — meaningful room to come down on a strong offer.
Risks & watch-outs
- Watch-outs: flood insurance adds $427/mo.
- Climate carrying-cost: in FEMA flood zone AE (mandatory federal flood insurance); severe wind risk, 99% chance of damaging wind over 30y; extreme-heat days projected 6→21/yr by 2055 (HVAC capex compounding) — expect insurance premiums to compound above CPI over the hold.
Questions for the listing agent
- What do current leases actually rent for vs. the listed asking? Can we see a recent rent roll and the last 12 months of T-12 income?
- What's the actual annual flood-insurance premium (NFIP or private), and is the property in a SFHA with mandatory coverage?
- What does the HOA fee cover, when was the last increase, and are there any pending special assessments or reserve-fund shortfalls?
- Is there a deadline driving the sale (1031 exchange, divorce, estate, relocation)? That informs how much negotiation room exists.
- What's the average days-on-market for RENTAL listings here right now (not sales)? A rising rental-DOM trend means longer vacancies and softer asking-rent achievability than the comps imply.
- What's the recent tenant-quality profile in this submarket — average credit score on applications, eviction rate, late-payment / NSF rate, and stable-employment percentage? A property-management company in the area should have these aggregated.
- How much new for-sale + rental construction is in the pipeline within 1–3 miles? Heavy new supply typically softens prices + rents 12–24 months out; constrained supply supports both.
Investment metrics
- 1% rule
- 1.11% ✓
- Cap rate
- 8.20%
- Cash-on-cash
- 6.82%
- DSCR
- 1.30
- GRM
- 7.5
CMA / ARV
- ARV (on-the-fly)
- $199,584
- Comps found
- 2
Show comp detail 2 sales within ~0.75 mi
| Address | Dist | Beds/Ba | Sqft | Sold | Price | $/sf | Match |
|---|---|---|---|---|---|---|---|
| 10330 Broadview Dr #68 | 0.56mi | 2/2.0 | 1,296 (0%) | 19mo | $195,000 | $150 | 58 |
| 10527 Tahitian Ln #111 | 0.53mi | 2/2.0 | 1,104 (-15%) | 8mo | $170,000 | $154 | 44 |
Match score weights: distance 35% · size 25% · config 20% · recency 20%. Top-matched comps best support the ARV.
Projected returns pro-forma
-3.0% appreciation · 0.0% rent growth · sell at horizon
- IRR
- -25.0%
- Equity multiple
- 0.18×
- Total profit
- $-45,150
- Equity at exit
- $29,299
- IRR
- -41.7%
- Equity multiple
- -0.31×
- Total profit
- $-71,961
- Equity at exit
- $16,990
Cash invested: $55,020 (down + closing). Projections, not guarantees.
Landlord ↔ Tenant lean methodology
- Overall (STATE)
- 87 Strongly Landlord-Friendly
- State Florida
- 87 Strongly Landlord-Friendly · R+3
- County
- — inherits STATE
- City
- — inherits STATE
ZIP-level market 33773
- Rents YoY
- -3.4%
- Active inventory
- 118
- Price-to-rent
- 7.5×
Monthly cashflow live
- Estimated rent
- $2,172 high interval (Pro) →
- Mortgage (P&I)
- −$1,030
- Tax from tax record
- −$79 /mo · $951/yr
- Insurance
- −$82
- Flood insurance flood zone
- −$427 /mo · $5,118/yr
- HOA
- −$212
- Vacancy / Maint / Mgmt
- −$456
- Net cashflow
- $-114
Break-even live
UW: 25.0% down · 7.5% · 30yr · 1.5% tax · 5.0% vac · 8.0% maint · 8.0% mgmt
Financing live
Cash to close
- Down payment
- $49,125
- Closing costs
- $5,895
- Reserves months
- —
- Total cash needed
- —
Loan-product check · same deal, 3 products live
Conventional
25% down · 7.5% · 30yr
- Down + closing
- —
- Monthly P&I
- —
- Monthly cashflow
- —
- DSCR
- —
- Eligible?
- —
Personal DTI + credit; lowest rate.
DSCR
20% down · 8.5% · 30yr
- Down + closing
- —
- Monthly P&I
- —
- Monthly cashflow
- —
- DSCR
- —
- Eligible?
- —
No personal income docs; deal must DSCR.
Hard money
10% down · 12.0% · 12mo
- Down + closing
- —
- Monthly P&I
- —
- Monthly cashflow
- —
- DSCR
- —
- Eligible?
- —
Short-term bridge; refi at stabilization.
Rent comps 34 comps
| Address | Beds | Baths | Sqft | Rent | $/sqft | DOM | Units | Dist |
|---|---|---|---|---|---|---|---|---|
| 10160 Sailwinds Blvd S Largo, FL | 2.0 | 2.0 | 901 | $1,950 | $2.16 | 24d | 2 | 0.29mi |
| 10155 Sailwinds Blvd S #204 Largo, FL | 2.0 | 2.0 | 1018 | $1,750 | $1.72 | 2d | 1 | 0.31mi |
| 10580 112th Ave Largo, FL | 3.0 | 1.0 | 925 | $1,995 | $2.16 | 4d | 1 | 0.40mi |
| 10495 118th Ave Largo, FL | 3.0 | 2.0 | 1169 | $2,250 | $1.92 | 4d | 1 | 0.40mi |
| 10560 114th Ter Largo, FL | 3.0 | 1.0 | 1232 | $3,000 | $2.44 | 4d | 1 | 0.42mi |
| 10100 Sailwinds Blvd N #206 Largo, FL | 3.0 | 2.0 | 1155 | $1,850 | $1.60 | 3d | 1 | 0.51mi |
| 12261 Sailwinds Dr #203 Largo, FL | 3.0 | 2.0 | 1139 | $1,800 | $1.58 | 4d | 1 | 0.57mi |
| 12293 Sailwinds Dr #203 Largo, FL | 3.0 | 2.0 | 1155 | $2,050 | $1.77 | 13d | 1 | 0.58mi |
| 11707 108th St Unit 1018171P Largo, FL | 3.0 | 2.0 | 1259 | $3,119 | $2.48 | 2d | 1 | 0.62mi |
| 11290 109th Ln Largo, FL | 2.0 | 1.0 | 988 | $1,995 | $2.02 | 24d | 1 | 0.67mi |
| 10887 111th Pl N Largo, FL | 3.0 | 2.0 | 1300 | $2,389 | $1.84 | 21d | 1 | 0.67mi |
| 10659 108th St Largo, FL | 3.0 | 1.5 | 1380 | $2,550 | $1.85 | 24d | 1 | 0.69mi |
| 12217 104th Ln Largo, FL | 3.0 | 2.0 | 1534 | $2,495 | $1.63 | 4d | 1 | 0.70mi |
| 12651 Seminole Blvd #44 Largo, FL | 2.0 | 1.5 | 1000 | $1,450 | $1.45 | 24d | 1 | 0.82mi |
| 12100 Seminole Blvd Largo, FL | 2.0 | 2.0 | 1050 | $1,750 | $1.67 | 24d | 1 | 0.83mi |
| 10932 104th Ave Largo, FL | 2.0 | 1.0 | 962 | $1,950 | $2.03 | 24d | 1 | 0.87mi |
| 10932 104th Ave Largo, FL | 2.0 | 1.0 | 962 | $1,950 | $2.03 | 20d | 1 | 0.87mi |
| 9099 108th Ave Seminole, FL | 3.0 | 2.0 | 1451 | $2,600 | $1.79 | 4d | 1 | 0.95mi |
| 11201 122nd Ave Largo, FL | 1.0–2.0 | 1.0–2.0 | 867 | $2,300 | $2.65 | 4d | 2 | 1.10mi |
| 9924 109th St Seminole, FL | 3.0 | 2.0 | 1428 | $2,500 | $1.75 | 3d | 1 | 1.12mi |
| 11114 101st Ave Seminole, FL | 2.0 | 1.0 | 1135 | $2,300 | $2.03 | 3d | 1 | 1.16mi |
| 13225 101st St #116 Largo, FL | 2.0 | 2.0 | 1152 | $1,600 | $1.39 | 4d | 1 | 1.17mi |
| 11310 92nd St Largo, FL | 3.0 | 2.0 | 1600 | $3,100 | $1.94 | 4d | 1 | 1.20mi |
| 9814 110th Ln Seminole, FL | 2.0 | 2.0 | 1750 | $2,600 | $1.49 | 3d | 1 | 1.23mi |
| 9814 110th Ln Seminole, FL | 2.0 | 2.0 | 1750 | $2,500 | $1.43 | 2d | 1 | 1.23mi |
| 11013 Temple Ave Seminole, FL | 3.0 | 1.0 | 951 | $2,050 | $2.16 | 4d | 1 | 1.28mi |
| 9881 113th St #215 Seminole, FL | 2.0 | 2.0 | 1150 | $1,600 | $1.39 | 17d | 1 | 1.34mi |
| 9925 Ulmerton Rd #74 Largo, FL | 2.0 | 1.5 | 1140 | $1,800 | $1.58 | 17d | 1 | 1.38mi |
| 9209 Seminole Blvd #139 Seminole, FL | 2.0 | 1.5 | 1015 | $1,800 | $1.77 | 24d | 1 | 1.38mi |
| 11557 124th Ter Largo, FL | 3.0 | 2.0 | 1601 | $3,495 | $2.18 | 17d | 1 | 1.38mi |
| 9992 86th St Seminole, FL | 2.0 | 2.0 | 945 | $1,900 | $2.01 | 3d | 1 | 1.40mi |
| 10888 Temple Ave Seminole, FL | 2.0 | 2.0 | 1101 | $2,150 | $1.95 | 3d | 1 | 1.44mi |
| 9209 Seminole Blvd Seminole, FL | 2.0 | 1.5 | 1015 | $1,700 | $1.67 | 3d | 2 | 1.45mi |
| 9209 Seminole Blvd Seminole, FL | 2.0 | 1.5 | 1015 | $1,675 | $1.65 | 4d | 3 | 1.45mi |
HOA detail
- Monthly dues
- $212 · $2,544/yr
Listing history 15 events
-
2026-06-18days on market $196,500 Active 29 DOM
-
2026-06-17days on market $196,500 Active 28 DOM
-
2026-06-16days on market $196,500 Active 27 DOM
-
2026-06-15days on market $196,500 Active 26 DOM
-
2026-06-13days on market $196,500 Active 24 DOM
-
2026-06-09days on market $196,500 Active 20 DOM
-
2026-06-08days on market $196,500 Active 19 DOM
-
2026-06-07days on market $196,500 Active 18 DOM
-
2026-06-04days on market $196,500 Active 15 DOM
-
2026-06-03days on market $196,500 Active 14 DOM
-
2026-06-02days on market $196,500 Active 13 DOM
-
2026-06-01days on market $196,500 Active 12 DOM
-
2026-05-31days on market $196,500 Active 11 DOM
-
2026-05-20$196,500 Active
-
1994-02-04soldstatus $28,000
ⓘ Source: listings_history table (triggers on properties + properties_extension) + one-shot
backfill from property_details.listing_events for pre-trigger history.
Tax reassessment forecast FL · Resets to sale price
- Current annual tax
- $951 · $79/mo
- Projected year-2 tax
- $1,631 · $136/mo
- Expected delta
- +$680/yr (+$57/mo · 71.5%)
ⓘ Screening estimate from a state-policy table — verify with the county assessor before closing.
Climate risk First Street
- Flood 9/10 Extreme FEMA zone AE · 99% chance over 30 yrs
- Wildfire 3/10 Moderate
- Heat 10/10 Extreme 6 d/yr ≥107°F today · 21 d/yr by 30 yrs out
- Wind 10/10 Extreme 99% chance of damaging wind over 30 yrs
- Air quality 3/10 Moderate 2 unhealthy d/yr today · 3 by 30 yrs out
Nearby sold comps map
Loading sold comps map…
Walkable amenities ~0.75 mi
Loading nearby amenities…
Taxation est. · year 1
- Rental income
- $26,067
- − Mortgage interest
- −$11,007
- − Property taxes
- −$951
- − Insurance
- −$6,101
- − Repairs & maintenance
- −$2,085
- − Management
- −$2,085
- − HOA
- −$2,544
- − Depreciation
- −$5,716
- Taxable loss
- −$4,423
- Est. tax savings @ 24.0%
- +$1,062
- After-tax cash flow
- $-307/yr
For passive investors: Depreciation is non-cash, so a rental often shows a tax loss while cash-flowing — sheltering income. Rental losses are passive: they offset passive income freely, and up to $25,000/yr can offset ordinary (W-2) income if you actively participate and your MAGI is under $100k (phasing out to $0 by $150k); unused losses carry forward. On sale, claimed depreciation is recaptured at up to 25%, and gains may owe capital-gains tax (a 1031 exchange can defer both). Figures are a year-1 estimate at your 24.0% rate — not tax advice; consult a CPA.
Schools (NCES district)
- District
- Pinellas
- NCES district ID
- 1201560
- Math proficiency
- 51% ▼ -5.00%
- Reading proficiency
- 51% ▼ -3.00%
- Median HH income
- $46,270
- Composite
- 43.27/100
- National rank
- #3046
- State rank
- #31 of 73 in FL
Livability — Largo
- Score
- 82/100
- State rank
- #82
- US rank
- #1240
Category grades
Schools grade is shown separately in the Schools card above.
Census & demographics
- County
- Pinellas County · 939,478 people
- City population
- 106,311
- Metro
- Tampa-St. Petersburg-Clearwater, FL
- Population (ZIP)
- 16,741
- Household income
- $76,867
- Rent vs Own
- Severe rent burden
- 314.0
Population outlook (Pinellas County) Hauer SSP2
- Today (2025)
- 1,027,532 people
- By 2030
- 1,063,586 · +3.5%
- By 2040
- 1,125,020 · +9.5%
- By 2050
- 1,168,637 · +13.7%
- By 2075
- 1,265,188 · +23.1%
- By 2100
- 1,260,357 · +22.7%
Race, ethnicity, and origin ACS 2023
- Neighborhood character
- Predominantly White (75%)
- Race & ethnicity
- White 75% Two or more races 8% Hispanic / Latino 8% Asian 7% Black 5%
- Hispanic origin (detail)
- Mexican 2% Puerto Rican 3% Cuban 2%
- Common ancestry
- Romanian 4% Lithuanian 3% Italian 2%
- Foreign-born
- 12% · Canada, Vietnam, South Korea
- Languages at home
- 83% English-only · Spanish 5% Vietnamese 3% Other Indo-European 2%
Political lean MEDSL · Pinellas
- 2024 margin
- Lean R (+5.2) · D 46.9% · R 52.1%
- 2008→2024 swing
- -13.5pp toward R · 2008: 8.3pp · 2024: -5.2pp
- All cycles
- 2024: R+5.2 2020: D+0.2 2016: R+1.1 2012: D+5.6 2008: D+8.3
Not yet ingested
- Civics
- —
Market trends
- HPI YoY
- ▼ -367.92%
- Current HPI
- 319.4536
- Rent YoY
- ▼ -3.37%
- Metro
- Tampa-St. Petersburg-Clearwater, FL
- State GDP YoY
- ▲ 3.28%
- F500 in state
- 36
Industry mix (Fortune 500 HQ in FL)
| Industry | F500 HQs | Revenue |
|---|---|---|
| Industrial Technology | 2 | $29B |
|
||
| Insurance | 2 | $17B |
|
||
| Retail | 1 | $60B |
|
||
| Technology Distribution | 1 | $58B |
|
||
| Homebuilding | 1 | $35B |
|
||
| Technology Manufacturing | 1 | $35B |
|
||
Price history
+601.8% since first listed2 events — show timeline
- 2026-05-20 Listed $196,500 Stellar MLS as Distributed by MLS Grid
- 1994-02-04 Sold (Public Records) $28,000 Public Records
Property tax history
-6.2%/yrLatest (2025): $951 · +9.0% YoY. Source: county tax records.
Cash-flow waterfall
monthlySold comps — $/sqft
last 12 mo · ≤1 miLoading sold comps…