21807 107th Ave SE #28 · Kent, WA
Flood risk 1/10 · Minimal
- FEMA flood zone
- X (unshaded)
- Chance of flooding over 30 yrs
- 0.0%
- Est. flood insurance / yr
- $507 – $1,088
Fire risk 1/10 · Minimal
- Est. fire insurance / yr
- $604 – $1,122
Heat risk 3/10 · Minor
- Hot days now (above 87°F)
- 7 days/yr
- Hot days in 30 yrs
- 14 days/yr
Wind risk 1/10 · Minimal
- Chance of severe wind over 30 yrs
- —
Air-quality risk 8/10 · Major
- Unhealthy air days now
- 12 days/yr
- Unhealthy air days in 30 yrs
- 12 days/yr
Risk factors via First Street. Map © Google.
Why this score? — see what drove the C- grade
The composite is a weighted blend of 9 inputs, each scored 0–100. Each bar is that input's sub-score; the figure is the points it added to the 100-point composite (weight × sub-score).
- Cash flow +15.0/30.0
- ARV discount +15.0/15.0
- 1% rule +5.0/10.0
- DSCR +5.0/10.0
- Schools +4.8/10.0
- Livability +4.0/5.0
- Rent growth +3.4/5.0
- Condition / age +2.2/5.0
- Appreciation +0.0/10.0
$69,900
🖨 Deal sheet (PDF) 📄 Offer letter ✓ Due diligence
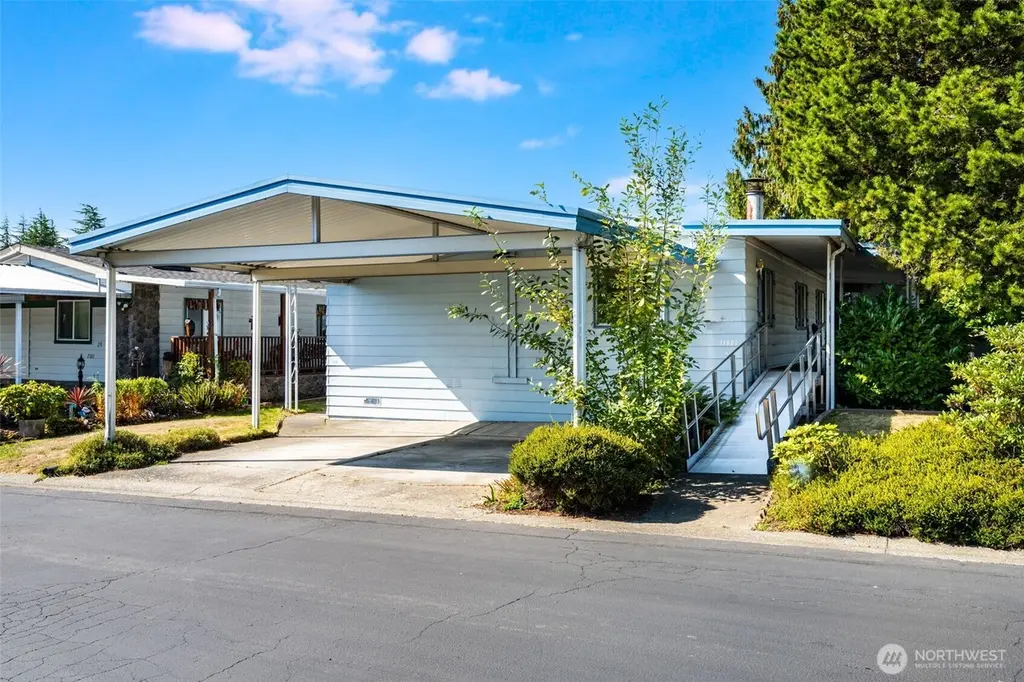
Listing remarks
SELLER SAYS SELL NOW! GREAT NEW PRICE!! Don't miss this huge home at a bargain price! Welcome home to this fabulous opportunity in the desirable 55+ community of Canyon View Estates. This spacious 3 bedroom/2 bath home offers 1792 square feet of well thought out living area! Skip the stairs and access the home entry and enormous covered patio using the well built metal ramp. Enjoy a large kitchen with lots of counter space for culinary adventures that adjoins a lovely formal dining room for entertaining. The living room provides a great space to relax with friends and gather around the cozy fireplace. Roof was installed in 2017. Park two cars under the wide carport. This home is located on
Key facts
- Guest parking
- Formal dining room
- Wide carport
Tags
Neighborhood map
What this means for you Summary
Snapshot
- This is a 3-bed/2.0-bath manufactured listed at $70k. Condition is rated fair.
Deal economics
- At list price, monthly cash flow is $2k ($27k/yr) — positive.
- The deal already cash-flows at list — no discount required.
- Meets the 1% rule at list price ($4k rent vs $70k).
- Recommended offer: $62k (12.0% below list) — sets the bar for market timing.
- Cap rate 45.6% vs local median 2.6% in Kent — top-decile yield for the area; either an underpriced asset or a hidden risk that comps aren't pricing in. Stress-test before assuming the spread holds.
Location & tenants
- Location reads 79/100 on livability (#109 in WA, #2,154 nationally) — a middle-class / working-renter tenant base. Strengths: amenities A+, commute A+, housing A+; Watch: crime F, cost of living F.
- Kent School District (urban): math 47% / reading 57% proficiency, ranked #109 of 291 in WA (top 38%) — acceptable for families but not a draw, mixed tenant base, ~2y average lease.
- Zoned schools: Panther Lake Elementary School (529 students, 73% FRL); Meeker Middle School (603 students, 74% FRL); Kentridge High School (2,034 students, 42% FRL) — zoned schools average 63% FRL vs 41% district-wide (22 pts higher); higher-poverty schools than district average — tighter screening recommended.
- Market conditions: Rents rising (+3.5%/yr); 169 active listings in the ZIP; 14 comparable units currently listed for rent nearby; rentals at typical pace (median 26d on market — plan ~3-4 weeks tenant-placement turnaround); solid renter incomes; 10,555 units permitted in King County in 2024 (7,119 in 5+ unit buildings).
- This rent runs 40% of the median local income ($106k/yr) — at the standard rent-burdened threshold; future hikes will face affordability resistance.
Forward outlook
- Local home prices are declining (-3.0%/yr); year-one equity from $483 of loan paydown is wiped out by about $2k of value loss. Plan a longer hold.
- King County population projected at +44% by 2050 — long-run rental-demand tailwind backs the buy-and-hold thesis.
- At projected returns (-3.0% appreciation + 3.5% rent growth), your $20k cash investment doubles in ~1 year — after that, you're playing with house money.
Negotiation context
- It's been on market 130 days — a 12% lower offer ($62k) is reasonable based on typical stale-listing flexibility.
Questions for the listing agent
- It's been on market 130 days. Have you received any prior offers? Is the seller open to a 12% concession, seller financing, or rate buy-down credit?
- Have any recent inspections been done? Can we get a copy of the seller's disclosures and any deferred-maintenance estimates?
- Built in 1979 — when were the roof, HVAC, electrical panel, plumbing, and water heater last replaced?
- Why hasn't it sold? Are there any deal-killer items the seller is aware of (foundation, flood, title, zoning, code violations)?
- Is there a deadline driving the sale (1031 exchange, divorce, estate, relocation)? That informs how much negotiation room exists.
- Crime grade is F in this area — have there been break-ins, vandalism, or insurance claims at this property in the last 3 years? What carrier currently insures it and at what premium?
- What's the average days-on-market for RENTAL listings here right now (not sales)? A rising rental-DOM trend means longer vacancies and softer asking-rent achievability than the comps imply.
- What's the recent tenant-quality profile in this submarket — average credit score on applications, eviction rate, late-payment / NSF rate, and stable-employment percentage? A property-management company in the area should have these aggregated.
- How much new for-sale + rental construction is in the pipeline within 1–3 miles? Heavy new supply typically softens prices + rents 12–24 months out; constrained supply supports both.
Investment metrics
- 1% rule
- 5.02% ✓
- Cap rate
- 45.57%
- Cash-on-cash
- 140.28%
- DSCR
- 7.24
- GRM
- 1.7
CMA / ARV
- ARV (median comp)
- $129,966
- List price
- $69,900
- Delta
- -46.22%
- Verdict
- UNDERPRICED
- Comps
- 14 within 1.0 mi
Show comp detail 5 sales within ~0.75 mi
| Address | Dist | Beds/Ba | Sqft | Sold | Price | $/sf | Match |
|---|---|---|---|---|---|---|---|
| 21807 107th Ave SE #28 | 0.00mi | 3/2.0 | 1,792 (0%) | 1mo | $60,000 | $33 | 100 |
| 22603 112th Ave SE | 0.60mi | 3/2.0 | 1,836 (+2%) | 6mo | $400,000 | $218 | 62 |
| 21920 107th Ave SE #2 | 0.07mi | 3/2.0 | 1,536 (-14%) | 14mo | $166,000 | $108 | 62 |
| 22603 115th Pl SE | 0.69mi | 3/2.0 | 1,536 (-14%) | 3mo | $470,000 | $306 | 42 |
| 22627 112th Ave SE | 0.64mi | 3/2.0 | 1,536 (-14%) | 9mo | $459,000 | $299 | 38 |
Match score weights: distance 35% · size 25% · config 20% · recency 20%. Top-matched comps best support the ARV.
Projected returns pro-forma
-3.0% appreciation · 3.53% rent growth · sell at horizon
- IRR
- —
- Equity multiple
- 7.97×
- Total profit
- $136,327
- Equity at exit
- $10,422
- IRR
- —
- Equity multiple
- 17.06×
- Total profit
- $314,363
- Equity at exit
- $6,044
Cash invested: $19,572 (down + closing). Projections, not guarantees.
Landlord ↔ Tenant lean methodology
- Overall (STATE)
- 28 Tenant-Leaning
- State Washington
- 28 Tenant-Leaning · D+8
- County
- — inherits STATE
- City
- — inherits STATE
ZIP-level market 98031
- Rents YoY
- 3.5%
- Active inventory
- 169
- Price-to-rent
- 1.7×
Monthly cashflow live
- Estimated rent
- $3,508 high interval (Pro) →
- Mortgage (P&I)
- −$367
- Tax est. 1.5%
- −$87 /mo · $1,048/yr
- Insurance
- −$29
- HOA
- −$0
- Vacancy / Maint / Mgmt
- −$737
- Net cashflow
- $2,288
Break-even live
Sensitivity live
| Price | -10% $2,336 | -5% $2,312 | +0% $2,288 | +5% $2,264 | +10% $2,240 |
|---|---|---|---|---|---|
| Rent | -10% $2,011 | -5% $2,149 | +0% $2,288 | +5% $2,426 | +10% $2,565 |
| Rate | -1.0pp $2,323 | -0.5pp $2,306 | base $2,288 | +0.5pp $2,270 | +1.0pp $2,251 |
UW: 25.0% down · 7.5% · 30yr · 1.5% tax · 5.0% vac · 8.0% maint · 8.0% mgmt
Financing live
Cash to close
- Down payment
- $17,475
- Closing costs
- $2,097
- Reserves months
- —
- Total cash needed
- —
Loan-product check · same deal, 3 products live
Conventional
25% down · 7.5% · 30yr
- Down + closing
- —
- Monthly P&I
- —
- Monthly cashflow
- —
- DSCR
- —
- Eligible?
- —
Personal DTI + credit; lowest rate.
DSCR
20% down · 8.5% · 30yr
- Down + closing
- —
- Monthly P&I
- —
- Monthly cashflow
- —
- DSCR
- —
- Eligible?
- —
No personal income docs; deal must DSCR.
Hard money
10% down · 12.0% · 12mo
- Down + closing
- —
- Monthly P&I
- —
- Monthly cashflow
- —
- DSCR
- —
- Eligible?
- —
Short-term bridge; refi at stabilization.
Rent comps 14 comps
| Address | Beds | Baths | Sqft | Rent | $/sqft | DOM | Units | Dist |
|---|---|---|---|---|---|---|---|---|
| 10324 SE 210th Pl Kent, WA | 4.0 | 3.5 | 2230 | $3,600 | $1.61 | 26d | 1 | 0.52mi |
| 11500 SE 221st Pl Kent, WA | 3.0 | 2.5 | 1770 | $3,100 | $1.75 | 45d | 1 | 0.52mi |
| 11101 SE 208th St Kent, WA | 1.0–3.0 | 1.0–2.0 | 971 | $2,565 | $2.64 | 0d | 18 | 0.55mi |
| 20805 109th Ln SE Kent, WA | 2.0 | 1.5 | 1250 | $2,700 | $2.16 | 45d | 1 | 0.62mi |
| 20803 110th Ln SE Kent, WA | 2.0 | 2.5 | 1361 | $2,845 | $2.09 | 45d | 1 | 0.62mi |
| 22720 101st Pl SE Kent, WA | 4.0 | 3.5 | 2461 | $10,500 | $4.27 | 23d | 1 | 0.65mi |
| 11019 SE 204th St Kent, WA | 3.0 | 2.5 | 2408 | $3,690 | $1.53 | 45d | 1 | 0.87mi |
| 12012 SE 210th St Kent, WA | 3.0 | 1.5 | 1230 | $1,820 | $1.48 | 26d | 1 | 1.03mi |
| 22328 88th Ave S Kent, WA | 3.0 | 3.0 | 1714 | $3,695 | $2.16 | 22d | 1 | 1.12mi |
| 9915 SE 235th Pl Kent, WA | 3.0 | 2.0 | 1250 | $2,750 | $2.20 | 22d | 1 | 1.20mi |
| 10217 SE 237th St Kent, WA | 3.0 | 3.0 | 2412 | $3,200 | $1.33 | 26d | 1 | 1.23mi |
| 23533 97th Ave S Kent, WA | 4.0 | 2.5 | 2040 | $3,300 | $1.62 | 45d | 1 | 1.29mi |
| 21627 127th Pl SE Kent, WA | 3.0 | 2.0 | 1420 | $3,095 | $2.18 | 18d | 1 | 1.29mi |
| 24028 110th Pl SE Kent, WA | 1.0–3.0 | 1.0–2.0 | 1050 | $2,547 | $2.43 | 0d | 8 | 1.49mi |
Listing history 5 events
-
2026-05-14price $69,900
-
2026-04-03price $90,000
-
2026-02-11price $99,000
-
2026-01-23price $109,500
-
2026-01-15$119,500 Active
ⓘ Source: listings_history table (triggers on properties + properties_extension) + one-shot
backfill from property_details.listing_events for pre-trigger history.
Climate risk First Street
- Flood 1/10 Low FEMA zone X (unshaded) · 0% chance over 30 yrs
- Wildfire 1/10 Low
- Heat 3/10 Moderate 7 d/yr ≥87°F today · 14 d/yr by 30 yrs out
- Wind 1/10 Low
- Air quality 8/10 Severe 12 unhealthy d/yr today · 12 by 30 yrs out
Nearby sold comps map
Loading sold comps map…
Walkable amenities ~0.75 mi
Loading nearby amenities…
Taxation est. · year 1
- Rental income
- $42,091
- − Mortgage interest
- −$3,915
- − Property taxes
- −$1,048
- − Insurance
- −$350
- − Repairs & maintenance
- −$3,367
- − Management
- −$3,367
- − Depreciation
- −$2,033
- Taxable income
- $28,010
- Est. tax owed @ 24.0%
- −$6,722
- After-tax cash flow
- $20,733/yr
For passive investors: Depreciation is non-cash, so a rental often shows a tax loss while cash-flowing — sheltering income. Rental losses are passive: they offset passive income freely, and up to $25,000/yr can offset ordinary (W-2) income if you actively participate and your MAGI is under $100k (phasing out to $0 by $150k); unused losses carry forward. On sale, claimed depreciation is recaptured at up to 25%, and gains may owe capital-gains tax (a 1031 exchange can defer both). Figures are a year-1 estimate at your 24.0% rate — not tax advice; consult a CPA.
Condition & rehab AI · 12 photos
This 3-bedroom, 2-bathroom manufactured home in a desirable 55+ community requires moderate renovations to update the kitchen and bathroom, paint the interior walls, and replace the carpeting. The home is located on a quiet street with well-maintained landscaping and a wide carport for parking two cars.
Repairs flagged
- Moderate kitchen cabinets — dated and in need of replacement
- Moderate bathroom vanity — dated and in need of replacement
- Moderate kitchen appliances — dated and in need of replacement
Value-add opportunities
- Both update kitchen cabinets and appliances — modernizing the kitchen would improve both resale and rental value
- Both update bathroom vanity and fixtures — modernizing the bathroom would improve both resale and rental value
- Both paint interior walls — painting the interior walls would improve the home's curb appeal and value
- Both replace carpeting — replacing the carpeting with hardwood or tile would improve the home's curb appeal and value
Renovation cost estimate screening
| Repair item | Severity | Est. cost |
|---|---|---|
| kitchen cabinets · dated and in need of replacement | Moderate | $3,000–15,000 |
| bathroom vanity · dated and in need of replacement | Moderate | $3,000–15,000 |
| kitchen appliances · dated and in need of replacement | Moderate | $3,000–15,000 |
| Total estimated repair cost · 3 items | $9,000–45,000 |
Value-add ROI direction
- Both update kitchen cabinets and appliances — modernizing the kitchen would improve both resale and rental value ↑
- Both update bathroom vanity and fixtures — modernizing the bathroom would improve both resale and rental value ↑
- Both paint interior walls — painting the interior walls would improve the home's curb appeal and value ↑
- Both replace carpeting — replacing the carpeting with hardwood or tile would improve the home's curb appeal and value ↑
ⓘ Cost ranges are severity-bucket heuristics (US national rule-of-thumb). Get contractor quotes + a written scope before underwriting a rehab budget.
Schools (NCES district)
- District
- Kent School District
- NCES district ID
- 5303960
- Math proficiency
- 47% ▼ -1.00%
- Reading proficiency
- 57% ▼ -1.00%
- Median HH income
- $69,823
- Composite
- 48.25/100
- National rank
- #4714
- State rank
- #109 of 291 in WA
Livability — Kent
- Score
- 79/100
- State rank
- #109
- US rank
- #2154
Category grades
Schools grade is shown separately in the Schools card above.
Census & demographics
- Census place
- Kent, WA
- County
- King County · 2,251,916 people
- City population
- 119,479
- Metro
- Seattle-Tacoma-Bellevue, WA
- Population (ZIP)
- 40,094
- Household income
- $105,965
- Rent vs Own
- Severe rent burden
- 1151.0
Population outlook (King County) Hauer SSP2
- Today (2025)
- 2,576,485 people
- By 2030
- 2,803,316 · +8.8%
- By 2040
- 3,255,921 · +26.4%
- By 2050
- 3,706,444 · +43.9%
- By 2075
- 4,746,063 · +84.2%
- By 2100
- 5,407,730 · +109.9%
Race, ethnicity, and origin ACS 2023
- Neighborhood character
- Highly diverse neighborhood (Simpson 0.77)
- Race & ethnicity
- White 36% Asian 27% Black 13% Hispanic / Latino 13% Two or more races 13% Pacific Islander 1%
- Hispanic origin (detail)
- Mexican 9%
- Common ancestry
- Italian 5% Portuguese 2% Subsaharan African 2%
- Foreign-born
- 31% · Canada, Vietnam, China
- Languages at home
- 58% English-only · Spanish 9% Other Indo-European 7% Vietnamese 4%
Political lean MEDSL · King
- 2024 margin
- Solid D (+51.7) · D 74.2% · R 22.5% · Other 3.4%
- 2008→2024 swing
- +9.6pp toward D · 2008: 42.1pp · 2024: 51.7pp
- All cycles
- 2024: D+51.7 2020: D+52.7 2016: D+50.4 2012: D+39.9 2008: D+42.1
Not yet ingested
- Civics
- —
Market trends
- HPI YoY
- ▼ -673.58%
- Current HPI
- 308.1747
- Rent YoY
- ▲ 3.53%
- Metro
- Seattle-Tacoma-Bellevue, WA
- State GDP YoY
- ▲ 4.65%
- F500 in state
- 22
Industry mix (Fortune 500 HQ in WA)
| Industry | F500 HQs | Revenue |
|---|---|---|
| Retail | 2 | $269B |
|
||
| Technology / Retail | 1 | $638B |
|
||
| Technology | 1 | $245B |
|
||
| Telecommunications | 1 | $38B |
|
||
| Food / Beverage | 1 | $36B |
|
||
| Automotive / Trucks | 1 | $34B |
|
||
Price history
-41.5% since first listed5 events — show timeline
- 2026-05-14 Price Changed $69,900 NWMLS as Distributed by MLS Grid
- 2026-04-03 Price Changed $90,000 NWMLS as Distributed by MLS Grid
- 2026-02-11 Price Changed $99,000 NWMLS as Distributed by MLS Grid
- 2026-01-23 Price Changed $109,500 NWMLS as Distributed by MLS Grid
- 2026-01-15 Listed $119,500 NWMLS as Distributed by MLS Grid
Cash-flow waterfall
monthlySold comps — $/sqft
last 12 mo · ≤1 miLoading sold comps…