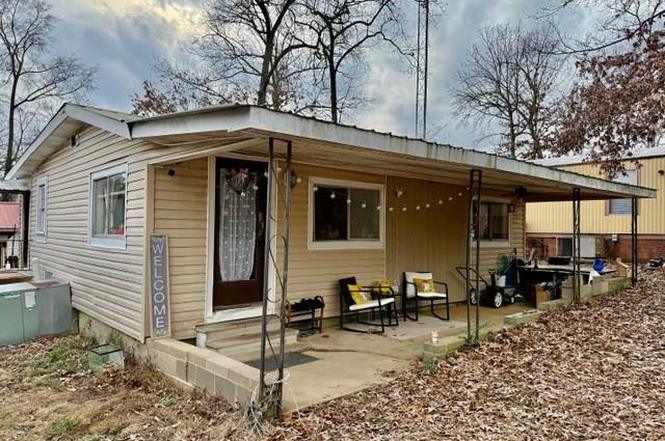
80 Tennessee Dr · Big Sandy, TN
Flood risk 2/10 · Minimal
- FEMA flood zone
- X (unshaded)
- Chance of flooding over 30 yrs
- 0.07%
- Est. flood insurance / yr
- $507 – $1,088
Fire risk 4/10 · Minor
- Est. fire insurance / yr
- $949 – $1,763
Heat risk 6/10 · Moderate
- Hot days now (above 109°F)
- 7 days/yr
- Hot days in 30 yrs
- 21 days/yr
Wind risk 4/10 · Minor
- Chance of severe wind over 30 yrs
- 12.0%
Air-quality risk 1/10 · Minimal
- Unhealthy air days now
- 0 days/yr
- Unhealthy air days in 30 yrs
- 0 days/yr
Risk factors via First Street. Map © Google.
Why this score? — see what drove the B grade
The composite is a weighted blend of 9 inputs, each scored 0–100. Each bar is that input's sub-score; the figure is the points it added to the 100-point composite (weight × sub-score).
- Cash flow +30.0/30.0
- DSCR +10.0/10.0
- 1% rule +7.7/10.0
- ARV discount +7.5/15.0
- Appreciation +6.7/10.0
- Livability +2.9/5.0
- Rent growth +2.5/5.0
- Schools +2.5/10.0
- Condition / age +2.5/5.0
$85,000
🖨 Deal sheet 📄 Offer letter ✓ Due diligence
Listing remarks
Looking for an affordable Kentucky Lake retreat? Look no further! Located in the fun loving and family friendly Lake community of Country Junction. This one does not break the bank. (conventional or cash only)
Key facts
- 5,009 sq ft lot
- Built 1940
- Listed 159 days
Property features AI
Exterior
- Parking: Open parking on a gravel surface
- Utilities: Public water; Septic tank sewer
- Home design: Single-family residence; One story; Vinyl siding
- Construction: Vinyl siding construction; Metal roof; One-level home
- Exterior features: Porch; Partial wood fencing; Metal roof
Interior
- Kitchen: Electric oven; Electric range; Refrigerator; Dishwasher
- Bedrooms: Two main-level bedrooms
- Flooring: Vinyl; Laminate
- Bathrooms: One full bathroom (main level)
- Heating & cooling: Central air; Ceiling fans; Has heating
- Interior features: Ceiling fans; Window screens; Storage
- Laundry & utility: Main-level laundry
Neighborhood map
What this means for you Summary
Snapshot
- This is a 2-bed/1.0-bath single-family listed at $85k.
Deal economics
- At list price, monthly cash flow is $352 ($4k/yr) — positive.
- The deal already cash-flows at list — no discount required.
- Meets the 1% rule at list price ($1k rent vs $85k).
- Recommended offer: $75k (12.0% below list) — sets the bar for market timing.
Location & tenants
- Location reads 58/100 on livability (#315 in TN) — a working-class tenant base; expect higher turnover. Strengths: cost of living A+, housing A-; Watch: crime F, amenities F, commute F.
- Henry County (rural): math 30% / reading 30% proficiency, ranked #60 of 139 in TN (top 43%) — families likely to look elsewhere, expect single-tenant / working-renter base with shorter leases.
- Zoned schools: Lakewood Elementary (math 38% / reading 30%, grade F, #351 of 952 statewide, top 37%, 505 students, 0% FRL); Lakewood Middle School (math 34% / reading 25%, grade F, #107 of 333 statewide, top 33%, 249 students, 0% FRL) — zoned schools average 0% FRL vs 55% district-wide (55 pts lower); this property's tenant base skews higher-income than the district average.
- Market conditions: 57 active listings in the ZIP; 19 units permitted in Henry County in 2024 (0 in 5+ unit buildings).
Forward outlook
- In year one you build about $4k of equity ($588 loan paydown + $3k appreciation (3.5% local appreciation)).
- Henry County population projected to shrink 10% by 2050 — rents likely to lag national; underwrite the cash flow, not the appreciation.
- At projected returns (3.5% appreciation + 3.0% rent growth), your $24k cash investment doubles in ~3 years — after that, you're playing with house money.
- By year 9, paydown + projected appreciation supports a ~$30k cash-out refi (75% LTV) — recoverable capital for the next deal without selling this one.
Negotiation context
- It's been on market 160 days — a 12% lower offer ($75k) is reasonable based on typical stale-listing flexibility.
- Current owner paid $10k; list at $85k implies a 750% gain — meaningful room to come down on a strong offer.
Risks & watch-outs
- Watch-outs: built in 1940 — expect roof / HVAC / electrical / plumbing capex.
- Climate carrying-cost: extreme-heat days projected 7→21/yr by 2055 (HVAC capex compounding) — expect insurance premiums to compound above CPI over the hold.
Questions for the listing agent
- It's been on market 160 days. Have you received any prior offers? Is the seller open to a 12% concession, seller financing, or rate buy-down credit?
- Built in 1940 — when were the roof, HVAC, electrical panel, plumbing, and water heater last replaced?
- Why hasn't it sold? Are there any deal-killer items the seller is aware of (foundation, flood, title, zoning, code violations)?
- Is there a deadline driving the sale (1031 exchange, divorce, estate, relocation)? That informs how much negotiation room exists.
- Schools are F-rated, which usually means shorter tenancies and higher turnover. Who's the typical renter profile here, and what's been the actual vacancy rate?
- Crime grade is F in this area — have there been break-ins, vandalism, or insurance claims at this property in the last 3 years? What carrier currently insures it and at what premium?
- What's the average days-on-market for RENTAL listings here right now (not sales)? A rising rental-DOM trend means longer vacancies and softer asking-rent achievability than the comps imply.
- What's the recent tenant-quality profile in this submarket — average credit score on applications, eviction rate, late-payment / NSF rate, and stable-employment percentage? A property-management company in the area should have these aggregated.
- How much new for-sale + rental construction is in the pipeline within 1–3 miles? Heavy new supply typically softens prices + rents 12–24 months out; constrained supply supports both.
Investment metrics
- 1% rule
- 1.27% ✓
- Cap rate
- 11.26%
- Cash-on-cash
- 17.73%
- DSCR
- 1.79
- GRM
- 6.6
CMA / ARV
No comps found within radius.
Projected returns pro-forma
3.48% appreciation · 3.0% rent growth · sell at horizon
- IRR
- 25.2%
- Equity multiple
- 2.46×
- Total profit
- $34,798
- Equity at exit
- $40,561
- IRR
- 25.5%
- Equity multiple
- 4.77×
- Total profit
- $89,782
- Equity at exit
- $64,393
Cash invested: $23,800 (down + closing). Projections, not guarantees.
Landlord ↔ Tenant lean methodology
- Overall (STATE)
- 87 Strongly Landlord-Friendly
- State Tennessee
- 87 Strongly Landlord-Friendly · R+13
- County
- — inherits STATE
- City
- — inherits STATE
ZIP-level market 38256
- Home prices YoY
- 1.3%
- Active inventory
- 57
- Price-to-rent
- 6.6×
Monthly cashflow live
- Estimated rent
- $1,078 medium interval (Pro) →
- Mortgage (P&I)
- −$446
- Tax from tax record
- −$19 /mo · $223/yr
- Insurance
- −$35
- HOA
- −$0
- Vacancy / Maint / Mgmt
- −$226
- Net cashflow
- $352
Break-even live
UW: 25.0% down · 7.5% · 30yr · 1.5% tax · 5.0% vac · 8.0% maint · 8.0% mgmt
Financing live
Cash to close
- Down payment
- $21,250
- Closing costs
- $2,550
- Reserves months
- —
- Total cash needed
- —
Loan-product check · same deal, 3 products live
Conventional
25% down · 7.5% · 30yr
- Down + closing
- —
- Monthly P&I
- —
- Monthly cashflow
- —
- DSCR
- —
- Eligible?
- —
Personal DTI + credit; lowest rate.
DSCR
20% down · 8.5% · 30yr
- Down + closing
- —
- Monthly P&I
- —
- Monthly cashflow
- —
- DSCR
- —
- Eligible?
- —
No personal income docs; deal must DSCR.
Hard money
10% down · 12.0% · 12mo
- Down + closing
- —
- Monthly P&I
- —
- Monthly cashflow
- —
- DSCR
- —
- Eligible?
- —
Short-term bridge; refi at stabilization.
Listing history 19 events
-
2026-06-18days on market $85,000 Active 160 DOM
-
2026-06-17days on market $85,000 Active 159 DOM
-
2026-06-16days on market $85,000 Active 158 DOM
-
2026-06-15days on market $85,000 Active 157 DOM
-
2026-06-13days on market $85,000 Active 155 DOM
-
2026-06-12days on market $85,000 Active 154 DOM
-
2026-06-09days on market $85,000 Active 151 DOM
-
2026-06-08days on market $85,000 Active 150 DOM
-
2026-06-08days on market $85,000 Active 149 DOM
-
2026-06-07days on market $85,000 Active 148 DOM
-
2026-06-03days on market $85,000 Active 145 DOM
-
2026-06-02days on market $85,000 Active 144 DOM
-
2026-06-01days on market $85,000 Active 143 DOM
-
2026-05-31days on market $85,000 Active 142 DOM
-
2026-01-09$85,000 Active
-
2005-04-27soldstatus $10,000
-
1999-06-12soldstatus $15,000
-
1995-04-13soldstatus $12,000
-
1988-03-08soldstatus $7,500
ⓘ Source: listings_history table (triggers on properties + properties_extension) + one-shot
backfill from property_details.listing_events for pre-trigger history.
Tax reassessment forecast TN · Resets to sale price
- Current annual tax
- $223 · $19/mo
- Projected year-2 tax
- $604 · $50/mo
- Expected delta
- +$380/yr (+$32/mo · 170.6%)
ⓘ Screening estimate from a state-policy table — verify with the county assessor before closing.
Climate risk First Street
- Flood 2/10 Low FEMA zone X (unshaded) · 7% chance over 30 yrs
- Wildfire 4/10 Moderate
- Heat 6/10 Major 7 d/yr ≥109°F today · 21 d/yr by 30 yrs out
- Wind 4/10 Moderate 12% chance of damaging wind over 30 yrs
- Air quality 1/10 Low 0 unhealthy d/yr today · 0 by 30 yrs out
Nearby sold comps map
Loading sold comps map…
Walkable amenities ~0.75 mi
Loading nearby amenities…
Taxation est. · year 1
- Rental income
- $12,932
- − Mortgage interest
- −$4,761
- − Property taxes
- −$223
- − Insurance
- −$425
- − Repairs & maintenance
- −$1,035
- − Management
- −$1,035
- − Depreciation
- −$2,473
- Taxable income
- $2,981
- Est. tax owed @ 24.0%
- −$715
- After-tax cash flow
- $3,504/yr
For passive investors: Depreciation is non-cash, so a rental often shows a tax loss while cash-flowing — sheltering income. Rental losses are passive: they offset passive income freely, and up to $25,000/yr can offset ordinary (W-2) income if you actively participate and your MAGI is under $100k (phasing out to $0 by $150k); unused losses carry forward. On sale, claimed depreciation is recaptured at up to 25%, and gains may owe capital-gains tax (a 1031 exchange can defer both). Figures are a year-1 estimate at your 24.0% rate — not tax advice; consult a CPA.
Schools (NCES district)
- District
- Henry County
- NCES district ID
- 4701830
- Math proficiency
- 30% ▼ -3.00%
- Reading proficiency
- 30% ▼ -6.00%
- Median HH income
- $41,770
- Composite
- 25.42/100
- National rank
- #7457
- State rank
- #60 of 139 in TN
Livability — Big Sandy
- Score
- 58/100
- State rank
- #315
- US rank
- #21412
Category grades
Schools grade is shown separately in the Schools card above.
Census & demographics
- Population (ZIP)
- 2,994
Population outlook (Henry County) Hauer SSP2
- Today (2025)
- 31,750 people
- By 2030
- 31,277 · -1.5%
- By 2040
- 30,064 · -5.3%
- By 2050
- 28,675 · -9.7%
- By 2075
- 25,767 · -18.8%
- By 2100
- 22,318 · -29.7%
Race, ethnicity, and origin ACS 2023
- Neighborhood character
- Predominantly White (97%)
- Race & ethnicity
- White 97%
- Common ancestry
- Slovak 2% Serbian 1% Lithuanian 1%
- Foreign-born
- 1% · China
- Languages at home
- 98% English-only · Spanish 1% Chinese 1%
Political lean MEDSL · Henry
- 2024 margin
- Solid R (+55.3) · D 21.8% · R 77.1% · Other 1.1%
- 2008→2024 swing
- -33.0pp toward R · 2008: -22.4pp · 2024: -55.3pp
- All cycles
- 2024: R+55.3 2020: R+51.1 2016: R+49.8 2012: R+30.2 2008: R+22.4
Not yet ingested
- Civics
- —
Market trends
- HPI YoY
- ▲ 3.48%
- Current HPI
- 264.1122
- Rent YoY
- —
- Metro
- —
- State GDP YoY
- ▲ 2.78%
- F500 in state
- 22
Industry mix (Fortune 500 HQ in TN)
| Industry | F500 HQs | Revenue |
|---|---|---|
| Healthcare | 3 | $91B |
|
||
| Retail | 3 | $72B |
|
||
| Transportation / Logistics | 1 | $88B |
|
||
| Paper / Packaging | 1 | $19B |
|
||
| Insurance | 1 | $13B |
|
||
| Energy | 1 | $12B |
|
||
Price history
+1033.3% since first listed5 events — show timeline
- 2026-01-09 Listed $85,000 TVAR
- 2005-04-27 Sold (Public Records) $10,000 Public Records
- 1999-06-12 Sold (Public Records) $15,000 Public Records
- 1995-04-13 Sold (Public Records) $12,000 Public Records
- 1988-03-08 Sold (Public Records) $7,500 Public Records
Property tax history
+2.0%/yrLatest (2025): $223 · +3.7% YoY. Source: county tax records.
Cash-flow waterfall
monthlySold comps — $/sqft
last 12 mo · ≤1 miLoading sold comps…