 9-Plex
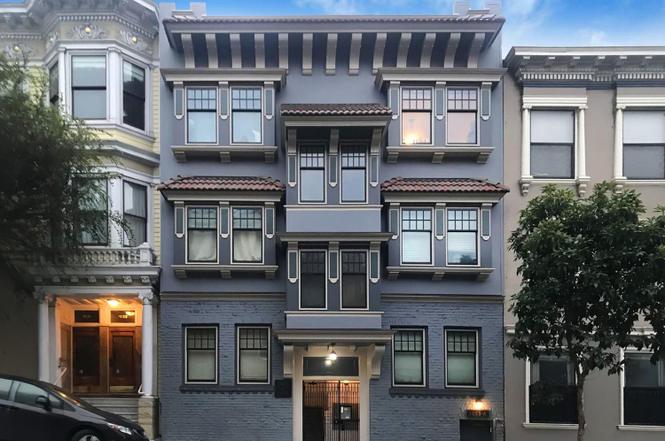
1043-1053 Fell St · San Francisco, CA
Flood risk 1/10 · Minimal
- FEMA flood zone
- X (unshaded)
- Chance of flooding over 30 yrs
- 0.0%
- Est. flood insurance / yr
- $507 – $1,088
Fire risk 1/10 · Minimal
- Est. fire insurance / yr
- $659 – $1,223
Heat risk 2/10 · Minimal
- Hot days now (above 76°F)
- 7 days/yr
- Hot days in 30 yrs
- 17 days/yr
Wind risk 1/10 · Minimal
- Chance of severe wind over 30 yrs
- —
Air-quality risk 8/10 · Major
- Unhealthy air days now
- 15 days/yr
- Unhealthy air days in 30 yrs
- 15 days/yr
Risk factors via First Street. Map © Google.
Why this score? — see what drove the A- grade
The composite is a weighted blend of 9 inputs, each scored 0–100. Each bar is that input's sub-score; the figure is the points it added to the 100-point composite (weight × sub-score).
- Cash flow +30.0/30.0
- 1% rule +10.0/10.0
- DSCR +10.0/10.0
- Appreciation +9.6/10.0
- ARV discount +7.5/15.0
- Rent growth +5.0/5.0
- Schools +5.0/10.0
- Livability +3.8/5.0
- Condition / age +2.5/5.0
$3,950,000
🖨 Deal sheet (PDF) 📄 Offer letter ✓ Due diligence
Multi-family units
County records classify this as Multi-Family (5+ Unit). Listing-text estimate: 9 units. confirmed
5+ unit building — per-unit beds/baths from public records are typically unavailable; the breakdown below (if shown) is an estimate from the listing text.
Listing remarks MLS
Attractive 9-Unit building in Alamo Square/Hayes Valley with substantial upside in rents. Unit mix consists of five 2-Bedroom units, one 1-Bedroom, and 3 studios. Excellent layouts, large kitchens, ample storage. Three 2-Bedroom units delivered vacant. Very nice common outdoor space. Coin-op laundry.
Key facts
- Fire alarm upgrade
- Renovated units
- Soft-story retrofit
Tags
Property features AI
Finance
- Financial info: 9 total units, 9 units currently leased; Units are not furnished
- HOA & community: No association fee
Exterior
- Home design: Residential income property (multi-family, 5 or more units); Built in 1905
- Construction: Year built 1905
- Exterior features: Lot approximately 4,120.8 square feet (0.0946 acres); No specific lot features reported
Interior
- Bedrooms: 10 total bedrooms
- Interior features: Total living area approximately 7,669 square feet; Assessor-provided building area
Neighborhood map
What this means for you Summary
Snapshot
- This is a 9 × 10-bed/?-bath units multifamily listed at $3.95M.
Deal economics
- At list price, monthly cash flow is $22k ($267k/yr) — positive. Per door: $2k/mo.
- The deal already cash-flows at list — no discount required.
- Meets the 1% rule at list price ($63k rent vs $3.95M).
- Recommended offer: $3.71M (6.0% below list) — sets the bar for market timing.
- Cap rate 13.1% vs local median 2.1% in San Francisco — top-decile yield for the area; either an underpriced asset or a hidden risk that comps aren't pricing in. Stress-test before assuming the spread holds.
Location & tenants
- Location reads 76/100 on livability (#90 in CA, #3,143 nationally) — a middle-class / working-renter tenant base. Strengths: amenities A+, commute A+, employment A+; Watch: crime F, cost of living F.
- San Francisco Unified (urban): math 50% / reading 56% proficiency, ranked #322 of 1,400 in CA (top 23%) — acceptable for families but not a draw, mixed tenant base, ~2y average lease.
- Market conditions: Rents rising fast (+18.2%/yr); 71 active listings in the ZIP; high-income renter base; 750 units permitted in San Francisco County in 2024 (688 in 5+ unit buildings).
- At $62,728/mo this rent would consume 451% of the median local household income ($167k/yr) (locally 1811% of renters already pay >50% of income on rent) — very limited rent-growth headroom before tenants either downsize or default.
Forward outlook
- In year one you build about $394k of equity ($27k loan paydown + $366k appreciation (9.3% local appreciation)).
- San Francisco County population projected at +39% by 2050 — long-run rental-demand tailwind backs the buy-and-hold thesis.
- At projected returns (9.3% appreciation + 8.0% rent growth), your $1.11M cash investment doubles in ~2 years — after that, you're playing with house money.
- By year 2, paydown + projected appreciation supports a ~$632k cash-out refi (75% LTV) — recoverable capital for the next deal without selling this one.
Negotiation context
- It's been on market 90 days — a 6% lower offer ($3.71M) is reasonable based on typical stale-listing flexibility.
- 2 sale attempts since 18y ago with the ask held roughly flat each time — persistent listings suggest the price (not the market) is what's stuck; bring a comps-based counter.
- Current owner paid $2.24M; list at $3.95M implies a 76% gain — meaningful room to come down on a strong offer.
Risks & watch-outs
- Watch-outs: built in 1905 — expect roof / HVAC / electrical / plumbing capex.
Questions for the listing agent
- It's been on market 90 days. Have you received any prior offers? Is the seller open to a 6% concession, seller financing, or rate buy-down credit?
- Can we see the unit-by-unit rent roll, current vacancy, and any below-market leases? What's the average tenancy length?
- What capital expenditures (roof, boiler, parking lot, exteriors) have been made in the last 5 years, and what's planned in the next 2?
- Built in 1905 — when were the roof, HVAC, electrical panel, plumbing, and water heater last replaced?
- Why hasn't it sold? Are there any deal-killer items the seller is aware of (foundation, flood, title, zoning, code violations)?
- Is there a deadline driving the sale (1031 exchange, divorce, estate, relocation)? That informs how much negotiation room exists.
- Schools are B-rated — typically a magnet for longer-tenancy family renters. What's the average tenant stay here, and is there a school-zone premium baked into asking?
- Crime grade is F in this area — have there been break-ins, vandalism, or insurance claims at this property in the last 3 years? What carrier currently insures it and at what premium?
- What's the average days-on-market for RENTAL listings here right now (not sales)? A rising rental-DOM trend means longer vacancies and softer asking-rent achievability than the comps imply.
- What's the recent tenant-quality profile in this submarket — average credit score on applications, eviction rate, late-payment / NSF rate, and stable-employment percentage? A property-management company in the area should have these aggregated.
- How much new apartment / multifamily construction is in the pipeline within 1–3 miles? Heavy new supply (>2% of stock underway) typically softens rents 12–24 months out; light construction supports rent growth.
Investment metrics
- 1% rule
- 1.59% ✓
- Cap rate
- 13.05%
- Cash-on-cash
- 24.15%
- DSCR
- 2.07
- GRM
- 5.2
CMA / ARV
No comps found within radius.
Projected returns pro-forma
9.27% appreciation · 8.0% rent growth · sell at horizon
- IRR
- 44.2%
- Equity multiple
- 4.35×
- Total profit
- $3,706,097
- Equity at exit
- $3,350,789
- IRR
- 40.9%
- Equity multiple
- 10.56×
- Total profit
- $10,578,537
- Equity at exit
- $7,015,947
Cash invested: $1,106,000 (down + closing). Projections, not guarantees.
Landlord ↔ Tenant lean methodology
- Overall (CITY)
- 0 Strongly Tenant-Friendly
- State California
- 18 Strongly Tenant-Friendly · D+13
- County
- — inherits STATE
- City San Francisco
- 0 Strongly Tenant-Friendly · D+57
ZIP-level market 94117
- Home prices YoY
- 4.2%
- Rents YoY
- 18.2%
- Active inventory
- 71
- Price-to-rent
- 47.2×
Monthly cashflow live
- Estimated rent
- $62,728 medium interval (Pro) →
- Mortgage (P&I)
- −$20,714
- Tax est. 1.5%
- −$4,938 /mo · $59,250/yr
- Insurance
- −$1,646
- HOA
- −$0
- Vacancy / Maint / Mgmt
- −$13,173
- Net cashflow
- $22,258
Break-even live
Sensitivity live
| Price | -10% $24,987 | -5% $23,622 | +0% $22,258 | +5% $20,893 | +10% $19,528 |
|---|---|---|---|---|---|
| Rent | -10% $17,302 | -5% $19,780 | +0% $22,258 | +5% $24,735 | +10% $27,213 |
| Rate | -1.0pp $24,247 | -0.5pp $23,262 | base $22,258 | +0.5pp $21,234 | +1.0pp $20,193 |
9-unit breakdown (identical units grouped — click to expand)
| Units | Beds | Baths | Est. rent |
|---|---|---|---|
| 9× units | 10 | — | $62,730 |
| #1 | 10 | — | $6,970 |
| #2 | 10 | — | $6,970 |
| #3 | 10 | — | $6,970 |
| #4 | 10 | — | $6,970 |
| #5 | 10 | — | $6,970 |
| #6 | 10 | — | $6,970 |
| #7 | 10 | — | $6,970 |
| #8 | 10 | — | $6,970 |
| #9 | 10 | — | $6,970 |
| Total (9 units) | $62,728 | ||
UW: 25.0% down · 7.5% · 30yr · 1.5% tax · 5.0% vac · 8.0% maint · 8.0% mgmt
Financing live
Cash to close
- Down payment
- $987,500
- Closing costs
- $118,500
- Reserves months
- —
- Total cash needed
- —
Loan-product check · same deal, 3 products live
Conventional
25% down · 7.5% · 30yr
- Down + closing
- —
- Monthly P&I
- —
- Monthly cashflow
- —
- DSCR
- —
- Eligible?
- —
Personal DTI + credit; lowest rate.
DSCR
20% down · 8.5% · 30yr
- Down + closing
- —
- Monthly P&I
- —
- Monthly cashflow
- —
- DSCR
- —
- Eligible?
- —
No personal income docs; deal must DSCR.
Hard money
10% down · 12.0% · 12mo
- Down + closing
- —
- Monthly P&I
- —
- Monthly cashflow
- —
- DSCR
- —
- Eligible?
- —
Short-term bridge; refi at stabilization.
Listing history 7 events
-
2026-05-08status Pending
-
2026-03-25historical Contingent - No Show
-
2026-03-24status Pending
-
2026-02-06$3,950,000 Active
-
2008-11-07soldstatus $2,240,000 Closed 301-char remark
Show marketing remark (301 chars)
Attractive 9-Unit building in Alamo Square/Hayes Valley with substantial upside in rents. Unit mix consists of five 2-Bedroom units, one 1-Bedroom, and 3 studios. Excellent layouts, large kitchens, ample storage. Three 2-Bedroom units delivered vacant. Very nice common outdoor space. Coin-op laundry.
-
2008-11-05historical 301-char remark
Show marketing remark (301 chars)
Attractive 9-Unit building in Alamo Square/Hayes Valley with substantial upside in rents. Unit mix consists of five 2-Bedroom units, one 1-Bedroom, and 3 studios. Excellent layouts, large kitchens, ample storage. Three 2-Bedroom units delivered vacant. Very nice common outdoor space. Coin-op laundry.
-
2008-08-14301-char remark
Show marketing remark (301 chars)
Attractive 9-Unit building in Alamo Square/Hayes Valley with substantial upside in rents. Unit mix consists of five 2-Bedroom units, one 1-Bedroom, and 3 studios. Excellent layouts, large kitchens, ample storage. Three 2-Bedroom units delivered vacant. Very nice common outdoor space. Coin-op laundry.
ⓘ Source: listings_history table (triggers on properties + properties_extension) + one-shot
backfill from property_details.listing_events for pre-trigger history.
Climate risk First Street
- Flood 1/10 Low FEMA zone X (unshaded) · 0% chance over 30 yrs
- Wildfire 1/10 Low
- Heat 2/10 Low 7 d/yr ≥76°F today · 17 d/yr by 30 yrs out
- Wind 1/10 Low
- Air quality 8/10 Severe 15 unhealthy d/yr today · 15 by 30 yrs out
Nearby sold comps map
Loading sold comps map…
Walkable amenities ~0.75 mi
Loading nearby amenities…
Taxation est. · year 1
- Rental income
- $752,736
- − Mortgage interest
- −$221,261
- − Property taxes
- −$59,250
- − Insurance
- −$19,750
- − Repairs & maintenance
- −$60,219
- − Management
- −$60,219
- − Depreciation
- −$114,909
- Taxable income
- $217,128
- Est. tax owed @ 24.0%
- −$52,111
- After-tax cash flow
- $214,980/yr
For passive investors: Depreciation is non-cash, so a rental often shows a tax loss while cash-flowing — sheltering income. Rental losses are passive: they offset passive income freely, and up to $25,000/yr can offset ordinary (W-2) income if you actively participate and your MAGI is under $100k (phasing out to $0 by $150k); unused losses carry forward. On sale, claimed depreciation is recaptured at up to 25%, and gains may owe capital-gains tax (a 1031 exchange can defer both). Figures are a year-1 estimate at your 24.0% rate — not tax advice; consult a CPA.
Schools (NCES district)
- District
- San Francisco Unified
- NCES district ID
- 0634410
- Math proficiency
- 50% ▬ 0.00%
- Reading proficiency
- 56% ▲ 1.00%
- Median HH income
- $81,249
- Composite
- 50.14/100
- National rank
- #4088
- State rank
- #322 of 1400 in CA
Livability — San Francisco
- Score
- 76/100
- State rank
- #90
- US rank
- #3143
Category grades
Schools grade is shown separately in the Schools card above.
Census & demographics
- Census place
- San Francisco, CA
- County
- San Francisco County · 827,552 people
- City population
- 827,552
- Metro
- San Francisco-Oakland-Berkeley, CA
- Population (ZIP)
- 36,198
- Household income
- $167,066
- Rent vs Own
- Severe rent burden
- 1811.0
Population outlook (San Francisco County) Hauer SSP2
- Today (2025)
- 1,030,936 people
- By 2030
- 1,110,409 · +7.7%
- By 2040
- 1,270,010 · +23.2%
- By 2050
- 1,435,001 · +39.2%
- By 2075
- 1,779,074 · +72.6%
- By 2100
- 1,966,767 · +90.8%
Race, ethnicity, and origin ACS 2023
- Neighborhood character
- Diverse neighborhood (Simpson 0.55)
- Race & ethnicity
- White 65% Asian 14% Two or more races 10% Hispanic / Latino 9% Black 4%
- Hispanic origin (detail)
- Mexican 5%
- Common ancestry
- Italian 5% Lithuanian 5% Romanian 3%
- Foreign-born
- 18% · Canada, China, Vietnam
- Languages at home
- 80% English-only · Spanish 5% Chinese 4% French/Haitian/Cajun 4%
Political lean MEDSL · San Francisco
- 2024 margin
- Solid D (+64.8) · D 80.3% · R 15.5% · Other 4.1%
- 2008→2024 swing
- -5.7pp toward R · 2008: 70.5pp · 2024: 64.8pp
- All cycles
- 2024: D+64.8 2020: D+72.5 2016: D+76.1 2012: D+70.2 2008: D+70.5
Not yet ingested
- Civics
- —
Market trends
- HPI YoY
- ▲ 9.27%
- Current HPI
- 228.7304
- Rent YoY
- ▲ 18.24%
- Metro
- San Francisco-Oakland-Berkeley, CA
- State GDP YoY
- ▲ 3.21%
- F500 in state
- 116
Industry mix (Fortune 500 HQ in CA)
| Industry | F500 HQs | Revenue |
|---|---|---|
| Technology | 27 | $1,492B |
|
||
| Financial Services | 3 | $174B |
|
||
| Retail | 3 | $44B |
|
||
| Insurance | 3 | $26B |
|
||
| Media / Entertainment | 2 | $115B |
|
||
| Pharmaceuticals / Biotech | 2 | $62B |
|
||
Price history
+76.3% since first listed7 events — show timeline
- 2026-05-08 Pending — San Francisco MLS
- 2026-03-25 Contingent — San Francisco MLS
- 2026-03-24 Pending — San Francisco MLS
- 2026-02-06 Listed $3,950,000 San Francisco MLS
- 2008-11-07 Sold (MLS) $2,240,000 San Francisco MLS
- 2008-11-05 Delisted — San Francisco MLS
- 2008-08-14 Listed — San Francisco MLS
Cash-flow waterfall
monthlySold comps — $/sqft
last 12 mo · ≤1 miLoading sold comps…